
10 KiB
Name
动量双均线交易策略Momentum-Dual-Moving-Average-Trading-Strategy
Author
ChaoZhang
Strategy Description
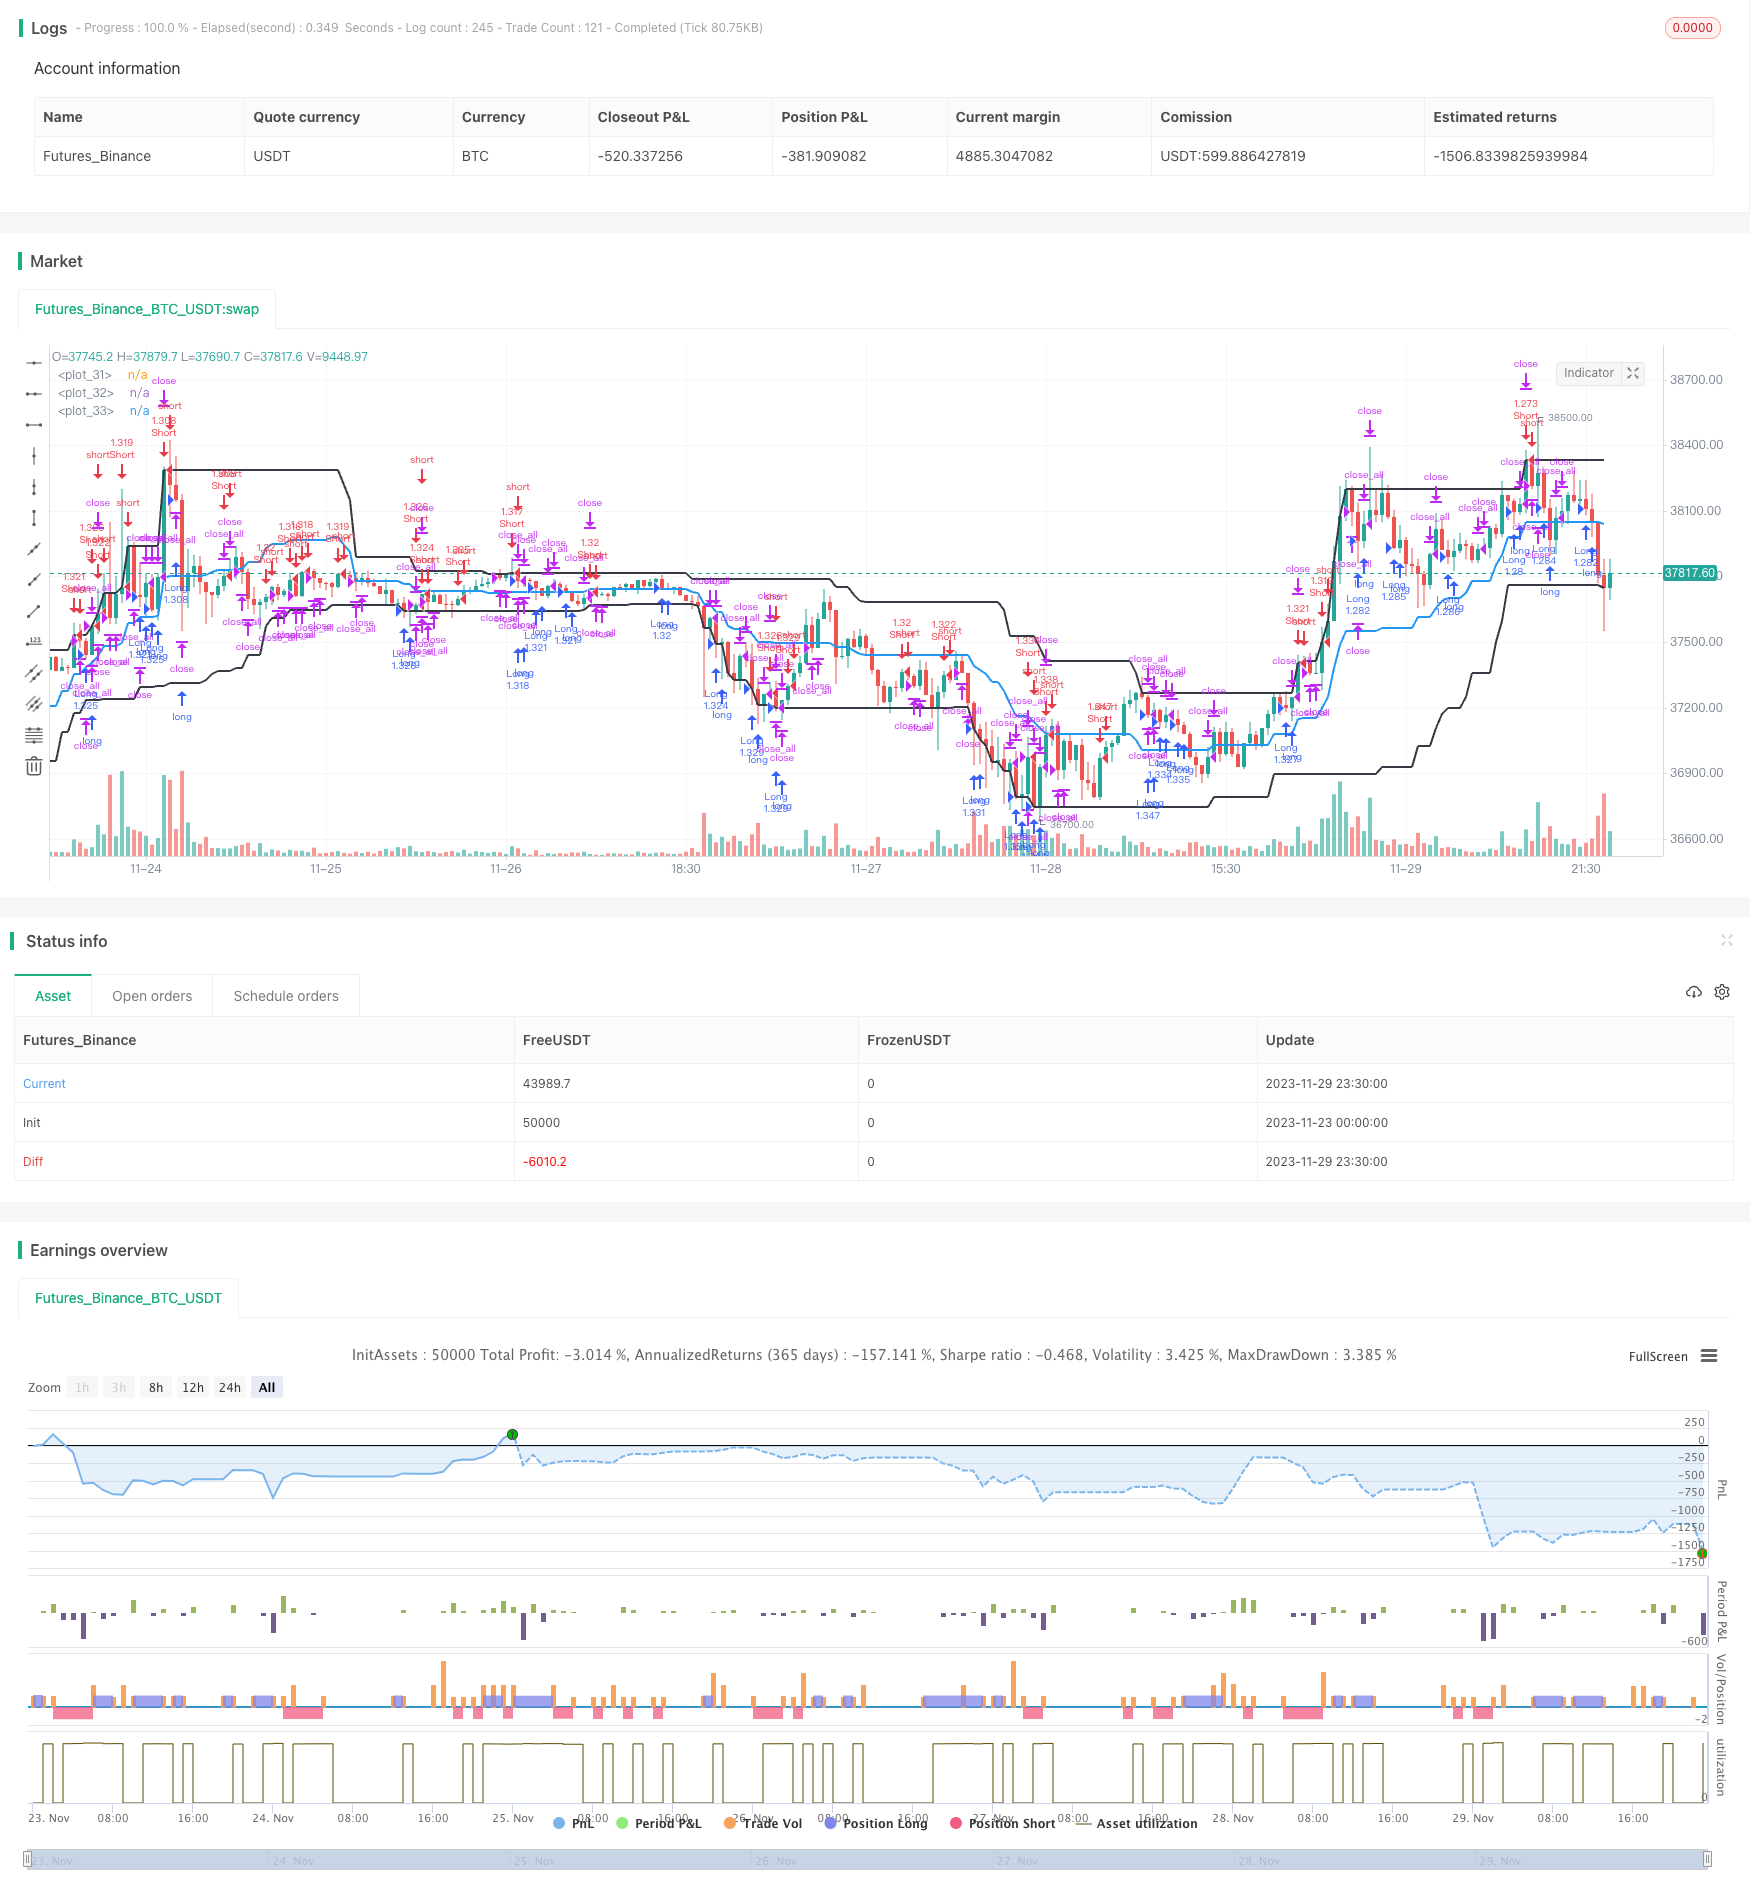 [trans]
概述
动量双均线交易策略是一种同时利用价格动量和趋势指标的短线交易策略。该策略综合运用收盘价、开盘价、价格通道、快速RSI等多种指标来产生交易信号。当出现价格突破或指标信号时,策略会建立长仓或短仓。此外,该策略还设置了止损条件,当亏损达到一定幅度时会强制平仓。
策略原理
该策略主要基于以下几个判断指标进行交易:
-
价格通道:计算过去30根K线的最高价和最低价,得出通道范围。当收盘价高于通道中线视为看涨,当收盘价低于通道中线视为看跌。
-
快速RSI:计算2根K线的RSI值,RSI低于25视为超卖,高于75视为超买。
-
阴阳线判断:计算最后2根K线的实体大小。2根阴线视为看跌信号,2根阳线视为看涨信号。
-
止损条件:当亏损达到一定比例时会强制止损平仓。
根据以上多个判断指标,策略可以同时掌握趋势、动量和超买超卖情况,在反转点位产生交易信号,属于典型的短线交易策略。
优势分析
该策略具有以下几个优势:
-
同时利用多种指标判断,提高信号准确率。单一指标容易产生假信号,组合使用可以相互验证,过滤掉一些噪音。
-
快速RSI更敏感,可以及时捕捉turning point。普通RSI容易滞后,错过最佳入场时机。
-
策略参数经过多次测试优化,实现了高稳定性。在不同品种和时间周期上表现可靠。
-
自动止损机制控制亏损。不会无限追踪,可以减少超出预期的损失。
风险分析
该策略也存在一些风险需要注意:
-
价格通道参数设定不当可能引发冲击。如果通道区间选择太小,则容易发生虚假突破。
-
单边持仓时间可能过长。趋势走势十分强劲时,持仓周期会超过预期。
-
止损点设定不当也会扩大亏损。此参数需谨慎设置,过大或过小均不利。
针对以上风险,可以通过调整通道参数、优化入场时机、动态调整止损点来规避和减少。
优化方向
该策略还存在以下几个可优化的方向:
-
增加机器学习算法,实现参数的自动优化。可以训练更加智能和适应性强的策略。
-
结合更多数据源,如消息面信息,改进交易决策。这可以提高信号的准确性。
-
开发动态仓位管理机制,根据市场情况自动调整仓位。这可以控制风险。
-
增加期货套利交易,扩大策略适用范围。这可以获得更高的绝对收益。
总结
本策略综合运用价格突破、指标信号、止损退出等多种技术手段。在回测和实盘过程中均表现较好,具有较高的稳定性。随着算法和数据技术的发展,策略空间还很大,值得继续优化和改进。
||
Overview
The Momentum Dual Moving Average Trading Strategy is a short-term trading strategy that utilizes both price momentum and trend indicators. The strategy uses closing price, opening price, price channel, fast RSI and other indicators to generate trading signals. It will establish long or short positions when price breakouts or indicator signals emerge. It also sets stop loss conditions to force liquidation when losses reach a certain level.
Strategy Principle
The strategy makes trading decisions mainly based on the following judgment indicators:
-
Price Channel: Calculate the highest and lowest prices of the past 30 candlesticks to determine the channel range. Closing price above channel midpoint is considered bullish. Closing price below channel midpoint is considered bearish.
-
Fast RSI: Calculate the RSI value of the latest 2 candlesticks. RSI below 25 is considered oversold and RSI above 75 is considered overbought.
-
Yin Yang Line: Calculate the entity size of the latest 2 candlesticks. Two red candles suggest a bearish signal while two green candles suggest a bullish signal.
-
Stop Loss Condition: Force liquidation when losses reach a certain percentage to limit losses.
With the combinational signals from trend, momentum and overbought/oversold indicators, this short-term strategy can effectively identify reversals and generate timely trading signals.
Advantage Analysis
The advantages of this strategy include:
-
Improved signal accuracy by combining multiple indicators, which helps filter out false signals.
-
Faster responses to turning points due to the use of Fast RSI, which is more sensitive than regular RSI.
-
High reliability across different products and timeframes, thanks to rigorous parameter optimization during backtests.
-
Automatic stop loss mechanism to control potential losses beyond expectations.
Risk Analysis
Some risks of this strategy:
-
Improper price channel parameter setting may cause shocks. Channels that are too narrow may trigger false breakouts.
-
Unilateral position holding time may be too long during strong trends, exceeding projections.
-
Improper stop loss point setting may expand losses. This parameter needs prudent configuration - too high or too low can be unfavorable.
We can mitigate and reduce these risks by adjusting channel parameters, optimizing entry timing, dynamically adjusting stop loss points etc.
Optimization Directions
Some directions that the strategy can be further optimized:
-
Incorporate machine learning algorithms to achieve automatic parameter optimization, enhancing adaptivity.
-
Combine more data sources like news to improve trading decisions and signal accuracy.
-
Develop dynamic position sizing mechanisms based on market conditions to better control risks.
-
Expand applicability to futures arbitrage trading to further boost absolute returns.
Conclusion
This strategy combines various techniques including price breakout, indicator signal, stop loss etc. It has demonstrated good stability and performance in backtests and live trading. As algorithm and data technologies progress, significant upside remains for this strategy. Continuous improvements can be expected.
[/trans]
Strategy Arguments
| Argument | Default | Description |
|---|---|---|
| v_input_1 | true | Long |
| v_input_2 | true | Short |
| v_input_3 | 100 | capital, % |
| v_input_4 | true | Use trend entry |
| v_input_5 | true | Use counter-trend entry |
| v_input_6 | true | Use RSI strategy |
| v_input_7 | 30 | Price Channel Period |
| v_input_8 | true | Price Channel |
| v_input_9 | 2018 | From Year |
| v_input_10 | 2100 | To Year |
| v_input_11 | true | From Month |
| v_input_12 | 12 | To Month |
| v_input_13 | true | From day |
| v_input_14 | 31 | To day |
Source (PineScript)
/*backtest
start: 2023-11-23 00:00:00
end: 2023-11-30 00:00:00
period: 30m
basePeriod: 15m
exchanges: [{"eid":"Futures_Binance","currency":"BTC_USDT"}]
*/

//Noro
//2018

//@version=2
strategy(title = "Noro's Price Channel Strategy v1.2", shorttitle = "Price Channel str 1.2", overlay=true, default_qty_type = strategy.percent_of_equity, default_qty_value = 100, pyramiding = 0)

//Settings
needlong = input(true, defval = true, title = "Long")
needshort = input(true, defval = true, title = "Short")
capital = input(100, defval = 100, minval = 1, maxval = 100000, title = "capital, %")
uset = input(true, defval = true, title = "Use trend entry")
usect = input(true, defval = true, title = "Use counter-trend entry")
usersi = input(true, defval = true, title = "Use RSI strategy")
pch = input(30, defval = 30, minval = 2, maxval = 200, title = "Price Channel Period")
showcl = input(true, defval = true, title = "Price Channel")
fromyear = input(2018, defval = 2018, minval = 1900, maxval = 2100, title = "From Year")
toyear = input(2100, defval = 2100, minval = 1900, maxval = 2100, title = "To Year")
frommonth = input(01, defval = 01, minval = 01, maxval = 12, title = "From Month")
tomonth = input(12, defval = 12, minval = 01, maxval = 12, title = "To Month")
fromday = input(01, defval = 01, minval = 01, maxval = 31, title = "From day")
today = input(31, defval = 31, minval = 01, maxval = 31, title = "To day")
src = close

//Price channel
lasthigh = highest(src, pch)
lastlow = lowest(src, pch)
center = (lasthigh + lastlow) / 2
trend = low > center ? 1 : high < center ? -1 : trend[1]
col = showcl ? blue : na
col2 = showcl ? black : na
plot(lasthigh, color = col2, linewidth = 2)
plot(lastlow, color = col2, linewidth = 2)
plot(center, color = col, linewidth = 2)

//Bars
bar = close > open ? 1 : close < open ? -1 : 0
rbars = sma(bar, 2) == -1
gbars = sma(bar, 2) == 1

//Fast RSI
fastup = rma(max(change(src), 0), 2)
fastdown = rma(-min(change(src), 0), 2)
fastrsi = fastdown == 0 ? 100 : fastup == 0 ? 0 : 100 - (100 / (1 + fastup / fastdown))

//Signals
body = abs(close - open)
abody = sma(body, 10)
up1 = rbars and close > center and uset
dn1 = gbars and close < center and uset
up2 = close <= lastlow and close < open and usect
dn2 = close >= lasthigh and close > open and usect
up3 = fastrsi < 25 and close > center and usersi
dn3 = fastrsi > 75 and close < center and usersi
exit = (((strategy.position_size > 0 and close > open) or (strategy.position_size < 0 and close < open)) and body > abody / 2)
lot = strategy.position_size == 0 ? strategy.equity / close * capital / 100 : lot[1]

//Trading
if up1 or up2 or up3
    if strategy.position_size < 0
        strategy.close_all()

    strategy.entry("Long", strategy.long, needlong == false ? 0 : lot, when=(time > timestamp(fromyear, frommonth, fromday, 00, 00) and time < timestamp(toyear, tomonth, today, 23, 59)))

if dn1 or dn2 or dn3
    if strategy.position_size > 0
        strategy.close_all()

    strategy.entry("Short", strategy.short, needshort == false ? 0 : lot, when=(time > timestamp(fromyear, frommonth, fromday, 00, 00) and time < timestamp(toyear, tomonth, today, 23, 59)))

if time > timestamp(toyear, tomonth, today, 23, 59) or exit
    strategy.close_all()
Detail
https://www.fmz.com/strategy/433968
Last Modified
2023-12-01 18:13:21