
17 KiB
Name
动态RSI矩形Grid策略RSI-Box-Grid-Strategy
Author
ChaoZhang
Strategy Description
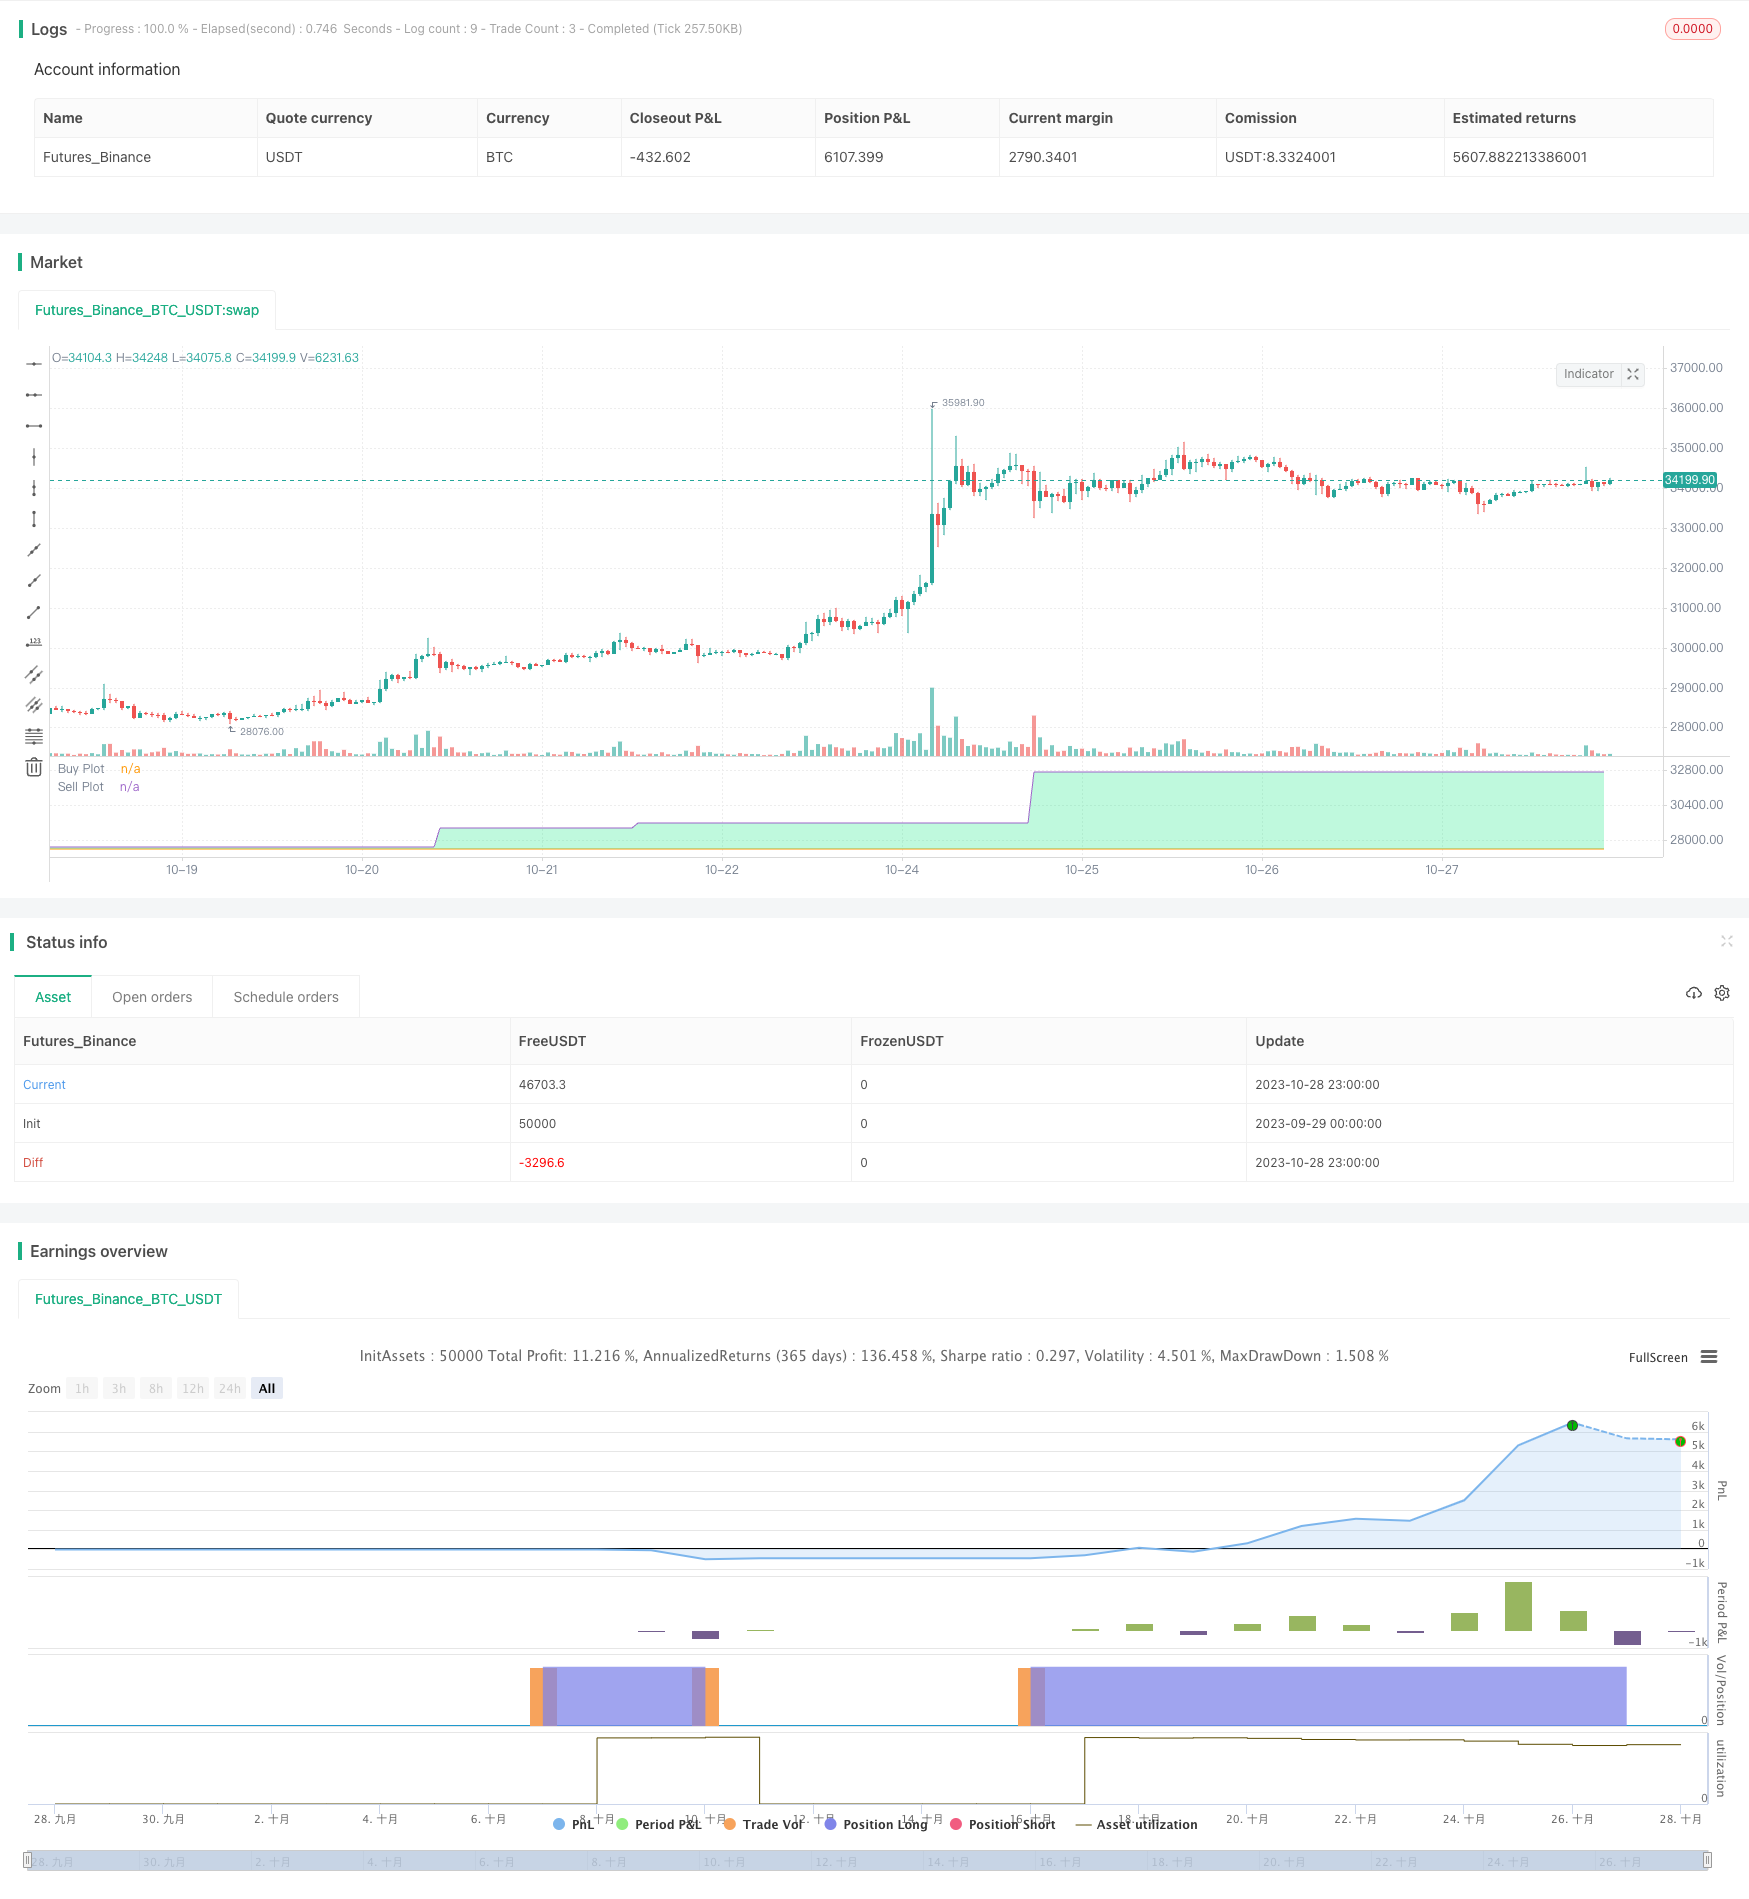
[trans]
概述
该策略是一种拟似Grid Bot的策略,主要用于算法交易。它采用一个基于交易量计算的动态、非等间距的Grid网格,并且只在RSI满足特定条件时才更新网格。它也具有突破交易的特性,与普通Grid Bot不同(典型的Grid Bot在达到更高grid线时卖出,而本策略在特定条件下跌破更低grid线时卖出)。该策略也在收盘时平仓所有的金字塔式订单。
简而言之,该策略在每次RSI穿越过买入/卖出信号线时,将网格更新为你给定的数据源(设置中的"src")的基于交易量计算的最高价/最低价。它会根据这个区间生成5条等间距的线,并用当前的数据源判断最接近的数据源的是哪条线。如果数据源突破当前线正上方的线,则发出买入信号;如果数据源跌破当前线正下方的线,则发出卖出信号。
你可以在设置中配置是否做空、数据源、RSI周期长度以及超买超卖线。
策略原理
该策略的核心逻辑是:
-
使用RSI指标判断趋势反转点,以RSI线穿越设置的超买区或超卖区作为确认信号。
-
在RSI确认信号出现时,记录一定周期内的最高价和最低价,设置为网格上下限。
-
根据上下限均分为5条网格线,实时判断价格接近哪条网格线。
-
当价格突破网格线上方线时,做多入场;当价格跌破网格线下方线时,平仓做空入场。
-
使用突破网格的方式,而不是触碰网格的普通Grid Bot方式,可以更好抓取趋势突破。
-
在交易日收盘时,平仓全部金字塔订单,防止隔夜风险。
该策略主要由以下部分组成:
-
输入参数设置:包括数据源、RSI参数、做多做空选择等。
-
RSI指标计算:计算RSI指标并判断其是否出现穿越信号。
-
动态网格设置:在RSI信号发生时记录价格范围并计算网格线。
-
信号判断:检测价格是否突破网格上下线,判断做多做空信号。
-
订单管理:发出做多做空信号并在收盘前平仓金字塔订单。
-
绘图界面:显示网格线、做多做空区域等。
通过动态更新网格,结合RSI指标的趋势判断和突破信号,使该策略能够有效跟踪趋势,在反转时及时调整方向。收盘前平仓可有效控制隔夜风险。
优势分析
该策略具有以下主要优势:
-
动态网格可以根据趋势自适应调整,而不是固定不变的网格,更具弹性。
-
只在RSI确认趋势反转时调整网格,可以过滤掉部分噪音信号。
-
使用突破信号而不是仅触碰信号,可以更准确抓取趋势转折点。
-
收盘前全部平仓,可以规避隔夜大幅波动的风险,保护利润。
-
RSI指标可以较好地判断超买超卖情况,与动态网格结合效果好。
-
采用突破模式而非回调模式,可以在趋势初期获得较好入场机会。
-
调整网格间距和交易量比例可以灵活调整策略的风险收益特征。
-
图形界面直观显示网格分布和做多做空区域。
-
可选择是否开启做空,满足不同交易者的需求。
-
规则简单清晰,易于理解实现,适合算法交易。
上述优势使该策略可以自动跟踪趋势,同时控制风险,适合量化交易实盘应用。
风险分析
该策略也存在一些潜在风险需要注意:
-
大幅震荡趋势中,可能出现止损风险。可适当放宽止损范围,或在震荡期间暂停策略。
-
夜间可能出现隔夜大幅跳空,导致开盘头寸较大。可考虑降低头寸比例规避该风险。
-
参数设置不当可能导致交易频繁或信号产生误差。应谨慎测试优化参数。
-
交易费用较高时,网格交易利润可能被反复吃掉。应适当调整交易数量或选择费率更低的交易所。
-
突破信号可能略晚于趋势反转点出现,需要合理设置突破幅度。
-
在股市平稳上涨阶段,该策略可能表现不佳。可考虑与其他指标组合使用。
-
需要足够的资金支持较大的头寸和金字塔仓位,否则效果不佳。应根据资金量调整仓位。
对策:
-
优化参数,降低交易频率,防止过度交易。
-
结合趋势指标,避开震荡期交易。
-
调整仓位,降低单笔交易比例,控制风险。
-
测试不同的突破幅度参数,平衡及时性和稳定性。
-
可以考虑与其他指标组合,利用更多市场信息。
-
增加资金量,扩大仓位规模,提高盈利空间。
通过参数优化、风险管理、与其他策略组合等方法,可以在一定程度上减少该策略的风险,使其可以稳定运作。
优化方向
该策略可以在以下方面进一步优化:
-
优化RSI参数,测试不同的RSI周期长度,寻找最佳参数组合。
-
测试不同的网格间距设置,找到最佳收益风险比的网格。
-
尝试结合其他指标过滤信号,例如MACD、KD等,提高准确率。
-
开发自适应止损策略,根据市场波动程度来动态调整止损幅度。
-
增加开仓条件,仅在趋势足够明确时开仓,避免被套。
-
进行回测优化,测试更长时间段的数据,评估参数稳定性。
-
尝试基于机器学习的动态参数优化,让策略自适应各市场环境。
-
探索结合Options的策略,利用Options对冲仓位风险。
-
根据最近行情特点,调整参数优化策略,保持策略有效性。
-
开发图形化策略优化平台,辅助快速优化测试。
通过自动化的参数优化、策略组合以及引入更多市场信息等方式,该策略可以取得更好的稳定性和收益率,成为真正可靠的量化交易策略。
总结
整体来看,该RSI矩形网格策略利用RSI指标判断趋势反转确认信号,设置价格范围动态网格,在突破网格线时交易,在日内完全平仓,形成一个灵活的趋势跟踪算法交易策略。相比固定网格策略,它可以更好地自适应市场变化。
该策略具有一定的优势,包括结合RSI指标判断趋势、动态网格自适应、突破模式交易及日内完全平仓等。这使其可以有效跟踪趋势同时控制风险。但该策略也存在一些潜在风险需要注意,比如震荡趋势下的止损风险、隔夜跳空风险等。可以通过参数优化、与其他信号组合以及风险管理手段来减少这些风险。
该策略还有许多优化的方向,通过引入更多指标、机器学习优化参数以及图形化回测平台等手段,可以将其优化成一个更稳定、收益更高的算法交易策略。总体来说,该策略为量化交易提供了一个可靠、易于操作的趋势跟踪算法框架。
||
Overview
This strategy is a pseudo-grid bot intended primarily for algorithmic trading. It uses a dynamic, volume-weighted grid that updates only when the RSI meets certain conditions. It's also a breakout strategy, whereas normal grid bots are not (typical grid bots sell when a higher grid is reached, whereas this strategy sells when a lower grid is breached under specific conditions). This strategy also closes all pyramiding orders on close.
In short, the strategy updates its grid to the volume-weighted highest/lowest values of your given source ("src" in settings) each time the RSI crosses under/over the overbought/oversold levels. From this range it generates an evenly spaced grid of five lines, and uses the current source to determine which grid line is closest. Then, if the source crosses over the line directly above, it enters a long. If the source crosses under the line directly below, it enters a short.
You can configure shorts, source, RSI length, and overbought/oversold levels in settings.
Strategy Logic
The core logic of the strategy is:
-
Use RSI indicator to determine trend reversal points, using RSI line crossovers of overbought/oversold levels as confirmation signals.
-
When RSI signal occurs, record the highest/lowest prices over a period as upper/lower limits of the grid.
-
Divide the range into 5 evenly spaced grid lines. Check realtime which line the price is closest to.
-
When price breaks over the line above, go long. When price breaks under the line below, flatten longs and go short.
-
By using breakout instead of touch, it can better catch trend reversals.
-
Close all pyramiding orders before close to avoid overnight risks.
The strategy consists of:
-
Input settings: source, RSI parameters, long/short etc.
-
RSI calculation: compute RSI and check for crossover signals.
-
Dynamic grid: record price range on RSI signals and calculate grid lines.
-
Signal check: detect price breaking grid lines for long/short signals.
-
Order management: send orders and flatten before close.
-
Charting: plot grid lines, long/short zones etc.
By dynamically updating the grid and using RSI for trend context plus breakout signals, this strategy can effectively track trends and reverse when trend changes. Flattening before close manages overnight risks.
Advantage Analysis
The main advantages of this strategy are:
-
Dynamic grid adapts to trend, unlike fixed grids.
-
Only adjusts grid on RSI confirmation, reducing noise.
-
Breakout signals catch reversals better than touch.
-
Flattens before close to avoid overnight gap risks.
-
RSI is effective for overbought/sold detection.
-
Breakout mode provides early trend entry compared to reversion.
-
Adjusting grid spacing & size allows risk tuning.
-
Visual grid & long/short zones.
-
Optional shorts to suit different traders.
-
Simple clear logic suitable for algo trading.
These make the strategy capable of auto trend tracking with risk controls for live trading.
Risk Analysis
There are also some potential risks to note:
-
Whipsaw markets can cause stop losses. Can widen stops or pause trading.
-
Overnight gaps can leave large open gaps. Can reduce position sizes.
-
Bad parameter tuning can increase trades or signal errors. Requires cautious optimization.
-
High fees may erode profits from grid trades. Should reduce trade sizes or use lower fee exchanges.
-
Breakout signals may lag reversals slightly. Need reasonable breakout thresholds.
-
May underperform in steady uptrends. Consider combining with other indicators.
-
Needs sufficient capital for larger position sizes and pyramiding, otherwise results will be poor. Adjust sizes based on capital.
Mitigations:
-
Optimize parameters to reduce trade frequency and overtrading.
-
Combine with trend indicators, avoid trading whipsaw periods.
-
Reduce trade size % and risk per trade.
-
Test different breakout thresholds for best balance of timeliness vs stability.
-
Add more entry conditions, only enter clear trends to avoid being trapped.
-
Backtest over longer periods to evaluate parameter stability.
-
Explore machine learning based dynamic parameter optimization for market adaptability.
-
Consider combining with options strategies to hedge position risks.
-
Adjust parameters based on recent market conditions to keep strategy effective.
-
Build visual optimization platforms to assist rapid testing.
With parameter optimization, combing signals, and more market info, the risks can be reduced to make a truly reliable algo strategy.
Enhancement Opportunities
The strategy can be further enhanced by:
-
Optimizing RSI parameters, testing RSI periods for best combos.
-
Testing different grid spacing for optimal risk-reward.
-
Adding other indicators to filter signals, e.g. MACD, KD etc to improve accuracy.
-
Developing adaptive stops based on market volatility.
-
Increasing entry conditions, only enter obvious trends to avoid traps.
-
Backtesting over longer periods to evaluate parameter stability.
-
Exploring machine learning based dynamic optimization for adaptability.
-
Incorporating options strategies to hedge risks.
-
Adjusting parameters based on recent market conditions to maintain effectiveness.
-
Building visual optimization platforms for rapid testing.
With automated optimization, strategy combos, more market info etc, it can achieve better stability and returns as a real trading strategy.
Summary
In summary, the RSI Box Grid strategy uses RSI to identify trend reversal confirmation, sets dynamic price range grids, trades breakouts, and flattens intraday - forming a flexible trend following algo trading strategy. Compared to fixed grids, it adapts better to market changes.
The strategy has advantages including RSI for trend context, dynamic grids, breakout trading, and full flattening intraday. This allows it to effectively track trends with risk controls. However, risks like whipsaw stop losses, overnight gaps exist, requiring optimization, combing signals, and risk management.
There are many enhancement opportunities, by incorporating more indicators, ML optimization, visual backtesting etc, it can become a more robust high-return algo trading strategy. Overall it provides a reliable, easy-to-implement trend tracking algorithmic framework for quant trading.
[/trans]
Strategy Arguments
| Argument | Default | Description |
|---|---|---|
| v_input_source_1_close | 0 | Source: close |
| v_input_int_1 | 14 | RSI Length |
| v_input_int_2 | 70 | Overbought Level |
| v_input_int_3 | 30 | Oversold Level |
| v_input_bool_1 | false | Use Shorts |
| v_input_bool_2 | false | Show Grid |
Source (PineScript)
/*backtest
start: 2023-09-29 00:00:00
end: 2023-10-29 00:00:00
period: 1h
basePeriod: 15m
exchanges: [{"eid":"Futures_Binance","currency":"BTC_USDT"}]
*/

// This source code is subject to the terms of the Mozilla Public License 2.0 at https://mozilla.org/MPL/2.0/
// © wbburgin

//@version=5
// strategy("RSI Box Strategy (pseudo-Grid Bot)", overlay=true, initial_capital = 10000,
//  default_qty_type = strategy.percent_of_equity, default_qty_value = 1, pyramiding = 33, commission_value=0.10)

src = input.source(close,"Source")
rsiLength = input.int(14,"RSI Length")
oblvl = input.int(70,"Overbought Level")
oslvl = input.int(30,"Oversold Level")
useShorts = input.bool(false,"Use Shorts",inline="B")
showGrid = input.bool(false,"Show Grid",inline="B")

rsi = ta.rsi(src,rsiLength)

rsi_crossdn = ta.crossunder(rsi,oblvl)
rsi_crossup = ta.crossover(rsi,oslvl)

highest = ta.vwma(ta.highest(src,rsiLength),rsiLength)
lowest = ta.vwma(ta.lowest(src,rsiLength), rsiLength)

gridTop = ta.valuewhen(rsi_crossdn,highest,0)
gridBottom = ta.valuewhen(rsi_crossup,lowest,0)
gridMiddle = math.avg(gridTop,gridBottom)
gridMidTop = math.avg(gridMiddle,gridTop)
gridMidBottom = math.avg(gridMiddle,gridBottom)

diff1 = math.abs(src - gridTop)
diff2 = math.abs(src - gridBottom)
diff3 = math.abs(src - gridMiddle)
diff4 = math.abs(src - gridMidTop)
diff5 = math.abs(src - gridMidBottom)

minDiff = math.min(diff1, diff2, diff3, diff4, diff5)

// Determine which line is the closest
float closestLine = na
if minDiff == diff1
    closestLine := gridTop
else if minDiff == diff2
    closestLine := gridBottom
else if minDiff == diff3
    closestLine := gridMiddle
else if minDiff == diff4
    closestLine := gridMidTop
else if minDiff == diff5
    closestLine := gridMidBottom

buyCrosses = ta.crossover(src,gridTop) or ta.crossover(src,gridBottom) or ta.crossover(src,gridMiddle) or ta.crossover(src,gridMidTop) or ta.crossover(src,gridMidBottom)
sellCrosses= ta.crossunder(src,gridTop) or ta.crossunder(src,gridBottom) or ta.crossunder(src,gridMiddle) or ta.crossunder(src,gridMidTop) or ta.crossunder(src,gridMidBottom)

condition_bull = buyCrosses
condition_bear = sellCrosses

var float bull_status_line = na
var float bear_status_line = na
var float bull_buy_line = na
var float bear_sell_line = na

if condition_bull
    bull_status_line := closestLine
if condition_bear
    bear_status_line := closestLine

if bull_status_line == gridBottom
    bull_buy_line := gridMidBottom
if bull_status_line == gridMidBottom
    bull_buy_line := gridMiddle
if bull_status_line == gridMiddle
    bull_buy_line := gridMidTop
if bull_status_line == gridMidTop
    bull_buy_line := gridTop

if bear_status_line == gridTop
    bear_sell_line := gridMidTop
if bear_status_line == gridMidTop
    bear_sell_line := gridMiddle
if bear_status_line == gridMiddle
    bear_sell_line := gridMidBottom
if bear_status_line == gridMidBottom
    bear_sell_line := gridBottom

l = ta.crossover(src,bull_buy_line)
s = ta.crossunder(src,bear_sell_line)

if l
    strategy.entry("Long",strategy.long)
if s
    strategy.close("Long")
    if useShorts
        strategy.entry("Short",strategy.short)

// Plotting
in_buy = ta.barssince(l) < ta.barssince(s)
u=plot(bull_buy_line,color=na,title="Buy Plot")
d=plot(bear_sell_line,color=na,title="Sell Plot")

plot(not showGrid?na:gridBottom,color=color.new(color.white,75),title="Grid Line -2")
plot(not showGrid?na:gridMidBottom,color=color.new(color.white,75),title="Grid Line -1")
plot(not showGrid?na:gridMiddle,color=color.new(color.white,75),title="Grid Line 0")
plot(not showGrid?na:gridMidTop,color=color.new(color.white,75),title="Grid Line 1")
plot(not showGrid?na:gridTop,color=color.new(color.white,75),title="Grid Line 2")


fill(u,d,color=in_buy ? color.new(color.lime,75) : color.new(color.red,75))
Detail
https://www.fmz.com/strategy/430551
Last Modified
2023-10-30 11:29:30