
7.3 KiB
Name
动态RSI指标交易策略Dynamic-RSI-Trading-Strategy
Author
ChaoZhang
Strategy Description
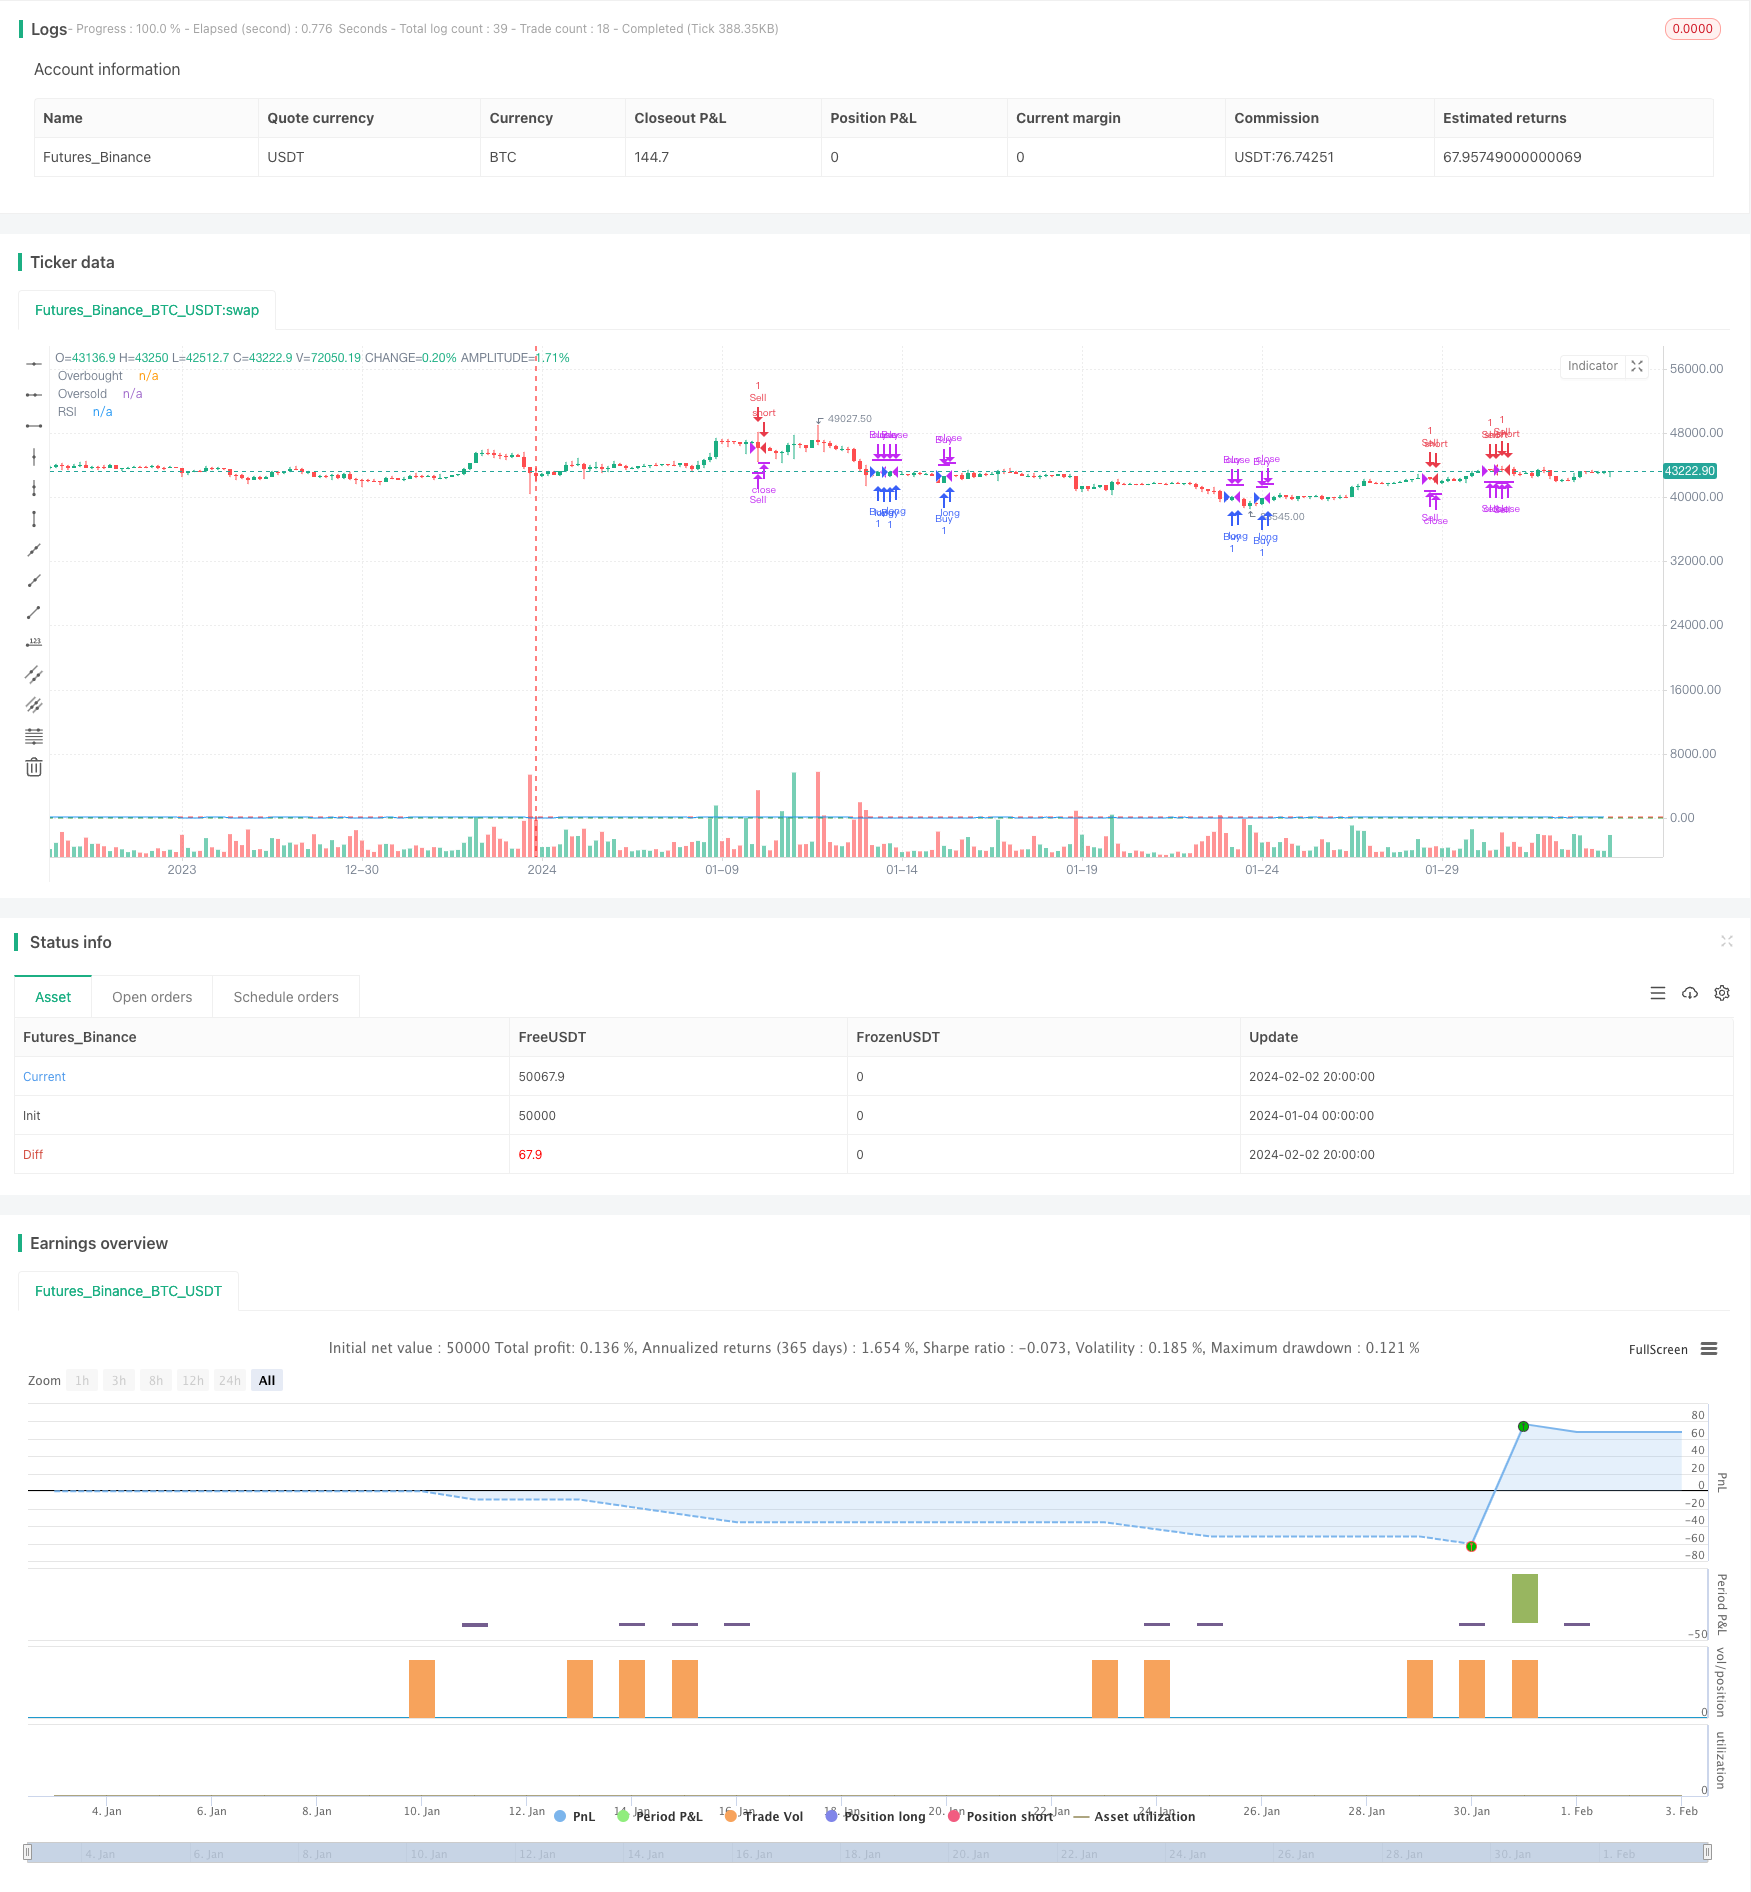 [trans]
概述
本策略通过计算RSI指标并设定超买超卖区间,结合动态止损和目标利润退出来构建交易策略。当RSI指标上穿超卖区间时做空,下穿超卖区间时做多,同时设定追踪止损和目标利润来退出仓位。
策略原理
本策略使用14日RSI指标判断市场技术形态。RSI指标反映了一段时间内涨跌动量的比例,用于判断市场是超买还是超卖。本策略中的RSI长度为14。当RSI上穿70时市场被认为超买,这时做空;当RSI下穿30时市场被认为超卖,这时做多。
另外,本策略还使用了动态追踪止损机制。当持有多头仓位时,追踪止损价为收盘价的97%;当持有空头仓位时,追踪止损价为收盘价的103%。这样可以锁定大部分利润,同时避免止损被震出。
最后,本策略还使用目标利润机制。当持仓盈利达到20%时会退出仓位。这可以锁定部分利润,避免利润回吐。
优势分析
本策略具有以下几个优势:
- 使用RSI指标判断超买超卖情况,可以及时抓住市场转折点
- 采用动态追踪止损,可以有效控制风险
- 设置目标利润水平,可以锁定部分利润
- 策略思路清晰易理解,参数较少,便于实盘操作
- 可方便优化参数如RSI长度、超买超卖水平、止损幅度等
风险分析
本策略也存在一些风险需要关注:
- RSI指标作出假信号的可能性,这会导致不必要的亏损
- 止损被突破的概率,这会扩大损失
- 目标利润设置过低无法持仓赚足够多利润的情况
针对上述风险,可以通过优化RSI参数,调整止损幅度,适当放宽目标利润要求来解决。
优化方向
本策略可以从以下几个方向进行优化:
- 优化RSI指标参数,调整超买超卖判断标准,降低假信号概率
- 增加其他指标过滤,避免RSI单一度造成错误信号
- 动态优化目标利润水平,让策略可以根据市场情况灵活调整
- 结合交易量指标,避免低量假突破
- 增加机器学习算法,自动优化参数
总结
本策略整体思路清晰,使用RSI指标判断超买超卖,配合动态止损和目标利润退出。优点是易于理解实现,风险控制到位,可扩展性强。下一步可以从提高信号质量、动态调整参数等方向进行优化,使策略更加智能化。
||
Overview
This strategy builds a trading system using RSI indicator to determine overbought and oversold levels, together with dynamic trailing stop loss and profit target exit. It goes short when RSI crosses above overbought level and goes long when RSI crosses below oversold level. Trailing stop loss and profit target exit are used to close positions.
Strategy Logic
This strategy uses 14-period RSI indicator to judge market technical patterns. RSI reflects the ratio of rising and falling power over a period of time, to tell if the market is overbought or oversold. The RSI length here is 14. When RSI crosses above 70, the market is considered overbought, and we go short. When RSI crosses below 30, the market is considered oversold, and we go long.
In addition, this strategy uses dynamic trailing stop loss mechanism. When holding long position, trailing stop price is set at 97% of closing price. When holding short position, trailing stop price is 103% of closing price. This locks in most profits while avoiding being stopped out by market noise.
Finally, this strategy uses profit target exit. When position profit reaches 20%, it will be closed. This locks in some profits and avoids profit retracement.
Advantage Analysis
The advantages of this strategy include:
- Using RSI indicator to determine overbought/oversold market effectively
- Adopting dynamic trailing stop loss to control risk
- Setting proper profit target to lock in profits
- Clear logic and few parameters, easy to implement for live trading
- Easy to optimize parameters like RSI length, overbought/oversold levels, stop loss percentage etc.
Risk Analysis
Some risks of this strategy to note:
- Potential false signals from RSI, causing unnecessary losses
- Probability of stop loss being hit, enlarging losses
- Profit target set too low, unable to hold position long enough to earn adequate profits
To cope with these risks, optimizing RSI parameters, adjusting stop loss percentage, relaxing profit target requirements reasonably can help.
Optimization Directions
Some directions to optimize the strategy:
- Optimize RSI parameters and overbought/oversold judge standards to reduce false signals
- Add other indicator filters to avoid erroneous signals caused by single RSI
- Dynamically optimize profit target according to market conditions
- Incorporate trading volume indicators to avoid low volume false breakouts
- Introduce machine learning algorithms to auto-tune parameters
Summary
The strategy has clear logic of using RSI to determine overbought/oversold market, with dynamic stops and profit taking. Its pros are easy understanding and implementation, good risk control, and high extensibility. Next step is to enhance signal quality, auto-tune parameters etc to make strategy more intelligent.
[/trans]
Strategy Arguments
| Argument | Default | Description |
|---|---|---|
| v_input_1 | 14 | RSI Length |
| v_input_2 | 3 | Trailing Stop Percentage (%) |
| v_input_3 | 20 | Profit Target Percentage (%) |
Source (PineScript)
/*backtest
start: 2024-01-04 00:00:00
end: 2024-02-03 00:00:00
period: 4h
basePeriod: 15m
exchanges: [{"eid":"Futures_Binance","currency":"BTC_USDT"}]
*/

//@version=5
strategy("Modified RSI-Based Trading Strategy", overlay=true)

// RSI settings
rsiLength = input(14, title="RSI Length")
overboughtLevel = 70
oversoldLevel = 30

// User-defined parameters
trailingStopPercentage = input(3, title="Trailing Stop Percentage (%)")
profitTargetPercentage = input(20, title="Profit Target Percentage (%)")

rsiValue = ta.rsi(close, rsiLength)

var float trailingStopLevel = na
var float profitTargetLevel = na

// Entry criteria
enterLong = ta.crossover(rsiValue, oversoldLevel)
enterShort = ta.crossunder(rsiValue, overboughtLevel)

// Exit criteria
exitLong = ta.crossover(rsiValue, overboughtLevel)
exitShort = ta.crossunder(rsiValue, oversoldLevel)

// Trailing stop calculation
if (strategy.position_size > 0)
    trailingStopLevel := close * (1 - trailingStopPercentage / 100)

if (strategy.position_size < 0)
    trailingStopLevel := close * (1 + trailingStopPercentage / 100)

// Execute the strategy
if (enterLong)
    strategy.entry("Buy", strategy.long)

if (exitLong or ta.crossover(close, trailingStopLevel) or ta.change(close) > profitTargetPercentage / 100)
    strategy.close("Buy")

if (enterShort)
    strategy.entry("Sell", strategy.short)

if (exitShort or ta.crossunder(close, trailingStopLevel) or ta.change(close) < -profitTargetPercentage / 100)
    strategy.close("Sell")

// Plot RSI and overbought/oversold levels
plot(rsiValue, title="RSI", color=color.blue)
hline(overboughtLevel, "Overbought", color=color.red, linestyle=hline.style_dashed)
hline(oversoldLevel, "Oversold", color=color.green, linestyle=hline.style_dashed)
Detail
https://www.fmz.com/strategy/441010
Last Modified
2024-02-04 17:36:41