
8.8 KiB
Name
动态移动平均线跟踪策略Dynamic-Moving-Average-Tracking-Strategy
Author
ChaoZhang
Strategy Description
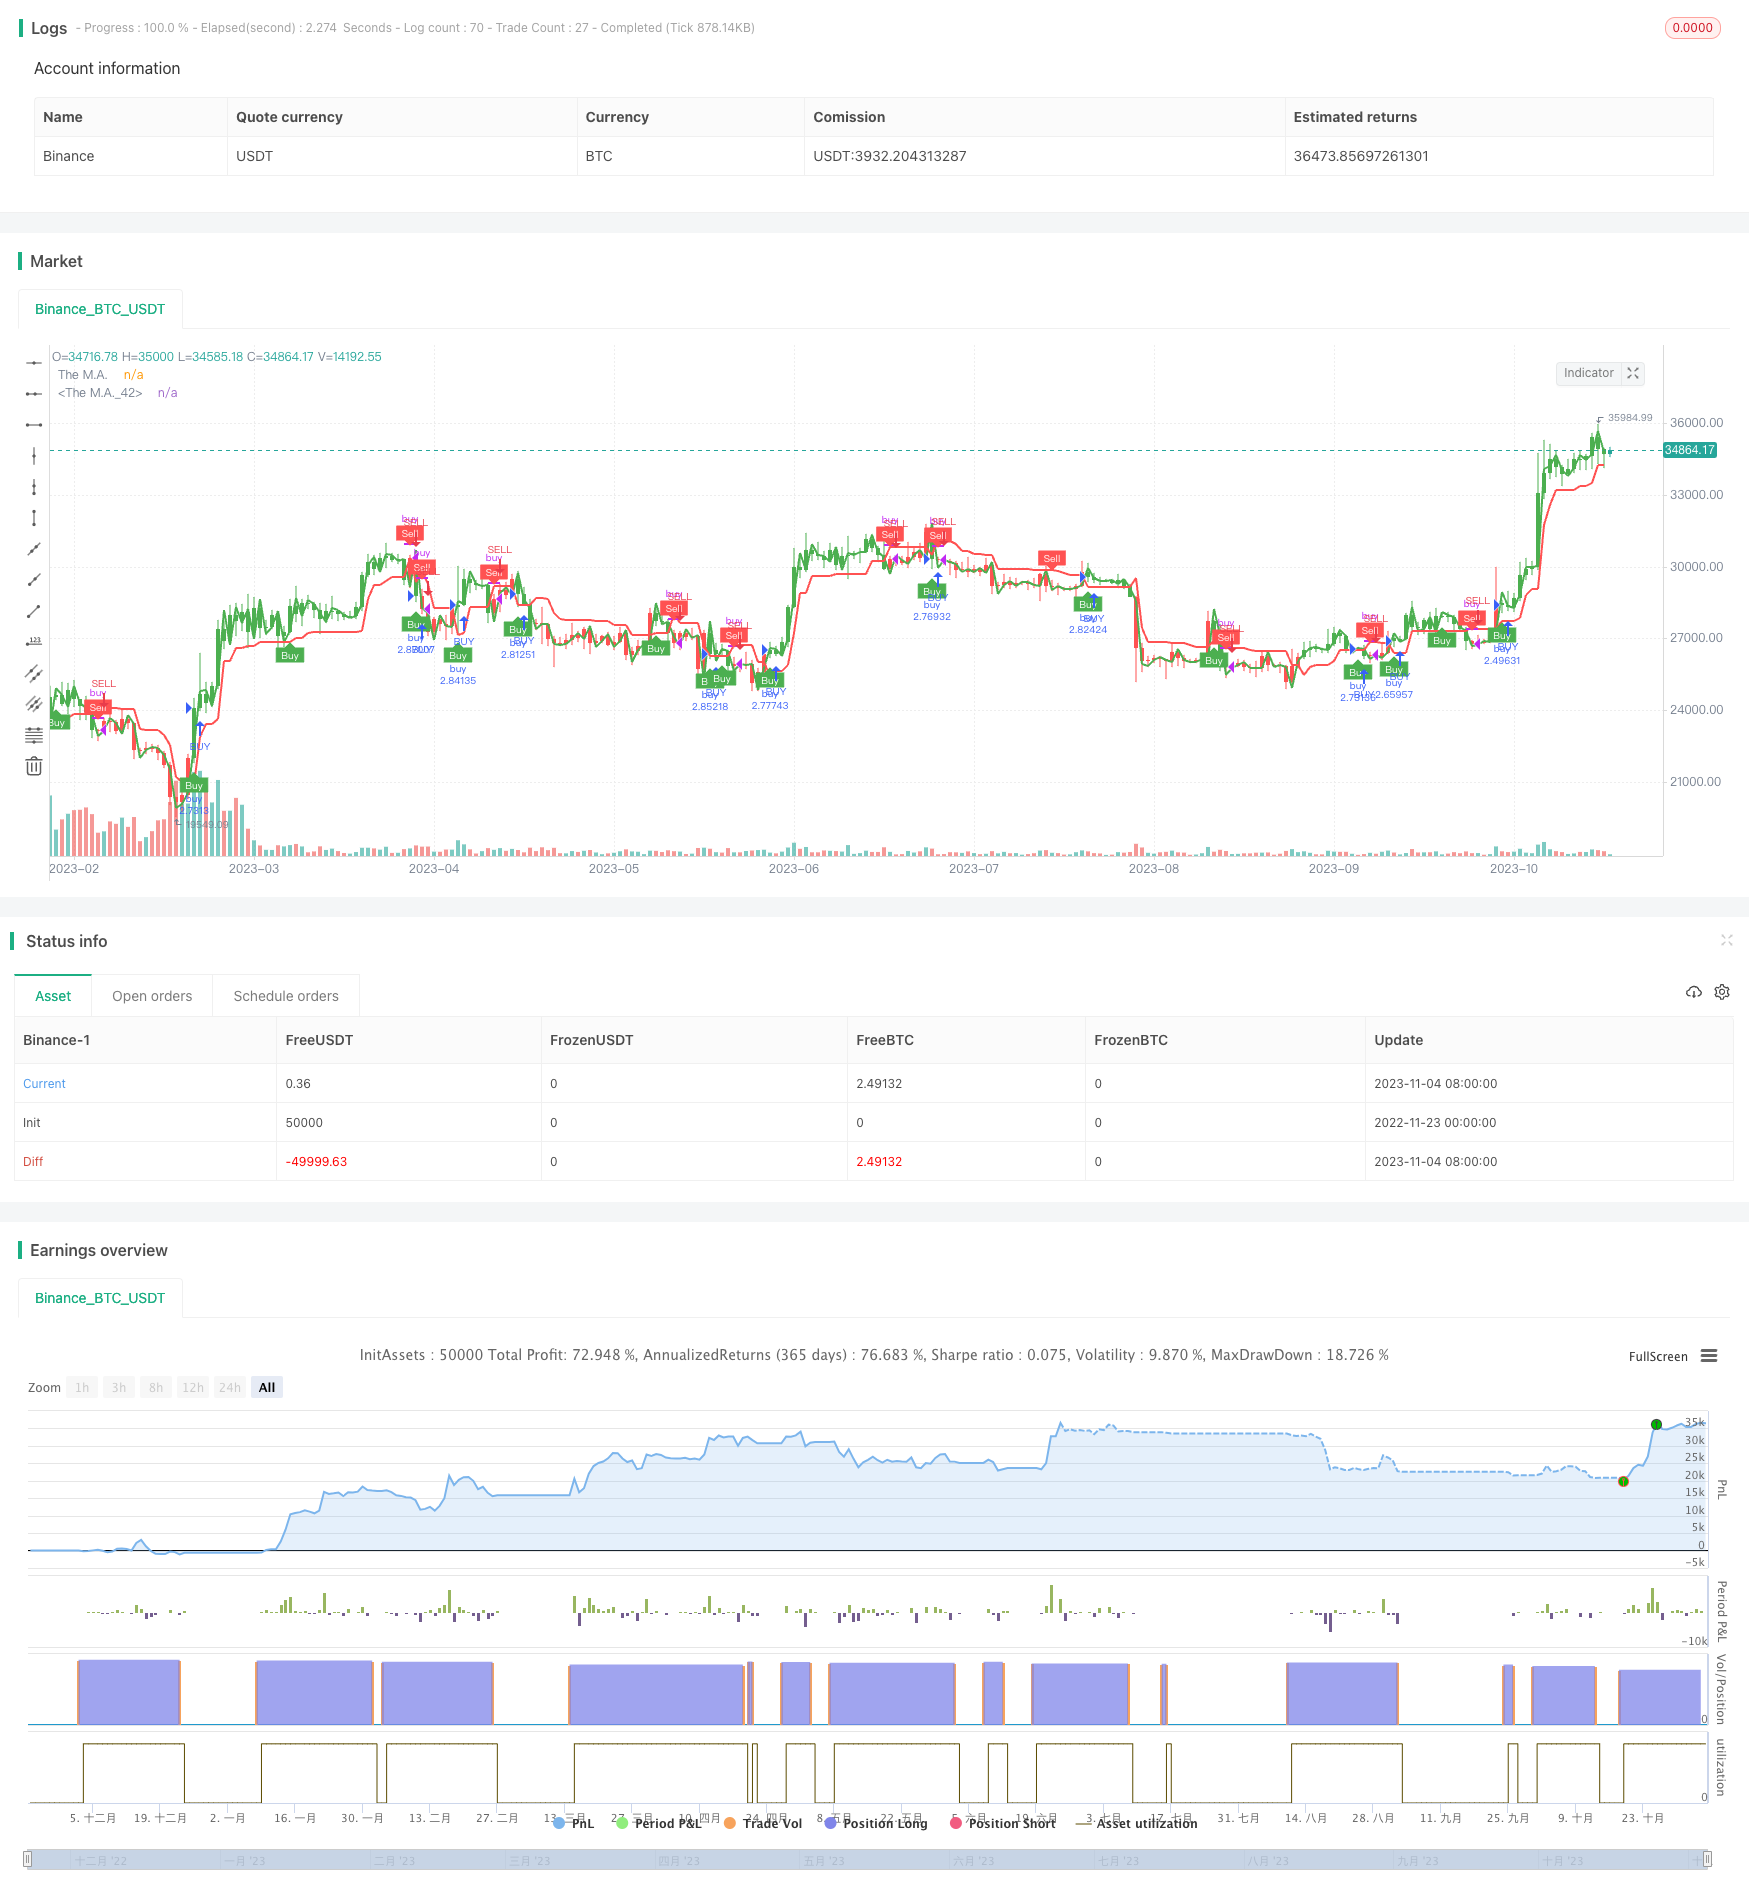
[trans]
概述
该策略的核心思想是利用动态移动平均线进行趋势跟踪,设置止损止盈,并结合海克林蜡烛技术指示做多空信号判断。ATR指标用于计算动态移动平均线和止损位置。
策略原理
该策略首先计算ATR指标,然后结合输入的价格源和参数,计算出动态移动平均线。当价格高于/低于动态移动平均线时产生做多/空信号。同时设置止损止盈位置,跟踪价格变动实时更新。
具体来说,首先计算ATR指标及参数nLoss。然后计算当前周期价格及上一周期的止损位置,比较两者更新止损线。当价格突破上一周期止损线时产生做多/空信号pos和相应颜色;交易信号产生时,画出箭头标记。最后根据止损止盈逻辑平仓。
优势分析
该策略最大的优势在于利用动态移动平均线实时跟踪价格变化。这比传统固定移动平均线更能捕捉趋势,降低止损可能性。另外结合ATR止损,可以根据市场波动幅度灵活调整止损位置,有效控制风险。
风险及解决方法
该策略主要风险在于价格可能会有较大跳空,从而突破止损线产生错误信号。此外,条件设置不当也可能导致过于频繁交易。
解决方法是优化移动平均线期数,调整ATR和止损系数大小,降低错误信号概率。另外可以设置过滤条件,避免过于密集交易。
优化方向
该策略可以从以下方面进行优化:
-
测试不同类型和周期的移动平均线,找到最佳参数组合
-
优化ATR周期参数,平衡止损灵敏度
-
添加额外过滤条件和指标,提高信号质量
-
调整止损止盈数值,优化收益风险比
总结
本策略核心思路是动态移动平均线实时跟踪价格变化,运用ATR指标动态设置止损位置,在跟踪趋势的同时严格控制风险。通过参数优化和规则修正,可以将该策略调教成一个非常实用的量化系统。
||
Overview
The core idea of this strategy is to use dynamic moving average for trend tracking, set stop loss and take profit, and combine Heikin Ashi candlestick techniques for long/short signal judgment. ATR indicator is used to calculate the dynamic moving average and stop loss position.
Principles
The strategy first calculates the ATR indicator, then combines the input price source and parameters to compute the dynamic moving average. Long/short signals are generated when price crosses above/below the dynamic moving average. Meanwhile, stop loss and take profit positions are set to track price changes in real time.
Specifically, ATR indicator and parameter nLoss are calculated first. Then current period's price and previous period's stop loss position are compared to update the stop loss line. When price breaks through previous period's stop loss line, long/short signals pos and corresponding colors are generated. When trading signals are triggered, arrow markings are plotted. Finally positions are closed based on stop loss/take profit logic.
Advantage Analysis
The biggest advantage of this strategy is the use of dynamic moving average to track price changes in real time. This captures trends better than traditional fixed moving averages and reduces chances of stop loss. Additionally, combining ATR based stop loss allows flexible adjustment of stop loss position based on market volatility to effectively control risks.
Risks and Solutions
The main risk of this strategy is that price may gap up/down significantly, causing false signals when stop loss is hit. Also, improper condition settings may lead to overly frequent trading.
Solutions include optimizing moving average period, adjusting ATR and stop loss coefficient to lower probability of false signals. Additional filters can be added to avoid overly dense trades.
Optimization Directions
The strategy can be optimized in the following aspects:
-
Test different types and periods of moving averages to find optimal parameter combinations
-
Optimize ATR period parameter to balance stop loss sensitivity
-
Add extra filters and indicators to improve signal quality
-
Adjust stop loss/take profit values to optimize risk reward ratio
Conclusion
The core idea of this strategy is to use dynamic moving average to track price changes in real time, utilizing ATR indicator to dynamically set stop loss positions, controlling risk strictly while tracking trends. Through parameter optimization and rule refinement, this strategy can be tuned into a highly practical quantitative system.
[/trans]
Strategy Arguments
| Argument | Default | Description |
|---|---|---|
| v_input_1 | true | Allow Buy? |
| v_input_2 | false | Allow Sell? |
| v_input_3 | false | Signals from Heikin Ashi Candles |
| v_input_4_open | 0 | Price Source (recommended OPEN to avoid repainting): open |
| v_input_string_1 | 0 | Moving Average Type: HMA |
| v_input_5 | 2 | This changes the MAPeriod |
| v_input_float_1 | true | This changes the sensitivity |
| v_input_6 | 11 | ATR Period |
| v_input_int_1 | 50000 | Take Profit ($) |
| v_input_int_2 | 50000 | Stop Loss ($) |
Source (PineScript)
/*backtest
start: 2022-11-23 00:00:00
end: 2023-11-05 05:20:00
period: 1d
basePeriod: 1h
exchanges: [{"eid":"Binance","currency":"BTC_USDT","stocks":0}]
*/

//@version=5
strategy(title='UT Bot v5', overlay=true, default_qty_type=strategy.percent_of_equity, default_qty_value=100)
//CREDITS to HPotter for the orginal code. The guy trying to sell this as his own is a scammer lol.
//Edited and converted to @version=5 by SeaSide420 for Paperina
// Inputs
AllowBuy = input(defval=true, title='Allow Buy?')
AllowSell = input(defval=false, title='Allow Sell?')
h = input(false, title='Signals from Heikin Ashi Candles')
//revclose = input(defval=true, title='Close when reverse signal?')
Price = input(defval=open, title='Price Source (recommended OPEN to avoid repainting)')
smoothing = input.string(title="Moving Average Type", defval="HMA", options=["SMA", "EMA", "WMA", "HMA"])
MA_Period = input(2, title='This changes the MAPeriod')
a = input.float(1, title='This changes the sensitivity',step=0.1)
c = input(11, title='ATR Period')
TakeProfit = input.int(defval=50000, title='Take Profit ($)', minval=1)
StopLoss = input.int(defval=50000, title='Stop Loss ($)', minval=1)
xATR = ta.atr(c)
nLoss = a * xATR
src = h ? request.security(ticker.heikinashi(syminfo.tickerid), timeframe.period, Price, lookahead=barmerge.lookahead_off) : Price
xATRTrailingStop = 0.0
iff_1 = src > nz(xATRTrailingStop[1], 0) ? src - nLoss : src + nLoss
iff_2 = src < nz(xATRTrailingStop[1], 0) and src[1] < nz(xATRTrailingStop[1], 0) ? math.min(nz(xATRTrailingStop[1]), src + nLoss) : iff_1
xATRTrailingStop := src > nz(xATRTrailingStop[1], 0) and src[1] > nz(xATRTrailingStop[1], 0) ? math.max(nz(xATRTrailingStop[1]), src - nLoss) : iff_2
pos = 0
iff_3 = src[1] > nz(xATRTrailingStop[1], 0) and src < nz(xATRTrailingStop[1], 0) ? -1 : nz(pos[1], 0)
pos := src[1] < nz(xATRTrailingStop[1], 0) and src > nz(xATRTrailingStop[1], 0) ? 1 : iff_3
xcolor = pos == -1 ? color.red : pos == 1 ? color.green : color.blue
ma_function(src, MA_Period) =>
    switch smoothing
        "SMA" => ta.sma(src, MA_Period)
        "EMA" => ta.ema(src, MA_Period)
        "WMA" => ta.wma(src, MA_Period)
        => ta.hma(src, MA_Period)
thema = ma_function(src, MA_Period)
above = ta.crossover(thema, xATRTrailingStop)
below = ta.crossover(xATRTrailingStop, thema)
buy = src > xATRTrailingStop and above
sell = src < xATRTrailingStop and below
barbuy = src > xATRTrailingStop
barsell = src < xATRTrailingStop
plot(thema,title="The M.A.",color=color.green,linewidth=2)
plot(xATRTrailingStop,title="The M.A.",color=color.red,linewidth=2)
plotshape(buy,  title = "Buy",  text = "Buy",  style = shape.labelup,   location = location.belowbar, color= color.green, textcolor = color.white, size = size.tiny)
plotshape(sell, title = "Sell", text = "Sell", style = shape.labeldown, location = location.abovebar, color= color.red,   textcolor = color.white, size = size.tiny)
barcolor(barbuy ? color.green : na)
barcolor(barsell ? color.red : na)
strategy.close_all(when=strategy.openprofit>TakeProfit,alert_message="Close- TakeProfit", comment = "TP")
strategy.close_all(when=strategy.openprofit<StopLoss-(StopLoss*2),alert_message="Close- StopLoss", comment = "SL")
strategy.close("buy", when =  sell and AllowSell==false , comment = "close buy")
strategy.close("sell", when =  buy and AllowBuy==false, comment = "close sell")
strategy.entry("buy", strategy.long, when = buy and AllowBuy)
strategy.entry("sell", strategy.short, when = sell and AllowSell)
Detail
https://www.fmz.com/strategy/433137
Last Modified
2023-11-24 16:59:25