
11 KiB
Name
动态均线回撤马丁策略Dynamic-Moving-Average-Retracement-Martin-Strategy
Author
ChaoZhang
Strategy Description
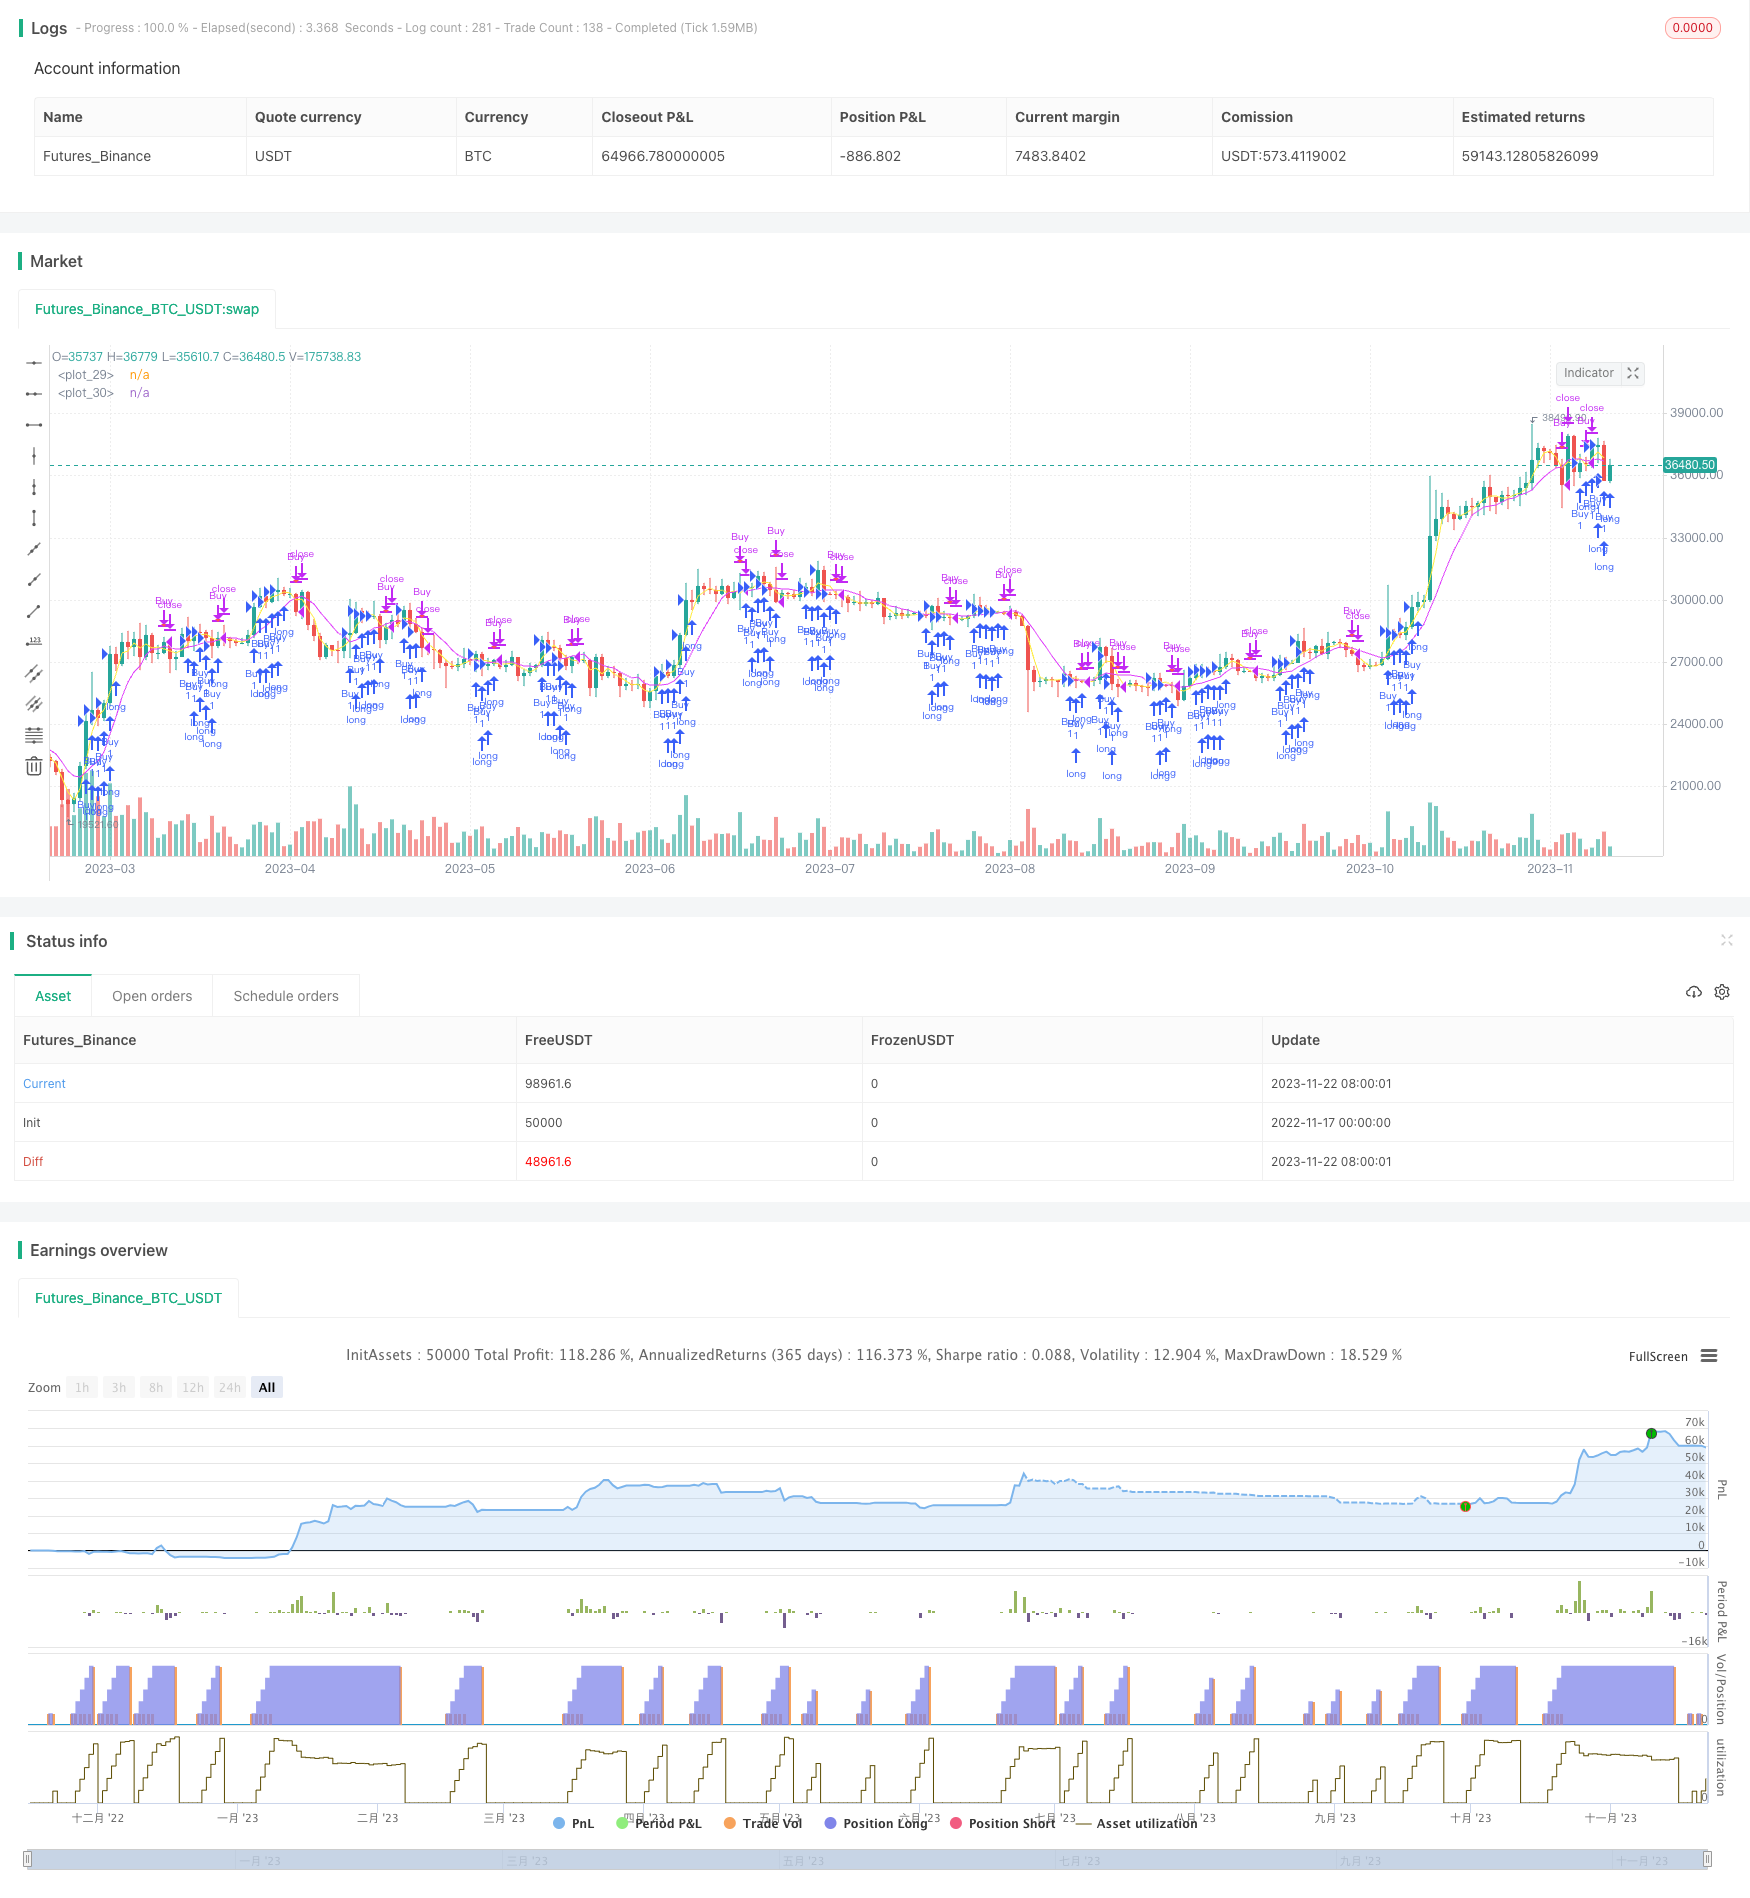 [trans]
概述
动态均线回撤马丁策略是一种频繁交易的策略,它结合了移动平均线交叉和底背离信号来产生入场和出场信号。该策略利用3日和8日简单移动平均线的交叉和背离来捕捉短期趋势,并采用止损和止盈来控制风险。此策略允许根据不同的市场条件选择交易方向。
策略原理
该策略使用3日和8日简单移动平均线及其交叉信号。当3日均线上穿8日均线时产生多头信号;当3日均线下穿8日均线时产生空头信号。多头信号会触发做多入场,空头信号会触发做空入场。
如果没有持仓,策略会根据交叉信号判断入场。入场后会根据最新收盘价、止损幅度和止盈幅度计算出止损价位和止盈价位。例如持多单时,止损价为最新收盘价减去止损幅度与8日均线乘积;止盈价为最新收盘价加上止盈幅度与8日均线乘积。
如果已有多头持仓,当价格触发止盈或止损后,如果出现8日均线的底背离信号,则会平仓。此时止损价位和止盈价位会被重置为0。空头持仓的处理逻辑类似。
该策略还在图表上绘制了入场点和出场点的形状。例如多头入场为向上三角,多头出场为向下三角。这有助于直观地判断入场与出场。
优势分析
该策略的优势有:
- 利用移动平均线交叉信号捕捉短期趋势,可以频繁交易。
- 停损机制可以控制单笔损失。
- 止盈设定可以锁定部分利润。
- 可选择只做多、只做空或双向交易,适应不同阶段。
- 在图表上可视化入场与出场点,操作清晰。
风险分析
该策略的主要风险有:
- 短期均线策略容易被套牢。
- 移动平均线生成延迟信号的可能性。
- 连续亏损可能导致损失加剧。
- 错误的止损幅度设置可能过于宽松或过于紧缩。
可以通过适当放宽止损幅度、优化移动平均线参数、引入附加过滤条件等方式来降低风险。此外,正确评估个人承受能力并规避过度交易也很重要。
优化方向
该策略可以从以下几个方面进行优化:
- 测试更多均线组合,寻找最佳参数。
- 增加其他指标过滤信号,如RSI,KD等,提高信号质量。
- 根据不同品种、周期调整止损幅度。
- 增加仓位控制,如固定数量或固定资金。
- 增加开仓顺序规则。
- 优化和评估止损或止盈水平。
总结
动态均线回撤马丁策略是一种短期交易策略。它通过捕捉移动平均线交叉形成的短期趋势,并采用适当的止损和止盈来管理风险。该策略频繁交易的特性使其既有盈利机会也存在Oneof therisks. 通过参数调优、信号过滤及风险控制等方式,可以进一步完善该策略,使其更稳定可靠。
||
Overview
The Dynamic Moving Average Retracement Martin strategy is a frequent trading strategy that combines moving average crossovers and pullback signals to generate entry and exit signals. The strategy uses the crossover and divergence of 3-day and 8-day simple moving averages to capture short-term trends, and adopts stops and take profits to control risks. This strategy allows choosing trading directions according to different market conditions.
Strategy Logic
The strategy uses 3-day and 8-day simple moving averages and their crossover signals. A long signal is generated when the 3-day MA crosses above the 8-day MA, and a short signal is generated when the 3-day MA crosses below the 8-day MA. Long signals will trigger long entry and short signals will trigger short entry.
If there is no position, the strategy will determine entry based on crossover signals. After entry, the stop loss price and take profit price will be calculated based on the latest close price, stop loss percentage and take profit percentage. For example, when holding a long position, the stop loss price is the latest close price minus the stop loss percentage multiplied by the 8-day MA; the take profit price is the latest close price plus the take profit percentage multiplied by the 8-day MA.
If there is an existing long position, when the price triggers the take profit or stop loss, if a pullback signal of the 8-day MA occurs, the position will be closed. At this time, the stop loss price and take profit price will be reset to 0. The logic for handling short positions is similar.
The strategy also plots entry and exit points on the chart. For example, a long entry is plotted as an upward triangle and a long exit as a downward triangle. This helps to visually judge entries and exits.
Advantage Analysis
The advantages of this strategy are:
- Captures short-term trends using moving average crossover signals, allowing frequent trading.
- The stop loss mechanism can control single loss.
- Take profit setting can lock in partial profits.
- Trading directions can be selected to suit different stages.
- Visualizes entry and exit points on chart for clarity.
Risk Analysis
The main risks of this strategy are:
- Short-term MA strategies tend to be whipsawed.
- Possibility of lagging signals from moving averages.
- Consecutive losses may lead to aggravated losses.
- Incorrectly set stop loss percentage may be too loose or too tight.
Risks can be reduced by reasonably widening stop loss percentage, optimizing MA parameters, introducing additional filter conditions, etc. Also, correctly assessing personal tolerance and avoiding overtrading is important.
Optimization Directions
This strategy can be optimized from the following aspects:
- Test more MA combinations to find optimal parameters.
- Add other indicators like RSI, KD etc. to improve signal quality.
- Adjust stop loss percentage according to different products and timeframes.
- Add position sizing control such as fixed quantity or fixed capital.
- Add entry order rules.
- Optimize and evaluate stop loss or take profit levels.
Summary
The Dynamic Moving Average Retracement Martin strategy is a short-term trading strategy. It captures short-term trends formed by moving average crossovers, and manages risks with proper stops and take profits. The frequent trading nature gives it profit opportunities as well as risks. By optimizing parameters, filtering signals and controlling risks, this strategy can be further improved for more reliability.
[/trans]
Strategy Arguments
| Argument | Default | Description |
|---|---|---|
| v_input_1 | 1.03 | Take Profit |
| v_input_2 | 0.95 | Stop Loss |
| v_input_string_1 | 0 | Trading Mode: Long |
Source (PineScript)
/*backtest
start: 2022-11-17 00:00:00
end: 2023-11-23 00:00:00
period: 1d
basePeriod: 1h
exchanges: [{"eid":"Futures_Binance","currency":"BTC_USDT"}]
*/

    // ____  __    ___   ________ ___________  ___________ __  ____ ___
   // / __ )/ /   /   | / ____/ //_/ ____/   |/_  __<  / // / / __ |__ \
  // / __  / /   / /| |/ /   / ,< / /   / /| | / /  / / // /_/ / / __/ /
 // / /_/ / /___/ ___ / /___/ /| / /___/ ___ |/ /  / /__  __/ /_/ / __/
// /_____/_____/_/  |_\____/_/ |_\____/_/  |_/_/  /_/  /_/  \____/____/

// This source code is subject to the terms of the Mozilla Public License 2.0 at https://mozilla.org/MPL/2.0/
// © blackcat1402
//@version=5
strategy('[blackcat] L1 MartinGale Scalping Strategy', overlay=true, pyramiding = 5)

// Define input variables
takeProfit = input(1.03, title='Take Profit')
stopLoss = input(0.95, title='Stop Loss')
inputTradingMode = input.string(defval='Long', options=['Long', 'Short', 'BiDir'], title='Trading Mode')

//The purpose of this rule is to forbid short entries, only long etries will be placed. The rule affects the following function: 'entry'.
strategy.risk.allow_entry_in(inputTradingMode == 'Long' ? strategy.direction.long : inputTradingMode == 'Short' ? strategy.direction.short : strategy.direction.all)

// Define strategy logic
entryPrice = 0.0
stopPrice = 0.0
takeProfitPrice = 0.0
stopLossPrice = 0.0

// Define SMA crossover and crossunder signals
sma3 = ta.sma(close, 3)
sma8 = ta.sma(close, 8)
plot(sma3, color=color.yellow)
plot(sma8, color=color.fuchsia)
crossoverSignal = ta.crossover(sma3, sma8)
crossunderSignal = ta.crossunder(sma3, sma8)
crossoverState = sma3 > sma8
crossunderState = sma3 < sma8

if strategy.position_size == 0
    if crossoverState
        strategy.entry('Buy', strategy.long)
        entryPrice := close
        stopPrice := close - stopLoss * sma8[1]
        takeProfitPrice := close + takeProfit * sma8[1]
        stopLossPrice := stopPrice
        stopLossPrice
    if crossunderState
        strategy.entry('Sell', strategy.short)
        entryPrice := close
        stopPrice := close + stopLoss *  sma8[1]
        takeProfitPrice := close - takeProfit *  sma8[1]
        stopLossPrice := stopPrice
        stopLossPrice

if strategy.position_size > 0
    if (close > takeProfitPrice or close < stopLossPrice) and crossunderState
        strategy.close('Buy')
        entryPrice := 0.0
        stopPrice := 0.0
        takeProfitPrice := 0.0
        stopLossPrice := 0.0
        stopLossPrice
    else
        strategy.entry('Buy', strategy.long)
        entryPrice := close
        stopPrice := close - stopLoss *  sma8[1]
        takeProfitPrice := close + takeProfit *  sma8[1]
        stopLossPrice := stopPrice
        stopLossPrice

if strategy.position_size < 0
    if (close > takeProfitPrice or close < stopLossPrice) and crossoverState
        strategy.close('Sell')
        entryPrice := 0.0
        stopPrice := 0.0
        takeProfitPrice := 0.0
        stopLossPrice := 0.0
        stopLossPrice
    else
        strategy.entry('Sell', strategy.short)
        entryPrice := close
        stopPrice := close + stopLoss *  sma8[1]
        takeProfitPrice := close - takeProfit *  sma8[1]
        stopLossPrice := stopPrice
        stopLossPrice

// Plot entry and exit points
plotshape(strategy.position_size > 0 and crossoverSignal, 'Buy Entry', shape.triangleup, location.belowbar, color.new(color.green, 0), size=size.small)
plotshape(strategy.position_size > 0 and (close >= takeProfitPrice or close <= stopLossPrice), 'Buy Exit', shape.triangledown, location.abovebar, color.new(color.red, 0), size=size.small)
plotshape(strategy.position_size < 0 and crossunderSignal, 'Sell Entry', shape.triangledown, location.abovebar, color.new(color.red, 0), size=size.small)
plotshape(strategy.position_size < 0 and (close >= takeProfitPrice or close <= stopLossPrice), 'Sell Exit', shape.triangleup, location.belowbar, color.new(color.green, 0), size=size.small)
Detail
https://www.fmz.com/strategy/433071
Last Modified
2023-11-24 10:19:21