
7.3 KiB
Name
低波动定向买入止盈止损策略Low-Volatility-Directional-Buy-with-Profit-Taking-and-Stop-Loss
Author
ChaoZhang
Strategy Description
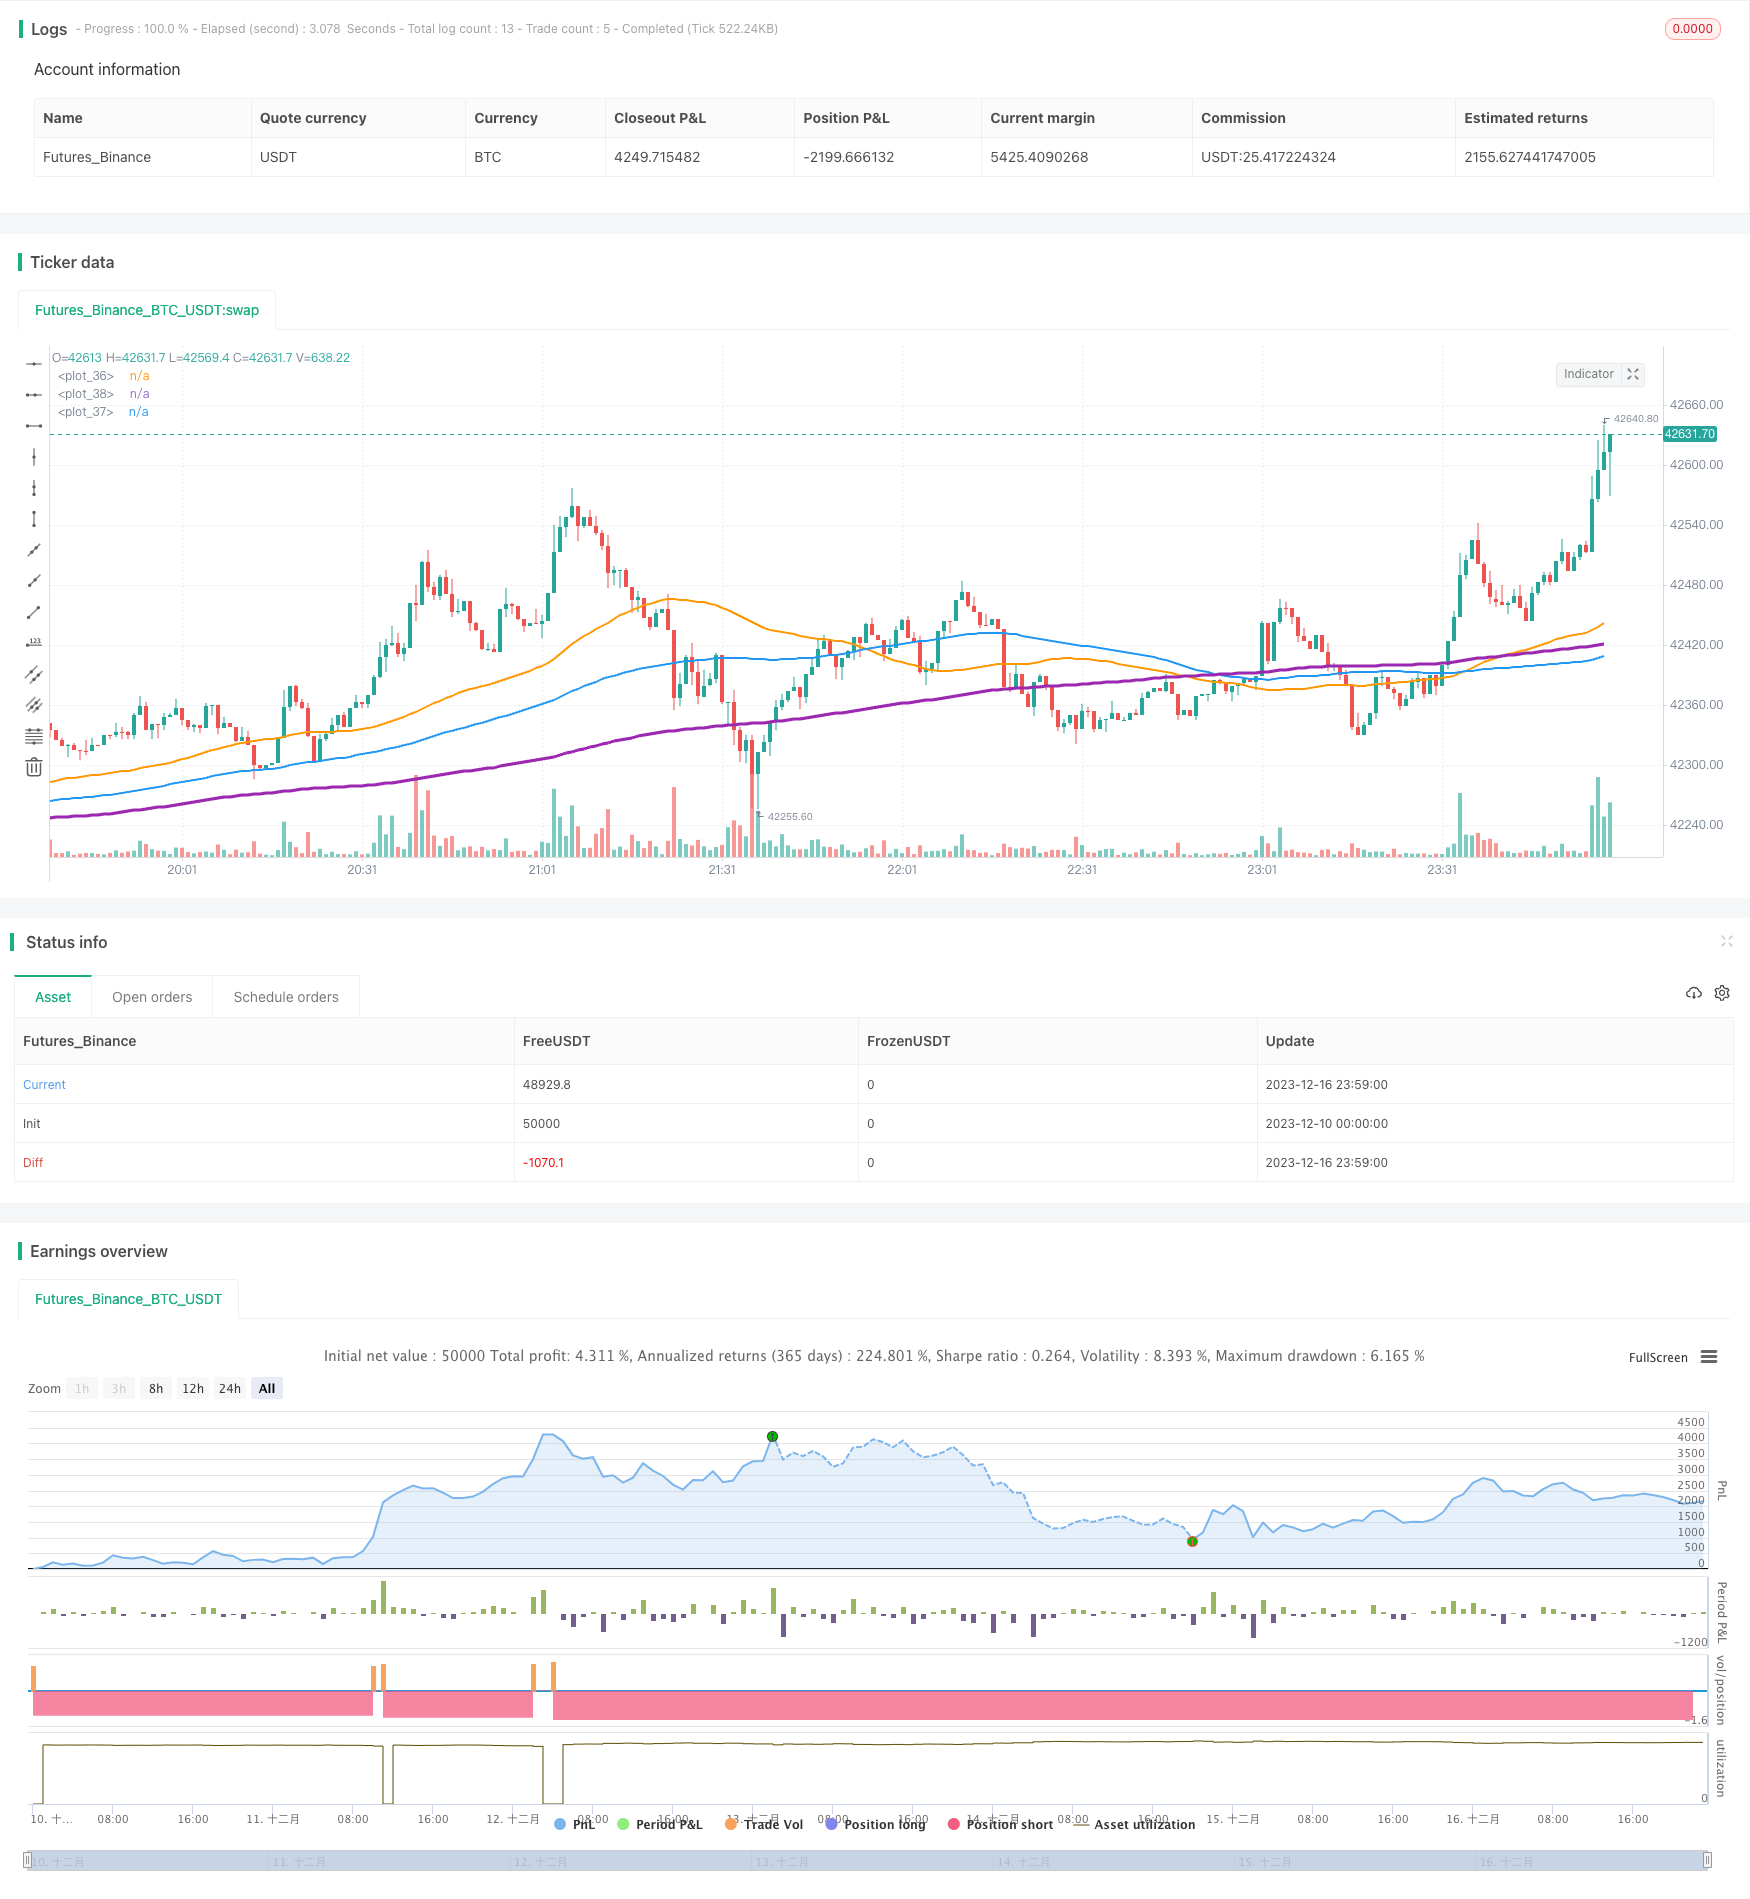 [trans]
概述
本策略名为“低波动定向买入止盈止损策略”。它利用移动平均线的交叉作为买入信号,结合止盈止损来锁定盈利,适用于低波动区间的币种。
策略原理
该策略使用3条不同周期的移动平均线:50周期、100周期和200周期。其买入逻辑是:当50周期线上穿100周期线,并且100周期线上穿200周期线时,做多入场。
该信号表示市场正在从低波动区间突破,开始进入趋势状态。50周期快速上涨代表短期内部力量突然增强,开始带动中长线向上;100周期线也开始向上表示中期力量加入,稳定趋势上行。
入场后,策略采用止盈止损方式锁定利润。止盈目标为入场价的8%,止损线为入场价的4%。设置止盈大于止损,有利于获利超过亏损,确保策略整体盈利性。
优势分析
该策略具有以下优势:
- 能准确抓住低波动区间突破带来的趋势机会。
- 移动平均线容易计算和回测,逻辑简单清晰。
- 止盈止损设置合理,有利于获得稳定收益。
- 可配置参数灵活,容易优化。
风险分析
该策略也存在一些风险:
- 错误的突破信号可能导致亏损。
- 市场反转时难以止损。
- 止盈止损参数设置不当会影响盈利。
对策:
- 结合其他指标过滤信号,确保突破有效性。
- 适当缩短止损周期,减少反转造成的损失。
- 测试不同止盈止损比例,寻找最优参数。
优化方向
该策略可从以下方面进行优化:
1.测试不同移动平均线周期参数,找到最佳组合。 2.加入成交量等指标来确认趋势突破。 3.动态调整止盈止损幅度。 4.结合机器学习等手段来预测突破成功率。 5.针对不同市场条件和币种进行参数调整。
综上所述,该策略整体运行逻辑清晰,通过配置移动平均线周期及止盈止损幅度来获得低风险收益,可灵活应用于量化交易。后续可从入场信号、止损方式等方面进行优化,配合参数调整寻找最佳效果。
||
Overview
The strategy is named "Low Volatility Directional Buy with Profit Taking and Stop Loss". It utilizes moving average crossover as buy signals and combines profit taking and stop loss to lock in profit. It is suitable for low volatility coins.
Strategy Logic
The strategy uses 3 moving averages with different periods: 50-period, 100-period and 200-period. The buy logic is: when 50-period MA crosses over 100-period MA and 100-period MA crosses over 200-period MA, go long.
This signals a breakout from low volatility range and the start of a trend. 50-period MA's fast rise represents strengthening of short term momentum; 100-period MA also turning up indicates mid term force joining in to stabilize the up trend.
After entry, the strategy uses profit taking and stop loss to lock in gains. Take profit is set at 8% of entry price. Stop loss is set at 4% of entry price. With higher take profit over stop loss, it ensures the strategy stays profitable overall.
Advantage Analysis
The advantages of this strategy:
- Accurately capture trend opportunity from low volatility breakouts.
- Simple and clear logic with moving averages that are easy to calculate and backtest.
- Reasonable profit taking and stop loss settings ensure stable gains.
- Flexible configurable parameters make optimizations easy.
Risk Analysis
There are also some risks:
- Wrong breakout signals may cause losses.
- Hard to stop loss when markets reverse.
- Improper profit taking and stop loss parameter settings affect profitability.
Solutions:
- Add other indicators to filter signals and ensure breakout validity.
- Shorten stop loss period to reduce losses from reversals.
- Test different profit taking and stop loss ratios to find optimum.
Optimization Directions
Optimizations can be made in below areas:
- Test different moving average periods to find best combination.
- Add volume etc. to confirm trend breakouts.
- Dynamically adjust profit taking and stop loss percentage.
- Incorporate machine learning etc. to predict breakout success rate.
- Adjust parameters based on different market conditions and coins.
In summary, the strategy has clear logic overall, obtains low risk profit through configuring moving average periods and profit taking/stop loss percentage. It can be flexibly applied in quantitative trading. Further optimizations can be made in areas like entry signals and stop loss methods, combined with parameter tuning to achieve best results.
[/trans]
Strategy Arguments
| Argument | Default | Description |
|---|---|---|
| v_input_1 | true | From Month |
| v_input_2 | 10 | From Day |
| v_input_3 | 2019 | From Year |
| v_input_4 | true | Thru Month |
| v_input_5 | true | Thru Day |
| v_input_6 | 2112 | Thru Year |
| v_input_7 | true | Show Date Range |
| v_input_8 | 50 | v_input_8 |
| v_input_9 | 200 | v_input_9 |
| v_input_10 | 100 | v_input_10 |
Source (PineScript)
/*backtest
start: 2023-12-10 00:00:00
end: 2023-12-17 00:00:00
period: 1m
basePeriod: 1m
exchanges: [{"eid":"Futures_Binance","currency":"BTC_USDT"}]
*/

//@version=4
strategy(shorttitle='Low volatility Buy w/ TP & SL (by Coinrule)',title='Low volatility Buy w/ TP & SL', overlay=true, initial_capital = 1000, process_orders_on_close=true, default_qty_type = strategy.percent_of_equity, default_qty_value = 100)

//Backtest dates
fromMonth = input(defval = 1,    title = "From Month",      type = input.integer, minval = 1, maxval = 12)
fromDay   = input(defval = 10,    title = "From Day",        type = input.integer, minval = 1, maxval = 31)
fromYear  = input(defval = 2019, title = "From Year",       type = input.integer, minval = 1970)
thruMonth = input(defval = 1,    title = "Thru Month",      type = input.integer, minval = 1, maxval = 12)
thruDay   = input(defval = 1,    title = "Thru Day",        type = input.integer, minval = 1, maxval = 31)
thruYear  = input(defval = 2112, title = "Thru Year",       type = input.integer, minval = 1970)

showDate  = input(defval = true, title = "Show Date Range", type = input.bool)

start     = timestamp(fromYear, fromMonth, fromDay, 00, 00)        // backtest start window
finish    = timestamp(thruYear, thruMonth, thruDay, 23, 59)        // backtest finish window
window()  => time >= start and time <= finish ? true : false       // create function "within window of time"

//MA inputs and calculations
movingaverage_fast = sma(close, input(50))
movingaverage_slow = sma(close, input(200))
movingaverage_normal= sma(close, input(100))


//Entry
strategy.entry(id="long", long = true, when = movingaverage_slow > movingaverage_normal and movingaverage_fast > movingaverage_normal)

//Exit
longStopPrice  = strategy.position_avg_price * (1 - 0.04)
longTakeProfit = strategy.position_avg_price * (1 + 0.08)

strategy.close("long", when = close < longStopPrice or close > longTakeProfit and window())

//PLOT

plot(movingaverage_fast, color=color.orange, linewidth=2)
plot(movingaverage_slow, color=color.purple, linewidth=3)
plot(movingaverage_normal, color=color.blue, linewidth=2)
Detail
https://www.fmz.com/strategy/435715
Last Modified
2023-12-18 12:00:07