
12 KiB
Name
交叉均线金叉死叉策略Cross-Moving-Average-Golden-Cross-Death-Cross-Strategy
Author
ChaoZhang
Strategy Description
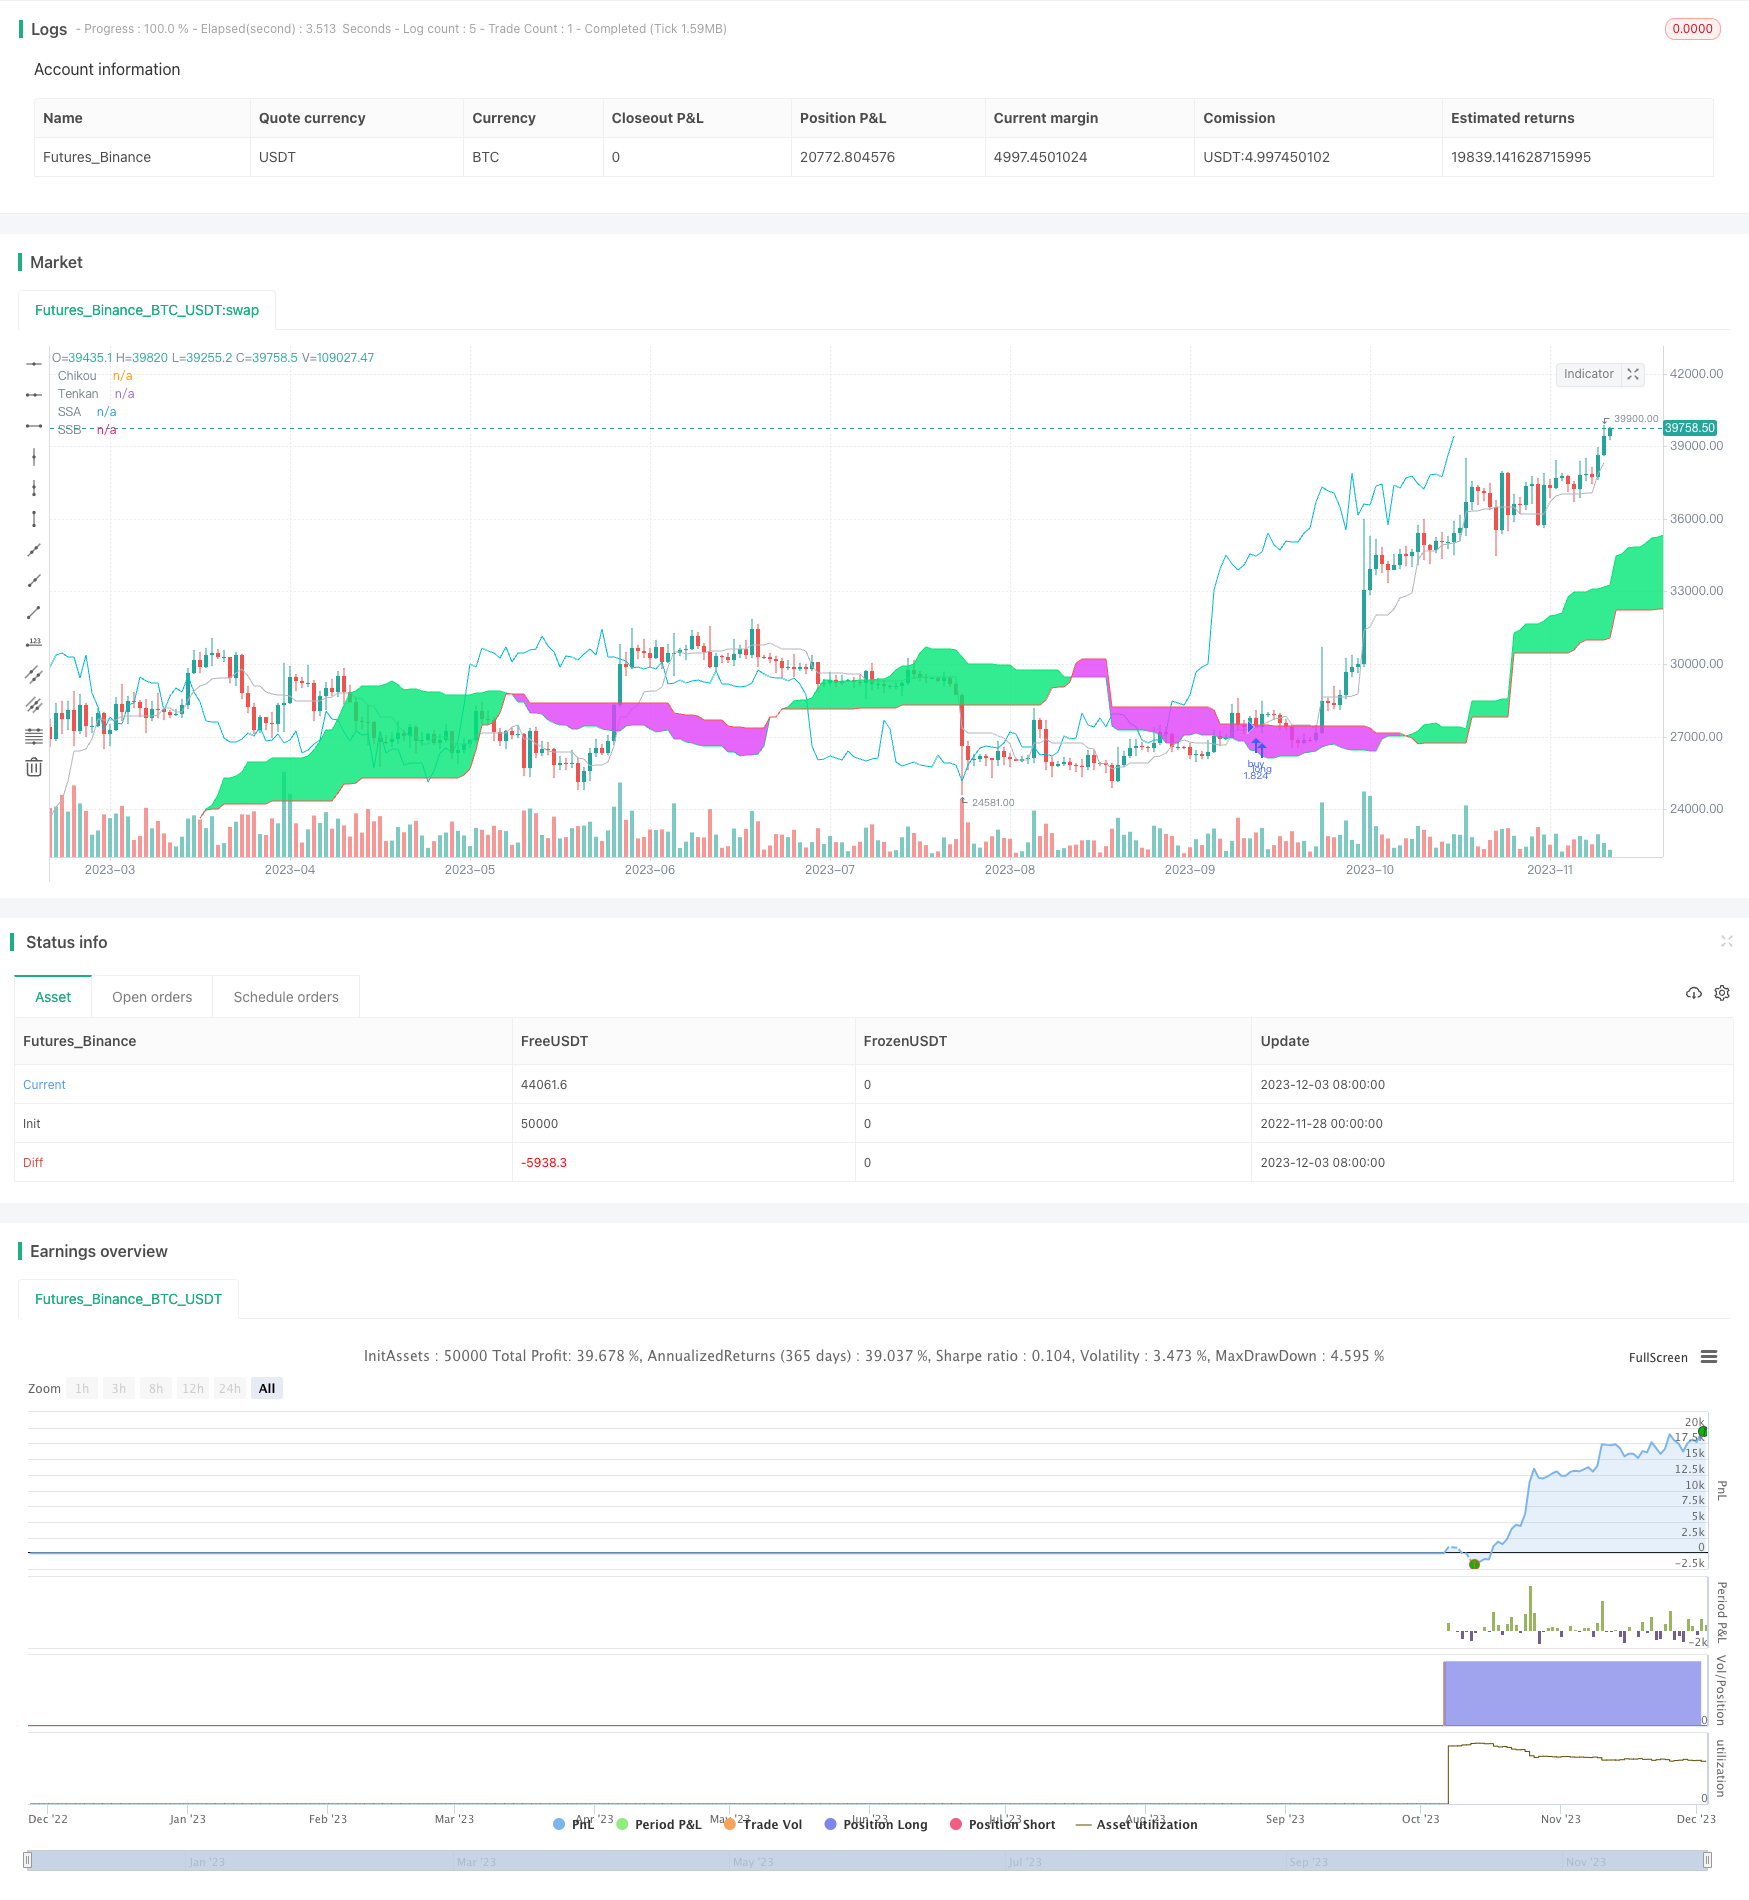
[trans] 这是一个非常经典的移动平均线金叉死叉策略。该策略借助TENKAN和KIJUN两条不同周期的移动平均线,形成金叉和死叉信号,进行长短操作。
策略原理
该策略主要基于一种叫“一目均衡表”的日本股票技术分析方法,用TENKAN线和KIJUN线等多条移动平均线来判断市场趋势方向。
首先,TENKAN线是9日线,代表短期趋势;KIJUN线是26日线,代表中期趋势。当短期上穿中期时,产生买入信号;当短期下穿中期时,产生卖出信号。这样,就构成了经典的移动平均线金叉死叉策略。
然后,该策略还引入空中线和光云线。空中线是短期和中期移动平均线的平均数,光云线B是52日移动平均线。它们构成“云带”,判断长期趋势方向。价格在光云上的空间就是多头市场,价格在光云下的空间就是空头市场。
最后,为过滤假信号,该策略还检测价格是否与OTO线(26日价格的延迟线)的关系——只有当价格在OTO线之下才产生买入信号;只有当价格在OTO线之上才产生卖出信号。
策略优势
这是一个非常典型的移动平均线策略,优势主要体现在三个方面:
-
使用两条不同周期的均线,可以有效判断短期和中期两个时间维度的趋势方向。
-
借助光云线判断长期趋势,避免在长期看跌市场中仍看多。
-
检测价格与延迟价格的关系,可以过滤掉很多假信号,减少不必要的交易。
所以,该策略综合利用均线的多种功能,可以顺势而为,及时抓住短中长三个时间维度的趋势机会。
策略风险
该策略的主要风险在于:
-
均线策略容易产生大量假信号。如果不能很好地设定参数,则会因为频繁交易而被套牢。
-
该策略偏重技术面,没有考虑基本面因素。如果公司业绩或市场政策发生重大变化,技术信号也可能会失效。
-
该策略只考虑了买入卖出的决策,没有设置止损机制。一旦判断错误,亏损可能会加大。
所以,我们需要寻找更先进的均线系统,或合理设定止损,或加入基本面信号,来进一步完善该策略,降低风险。
策略优化方向
该策略还可以从以下几个方面进行优化:
-
寻找更稳定和高效的参数组合。我们可以通过更多的数据回测,找到让策略绩效更优异的参数值。
-
增加止损机制。合理的止损可以有效控制策略的最大损失。
-
加入基本面信号。例如业绩预期revision的数据可以判断公司前景,从而提高策略效果。
-
优化OTO线策略。现有的实现很简单,我们可以寻找更稳定和精确判断价格与历史价格关系的方法。
-
结合选股信号。加入像PE,ROE等因子的评分,可以过滤掉一些质量比较差的标的。
总结
这是一个非常典型和实用的移动平均线策略。它同时关注了短、中、长三个时间维度的趋势,运用均线的不同功能来设计交易信号,效果不错。我们可以在此基础上,通过参数优化、止损、选股等方法进行改进,使其绩效更出色。总的来说,这是一个值得重点研究和长期跟踪的量化策略。
||
This is a very classic moving average golden cross death cross strategy. The strategy utilizes two moving averages, TENKAN and KIJUN, with different time periods to form golden cross and death cross signals for long and short trades.
Strategy Logic
The strategy is mainly based on a Japanese stock technical analysis method called Ichimoku Kinko Hyo, using multiple moving averages like the TENKAN and KIJUN lines to determine the market trend direction.
Firstly, the TENKAN line is a 9-day line representing the short-term trend; the KIJUN line is a 26-day line representing the medium-term trend. When the TENKAN line crosses above the KIJUN line, a buy signal is generated. When the TENKAN line falls below the KIJUN line, a sell signal is generated. This forms the classic moving average golden cross and death cross strategy.
Secondly, the strategy also introduces the Senkou Span A (SSA) line and the Senkou Span B (SSB) line. The SSA line is the average of TENKAN and KIJUN lines while the SSB line is a 52-day moving average. Together they form the "Kumo" (cloud) bands that determine the long-term trend direction - price above the cloud signifies an uptrend while price below the cloud signifies a downtrend.
Lastly, to filter fake signals, this strategy also examines the position of price compared to the Chikou Span (the closing price delayed by 26 days) – only generating buy signals when the price is below Chikou and sell signals when the price is above Chikou.
Benefits
This is a very typical moving average strategy. The main advantages lie in:
-
Using two moving averages of different periods effectively judges short-term and medium-term trend directions simultaneously.
-
Long-term trends are determined with the Kumo bands to avoid buying in long-term bear markets.
-
Comparing prices with the delayed Chikou line filters out a lot of fake signals and reduces unnecessary trades.
By skillfully utilizing various functions of moving averages, this strategy can follow trends across short, medium and long timeframes.
Risks
The main risks of this strategy include:
-
Moving average strategies tend to produce many fake signals. Frequent trading caused by inaccurate parameters may lead to losses.
-
This strategy focuses heavily on technicals without considering fundamentals. Major changes in business performance or market policies may invalidate the technical signals.
-
No stop loss mechanism is included. Once the market direction judgment is wrong, losses can accumulate.
Therefore, we need more advanced moving average systems, proper stop loss rules, or supplemental fundamental signals, to further refine this strategy and decrease risks.
Enhancement Opportunities
This strategy can also be improved in the following aspects:
-
Search for more stable and efficient parameter sets through more backtests.
-
Add stop loss rules. Reasonable stop loss helps effectively control maximum losses.
-
Supplement fundamental signals like earnings estimate revisions which contain insights on a company's outlook.
-
Optimize the Chikou line price comparison strategy with more stable solutions.
-
Incorporate stock selection signals. Scoring factors like PE ratio and ROE can filter lower quality stocks.
Conclusion
This is a very typical and practical moving average strategy. By simultaneously monitoring short, medium and long-term trends, utilizing various functions of moving averages, it generates trade signals with solid performance. We can further improve it by parameter tuning, adding stop loss, stock selection etc. Overall this is a promising quantitative strategy worthy of research and tracking.
[/trans]
Strategy Arguments
| Argument | Default | Description |
|---|---|---|
| v_input_1 | 9 | Tenkan-Sen Length |
| v_input_2 | 26 | Kijun-Sen Length |
| v_input_3 | 52 | Senkou Span B Length |
| v_input_4 | 26 | Offset For Chikou Span / Kumo |
| v_input_5 | 5 | Orders Cooldown Period |
| v_input_6 | false | Use Imperfect Chikou Position Detection |
Source (PineScript)
/*backtest
start: 2022-11-28 00:00:00
end: 2023-12-04 00:00:00
period: 1d
basePeriod: 1h
exchanges: [{"eid":"Futures_Binance","currency":"BTC_USDT"}]
*/

// This source code is subject to the terms of the Mozilla Public License 2.0 at https://mozilla.org/MPL/2.0/
// © mdeous

//@version=4
strategy(
     title="Ichimoku Kinko Hyo Strategy",
     shorttitle="Ichimoku Strategy",
     overlay=true,
     pyramiding=0,
     default_qty_type=strategy.percent_of_equity,
     default_qty_value=100,
     initial_capital=1000,
     currency="USD",
     commission_type=strategy.commission.percent,
     commission_value=0.0
     )

//
// SETTINGS
//

// Ichimoku

int TENKAN_LEN = input(title="Tenkan-Sen Length", defval=9, minval=1, step=1)
int KIJUN_LEN = input(title="Kijun-Sen Length", defval=26, minval=1, step=1)
int SSB_LEN = input(title="Senkou Span B Length", defval=52, minval=1, step=1)
int OFFSET = input(title="Offset For Chikou Span / Kumo", defval=26, minval=1, step=1)

// Strategy

int COOLDOWN = input(title="Orders Cooldown Period", defval=5, minval=0, step=1)
bool USE_CHIKOU = input(title="Use Imperfect Chikou Position Detection", defval=false)

//
// HELPERS
//

color _red = color.red
color _blue = color.blue
color _lime = color.lime
color _fuchsia = color.fuchsia
color _silver = color.silver
color _aqua = color.aqua

f_donchian(_len) => avg(lowest(_len), highest(_len))

//
// ICHIMOKU INDICATOR
//

float tenkan = f_donchian(TENKAN_LEN)
float kijun = f_donchian(KIJUN_LEN)
float ssa = avg(tenkan, kijun)
float ssb = f_donchian(SSB_LEN)

plot(tenkan, title="Tenkan", color=_silver)
plot(close, title="Chikou", offset=-OFFSET+1, color=_aqua)
_ssa = plot(ssa, title="SSA", offset=OFFSET-1, color=_lime)
_ssb = plot(ssb, title="SSB", offset=OFFSET-1, color=_red)
fill(_ssa, _ssb, color=ssa > ssb ? _lime : _fuchsia, transp=90)

//
// STRATEGY
//

// Check if price is "above or below" Chikou (i.e. historic price line):
// This detection is highly imperfect, as it can only know what Chikou position
// was 2*offset candles in the past, therefore if Chikou crossed the price
// line in the last 2*offset periods it won't be detected.
// Use of this detection is disabled by default,

float _chikou_val = close[OFFSET*2+1]
float _last_val = close[OFFSET+1]
bool above_chikou = USE_CHIKOU ? _last_val > _chikou_val : true
bool below_chikou = USE_CHIKOU ? _last_val < _chikou_val : true

// Identify short-term trend with Tenkan

bool _above_tenkan = min(open, close) > tenkan
bool _below_tenkan = max(open, close) < tenkan

// Check price position compared to Kumo

bool _above_kumo = min(open, close) > ssa
bool _below_kumo = max(open, close) < ssb

// Check if Kumo is bullish or bearish

bool bullish_kumo = ssa > ssb
bool bearish_kumo = ssa < ssb

// Correlate indicators to confirm the trend

bool bullish_trend = _above_tenkan and _above_kumo and bullish_kumo
bool bearish_trend = _below_tenkan and _below_kumo and bearish_kumo

// Build signals

bool buy1 = (close > open) and ((close > ssa) and (open < ssa)) // green candle crossing over SSA
bool buy2 = bullish_kumo and bearish_kumo[1] // bullish Kumo twist

bool sell1 = (close < open) and ((close < ssb) and (open > ssb)) // red candle crossing under SSB
bool sell2 = bearish_kumo and bullish_kumo[1] // bearish Kumo twist

bool go_long = below_chikou and (bullish_trend and (buy1 or buy2))
bool exit_long = above_chikou and (bearish_trend and (sell1 or sell2))

//
// COOLDOWN
//

f_cooldown() =>
    _cd_needed = false
    for i = 1 to COOLDOWN by 1
        if go_long[i]
            _cd_needed := true
            break
    _cd_needed

go_long := f_cooldown() ? false : go_long

//
// ORDERS
//

strategy.entry("buy", strategy.long, when=go_long)
strategy.close_all(when=exit_long)

//
// ALERTS
//

alertcondition(
     condition=go_long,
     title="Buy Signal",
     message="{{exchange}}:{{ticker}}: A buy signal for {{strategy.market_position_size}} units has been detected (last close: {{close}})."
     )
alertcondition(
     condition=exit_long,
     title="Sell Signal",
     message="{{exchange}}:{{ticker}}: A sell signal for {{strategy.market_position_size}} units has been detected (last close: {{close}})."
     )
Detail
https://www.fmz.com/strategy/434299
Last Modified
2023-12-05 11:11:02