
10 KiB
Name
两阶段止损策略Two-stage-Stop-Loss-Strategy
Author
ChaoZhang
Strategy Description
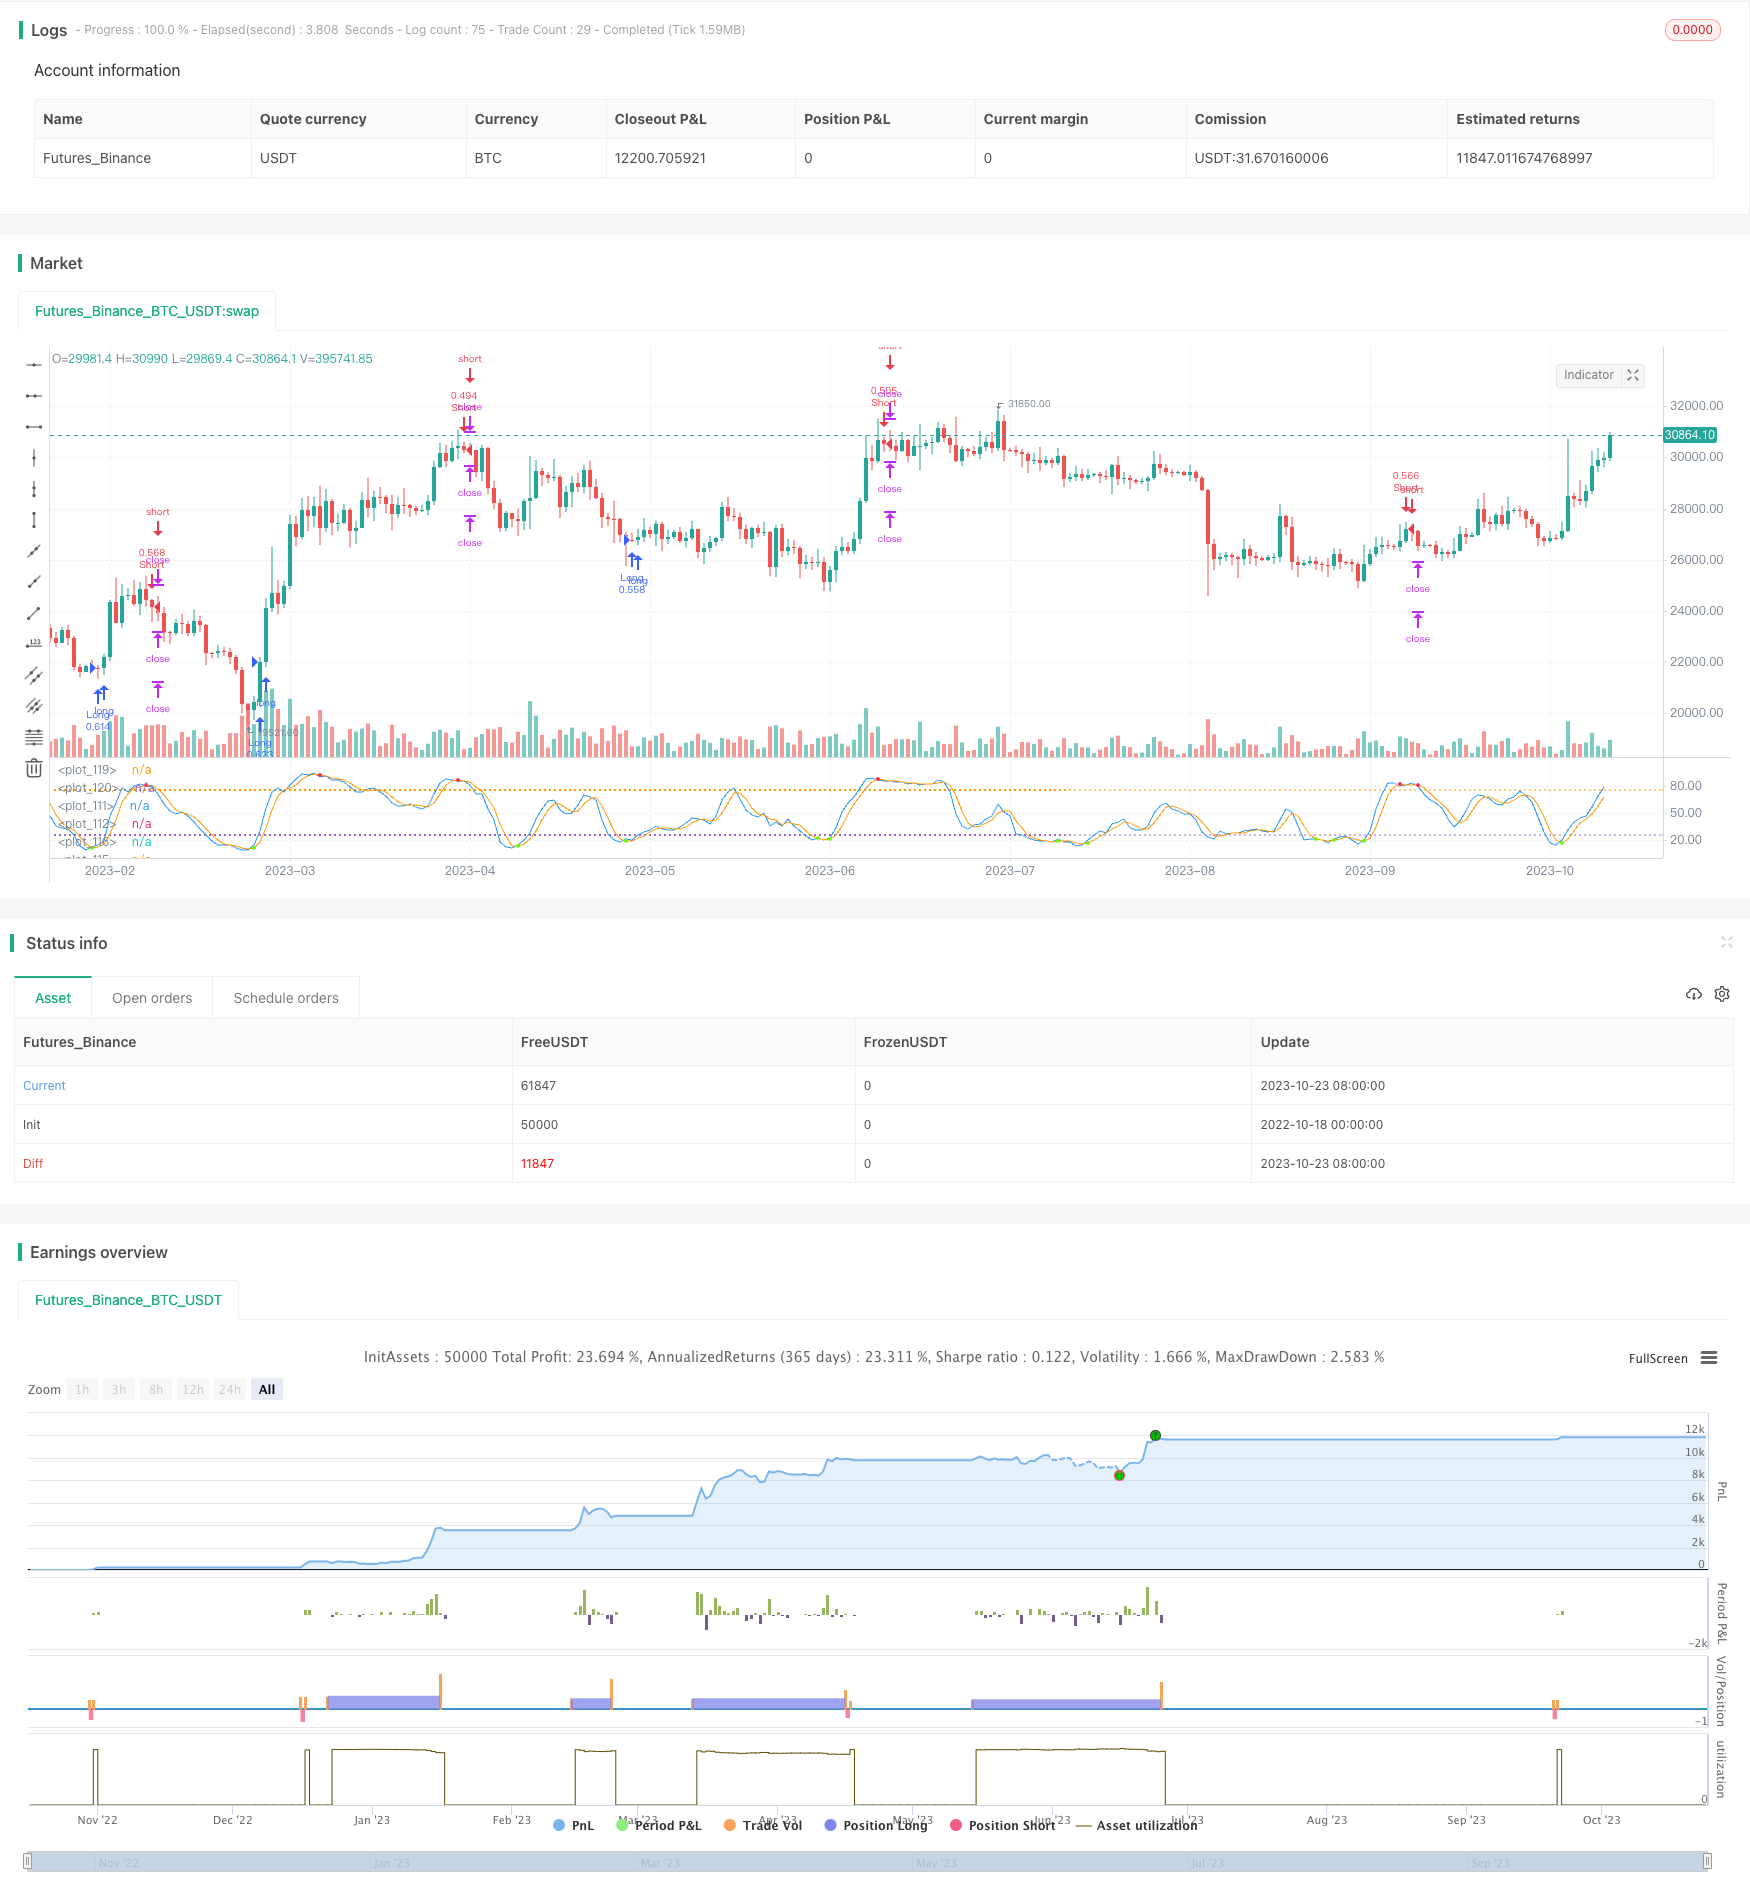
[trans]
概述
该策略的主要思想是设置两个止盈点,当第一个止盈点被触发时,将止损点移至入场价格,防止止损被刮边。
策略原理
本策略基于布林带指标和Stochastic指标入场。当价格超出布林带上轨时做空,当Stochastic指标显示超卖时做多。
具体来说,策略的入场逻辑是:
-
当收盘价低于布林带下轨,且Stochastic K线下穿D线时做多入场
-
当收盘价高于布林带上轨,且Stochastic K线上穿D线时做空入场
该策略设置两个止盈点,第一个止盈点固定为200点,第二个止盈点固定为500点。
当价格移动过程中第一个止盈点被触发时,本策略会将止损点移至入场价格。这样可以锁定第一阶段的利润,同时防止止损被价格波动刮边。
当第二个止盈点被触发或者止损点被触发时,本策略会全部平仓。
策略优势
这种两阶段止损策略最大的优势在于可以实现盈利的锁定,同时防止止损被价格波动刮边。通过移动止损点到入场价格,可以减小止损被刮边的概率,保护利润。
另一个优势是该策略采用了布林带指标判断价格波动范围和Stochastic指标判断超买超卖的组合策略,这两个指标互为补充,可以提高入场的准确率。
策略风险
该策略主要的风险在于布林带指标和Stochastic指标都可能产生错误信号。如果布林带范围计算错误,将导致错失入场时机或者产生错误信号。如果Stochastic指标产生假突破,也会导致错误入场。
此外,移动止损点到入场价格也存在被再次刮边的风险。如果行情出现V型反转,止损点有可能会被第二次触发。
为降低这些风险,可以调整布林带参数,优化Stochastic指标参数组合,并适当提高止损点间距。
策略优化方向
这种两阶段止损策略还可以进一步优化:
-
可以测试不同的参数组合,优化布林带参数和Stochastic参数,找到最优参数组合。
-
可以测试不同的止盈止损点设置,优化止盈止损点的大小,找到最优配置。
-
可以加入其它指标,例如移动平均线等,形成多指标组合策略,提高入场准确率。
-
可以研究不同的止损点移动逻辑,例如移动到一定间距之外,而不是入场价格。
-
可以增加止损点移动次数,设置三个或更多阶段的止损移动。
总结
本策略采用布林带指标和Stochastic指标判断入场时机,设置两个止盈点,在第一个止盈点达到后移动止损点到入场价格,形成两阶段止损策略。这种策略可以有效锁定利润并防止止损被刮边。策略优势突出,但也存在一定改进空间,通过参数优化、多指标组合、止损点逻辑调整等方式可以进一步完善该策略。
||
Overview
The main idea of this strategy is to set two take profit targets and move the stop loss to entry price after the first target is reached to avoid stop loss hunting.
Strategy Logic
This strategy enters trades based on Bollinger Bands and Stochastic indicators. It goes short when price exceeds the Bollinger upper band and goes long when Stochastic shows oversold.
Specifically, the entry logic is:
-
Enter long when close is below Bollinger lower band and Stochastic K crosses below D.
-
Enter short when close is above Bollinger upper band and Stochastic K crosses above D.
The strategy sets two take profit targets, TP1 fixed at 200 points and TP2 fixed at 500 points.
When price moves and TP1 is triggered, the strategy will move stop loss to entry price. This locks in profit from first stage and prevents stop loss hunting.
The strategy closes all positions when TP2 or stop loss is triggered.
Advantage Analysis
The biggest advantage of this two-stage stop loss approach is it allows locking in profits while preventing stop loss hunting. By moving stop loss to entry price, it reduces the chance of stop loss hunting and protects profits.
Another advantage is the combination of Bollinger Bands to gauge volatility range and Stochastic for overbought/oversold makes for more accurate entries.
Risk Analysis
Main risks stem from potential false signals from Bollinger Bands and Stochastic indicators. Incorrect Bollinger range can lead to missing entries or bad signals. Stochastic false breakouts also cause wrong entries.
There is also risk of stop loss being hunted again after moving to entry price. V-shaped reversals can trigger stop loss a second time.
These risks can be reduced by optimizing parameters for both indicators and increasing distance between stop losses.
Optimization Directions
Further optimizations for this strategy:
-
Test different parameter combinations to find optimal Bollinger and Stochastic parameters.
-
Test different profit/loss targets to find ideal configurations.
-
Add other indicators like moving averages to create multi-indicator systems for higher accuracy.
-
Research alternate stop loss positioning logic, like fixed distance from entry instead of entry price itself.
-
Increase stop loss movement occurrences to 3 or more stages.
Conclusion
This strategy uses Bollinger Bands and Stochastic for entries, sets two take profit targets, and moves stop loss to entry after first target reached to form a two-stage stop loss. This effectively locks in profits and prevents stop loss hunting. Strategy has clear advantages but also room for improvements via parameter optimization, multi-indicator systems, and stop loss logic adjustments. [/trans]
Strategy Arguments
| Argument | Default | Description |
|---|---|---|
| v_input_float_1 | 200 | Take Profit 1 |
| v_input_float_2 | 500 | Take Profit 2 |
| v_input_float_3 | 200 | Stop Loss |
| v_input_bool_1 | true | Use Stochastic overbought/oversold threshold |
Source (PineScript)
/*backtest
start: 2022-10-18 00:00:00
end: 2023-10-24 00:00:00
period: 1d
basePeriod: 1h
exchanges: [{"eid":"Futures_Binance","currency":"BTC_USDT"}]
*/

// This source code is subject to the terms of the Mozilla Public License 2.0 at https://mozilla.org/MPL/2.0/
// © fpsd4ve

//@version=5

// Add Bollinger Bands indicator (close, 20, 2) manually to visualise trading conditions
strategy("2xTP, SL to entry",
     overlay=false,
     pyramiding=0,
     calc_on_every_tick=false,
     default_qty_type=strategy.percent_of_equity,
     default_qty_value=25,
     initial_capital=1000,
     commission_type=strategy.commission.percent,
     commission_value=0.01
     )

// PARAMETERS
// Assumes quote currency is FIAT as with BTC/USDT pair
tp1=input.float(200, title="Take Profit 1")
tp2=input.float(500, title="Take Profit 2")
sl=input.float(200, title="Stop Loss")
stOBOS = input.bool(true, title="Use Stochastic overbought/oversold threshold")

// Colors
colorRed = #FF2052
colorGreen = #66FF00


// FUNCTIONS
// Stochastic
f_stochastic() =>
    stoch = ta.stoch(close, high, low, 14)
    stoch_K = ta.sma(stoch, 3)
    stoch_D = ta.sma(stoch_K, 3)
    stRD = ta.crossunder(stoch_K, stoch_D)
    stGD = ta.crossover(stoch_K, stoch_D)
    [stoch_K, stoch_D, stRD, stGD]


// VARIABLES
[bbMiddle, bbUpper, bbLower] = ta.bb(close, 20, 2)
[stoch_K, stoch_D, stRD, stGD] = f_stochastic()


// ORDERS
// Active Orders
// Check if strategy has open positions
inLong = strategy.position_size > 0
inShort = strategy.position_size < 0
// Check if strategy reduced position size in last bar
longClose = strategy.position_size < strategy.position_size[1]
shortClose = strategy.position_size > strategy.position_size[1]

// Entry Conditions
// Enter long when during last candle these conditions are true:
// Candle high is greater than upper Bollinger Band
// Stochastic K line crosses under D line and is oversold
longCondition = stOBOS ?
     low[1] < bbLower[1] and stGD[1] and stoch_K[1] < 25 :
     low[1] < bbLower[1] and stGD[1]

// Enter short when during last candle these conditions are true:
// Candle low is lower than lower Bollinger Band
// Stochastic K line crosses over D line and is overbought
shortCondition = stOBOS ?
     high[1] > bbUpper[1] and stRD[1] and stoch_K[1] > 75 :
     high[1] > bbUpper[1] and stRD[1]

// Exit Conditions
// Calculate Take Profit
longTP1 = strategy.position_avg_price + tp1
longTP2 = strategy.position_avg_price + tp2
shortTP1 = strategy.position_avg_price - tp1
shortTP2 = strategy.position_avg_price - tp2

// Calculate Stop Loss
// Initialise variables
var float longSL = 0.0
var float shortSL = 0.0

// When not in position, set stop loss using close price which is the price used during backtesting
// When in a position, check to see if the position was reduced on the last bar
// If it was, set stop loss to position entry price. Otherwise, maintain last stop loss value
longSL := if inLong and ta.barssince(longClose) < ta.barssince(longCondition)
    strategy.position_avg_price
else if inLong
    longSL[1]
else
    close - sl

shortSL := if inShort and ta.barssince(shortClose) < ta.barssince(shortCondition)
    strategy.position_avg_price
else if inShort
    shortSL[1]
else
    close + sl

// Manage positions
strategy.entry("Long", strategy.long, when=longCondition)
strategy.exit("TP1/SL", from_entry="Long", qty_percent=50, limit=longTP1, stop=longSL)
strategy.exit("TP2/SL", from_entry="Long", limit=longTP2, stop=longSL)

strategy.entry("Short", strategy.short, when=shortCondition)
strategy.exit("TP1/SL", from_entry="Short", qty_percent=50, limit=shortTP1, stop=shortSL)
strategy.exit("TP2/SL", from_entry="Short", limit=shortTP2, stop=shortSL)


// DRAW
// Stochastic Chart
plot(stoch_K, color=color.blue)
plot(stoch_D, color=color.orange)

// Circles
plot(stOBOS ? stRD and stoch_K >= 75 ? stoch_D : na : stRD ? stoch_D : na, color=colorRed, style=plot.style_circles, linewidth=3)
plot(stOBOS ? stGD and stoch_K <= 25 ? stoch_D : na : stGD ? stoch_K : na, color=colorGreen, style=plot.style_circles, linewidth=3)

// Levels
hline(75, linestyle=hline.style_dotted)
hline(25, linestyle=hline.style_dotted)
Detail
https://www.fmz.com/strategy/430178
Last Modified
2023-10-25 18:11:30