
9.6 KiB
Name
三EMA趋势追踪策略Three-EMA-Trend-Following-Strategy
Author
ChaoZhang
Strategy Description
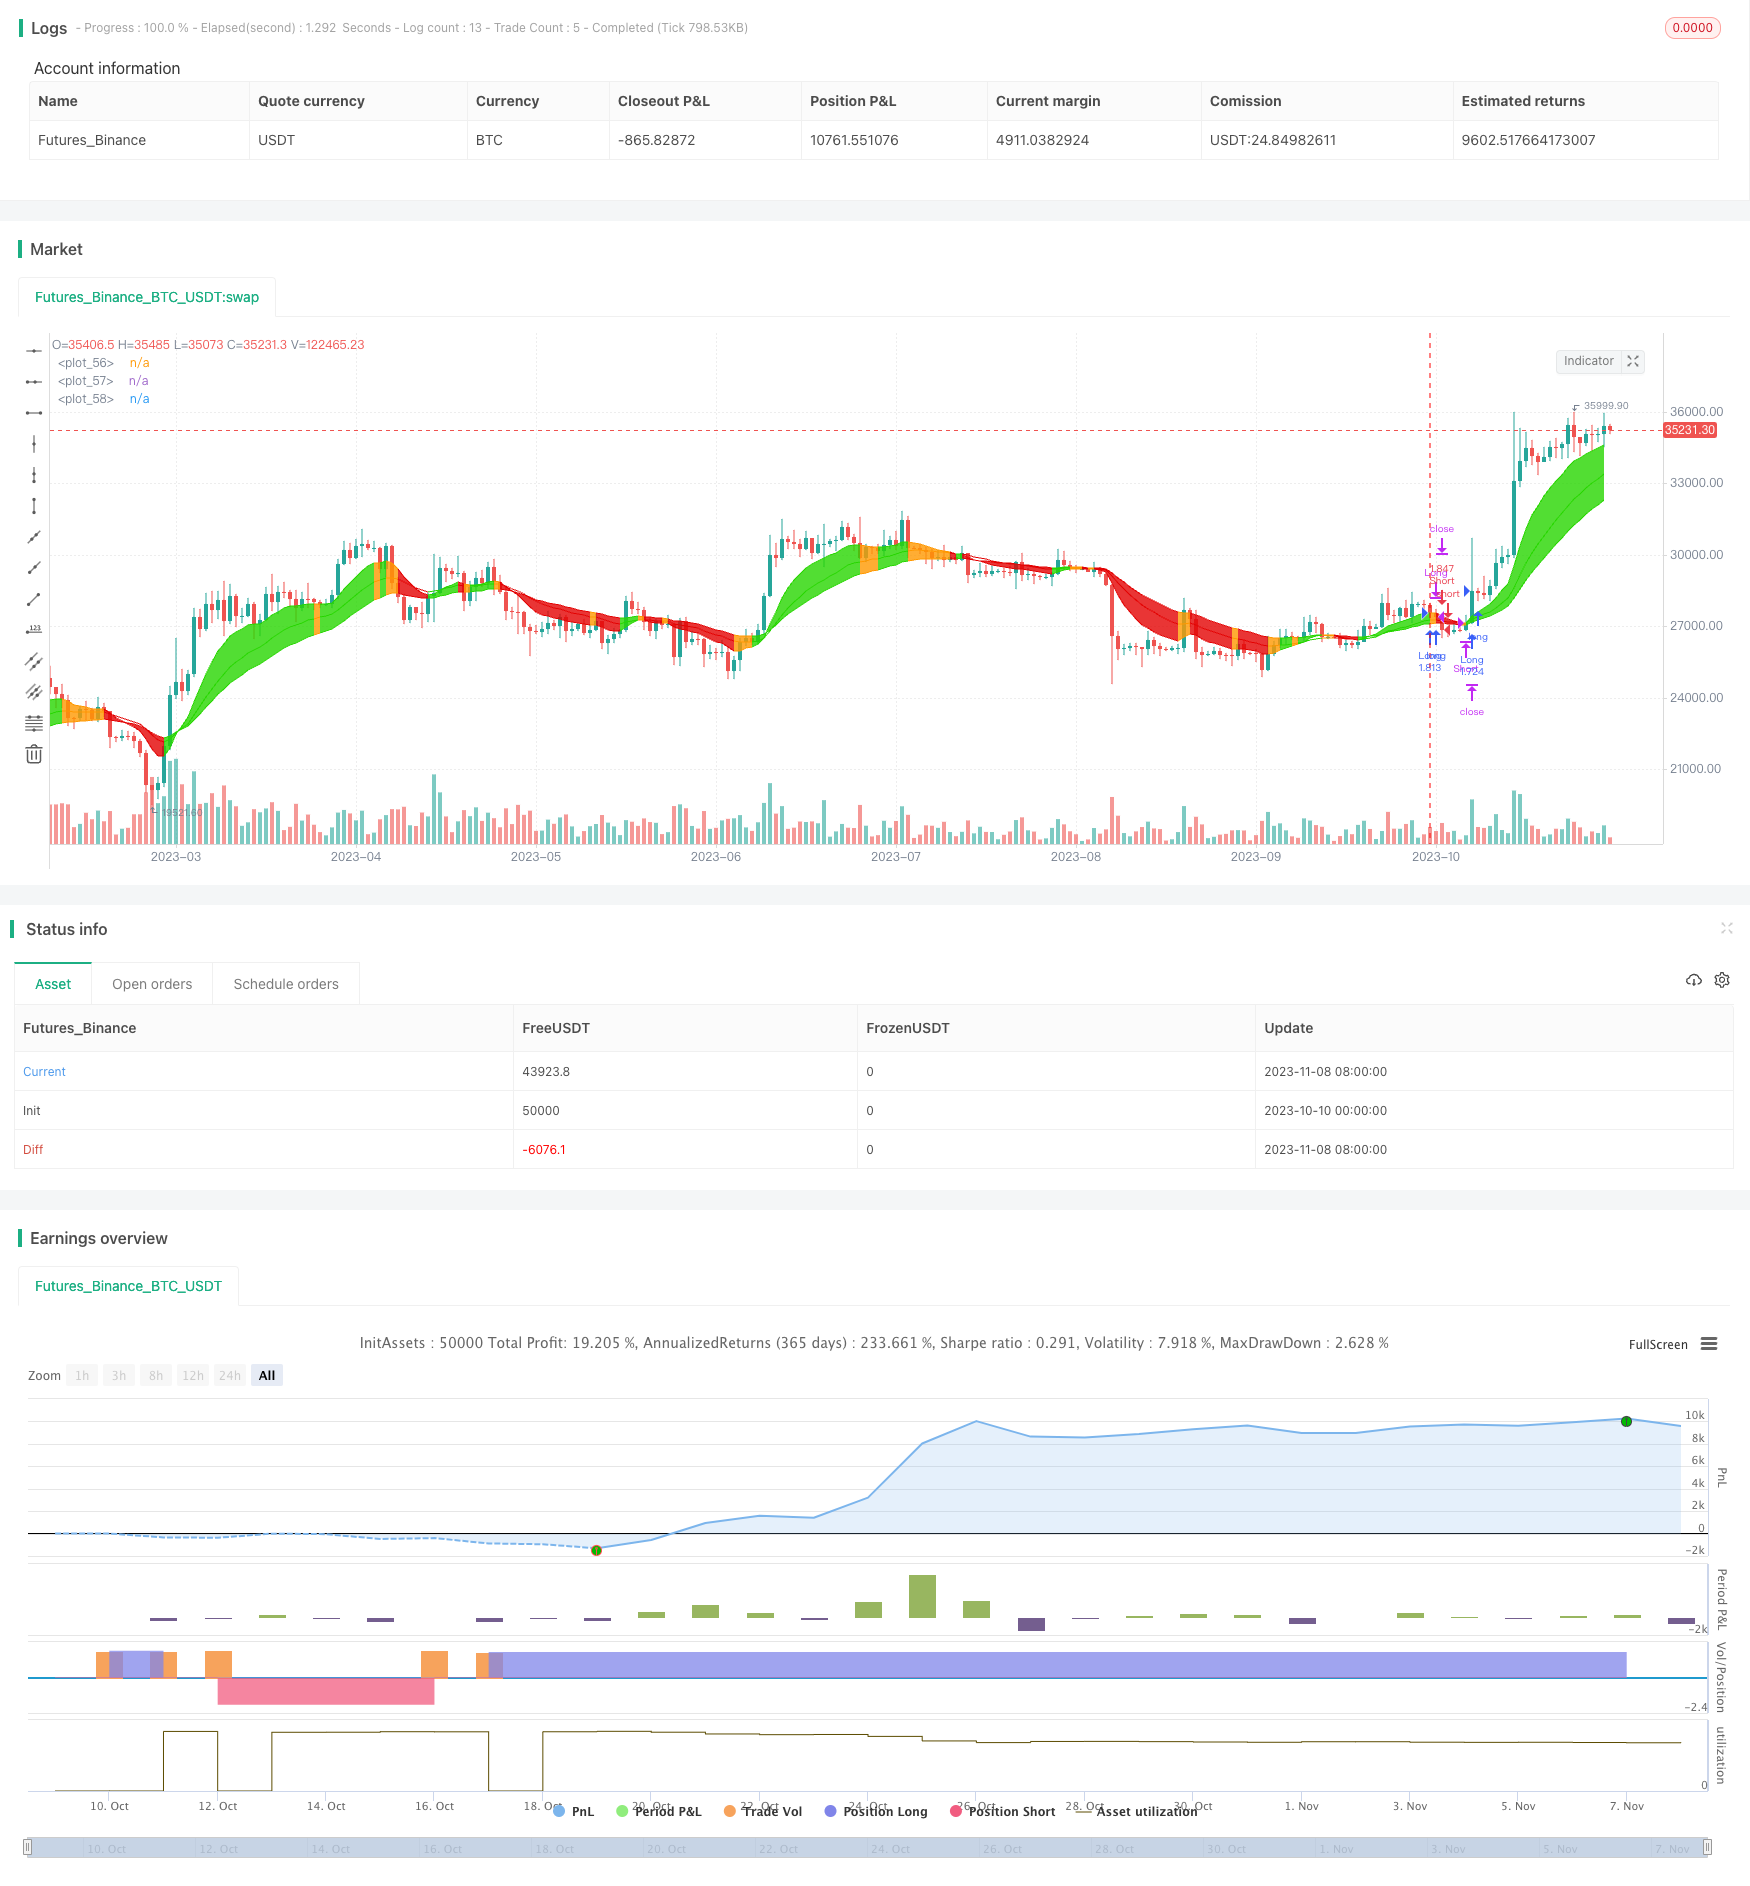 [trans]
概述
三EMA趋势追踪策略通过计算不同周期的EMA均线,判断价格趋势方向,实现趋势追踪。该策略简单易于实现,在趋势明显的品种中效果显著。
策略原理
该策略通过计算三条不同周期的EMA均线,具体为10周期、20周期和30周期的EMA。代码中通过ema函数计算出三条均线。
策略主要判断三条均线的方向。如果三条均线同时上涨,则产生做多信号;如果三条均线同时下跌,则产生做空信号。
做多和做空信号的具体判定逻辑是,如果ema1、ema2和ema3在过去一根K线上同时上涨,则enter_long为真,产生做多信号。如果ema1、ema2和ema3在过去一根K线上同时下跌,则enter_short为真,产生做空信号。
根据做多和做空信号,策略会建立对应的做多和做空仓位。平仓逻辑与入场信号相反,如果ema1、ema2和ema3当前K线没有同时上涨,则exit_long为真,平掉做多仓位。如果ema1、ema2和ema3当前K线没有同时下跌,则exit_short为真,平掉做空仓位。
这样,通过判断三条EMA均线的方向一致性,可以判断价格总体趋势,实现趋势追踪。
策略优势
-
使用三条EMA均线,可以比较准确地判断趋势方向。相比单一均线,三条均线判断趋势更可靠,出现错误信号的概率更小。
-
EMA对价格变化更为敏感,可以及时反映趋势转折。相比SMA等其他均线,EMA更适合判断趋势方向。
-
不同周期EMA结合使用,可以兼顾短期和中长期趋势。10周期EMA判断短期趋势,20周期和30周期EMA判断中长期趋势。
-
策略实现简单,容易理解,适合初学者学习。且参数优化空间大,可以针对不同品种调整参数。
-
策略仅基于EMA均线运作,资源占用少,适合大批量并发运行。
策略风险
-
三条EMA均线方向一致是判断趋势的必要但不充分条件。EMA均线方向假突破时,会产生错误信号。
-
趋势转折时,EMA均线交叉滞后,无法及时反映趋势转折点,可能导致损失。
-
EMA对价格变化敏感,多头和空头转换频繁时,会频繁开仓平仓,增加交易费用。
-
大幅震荡市场中,EMA均线产生多次方向转变,无法准确判断趋势,该策略效果不佳。
-
可适当扩大三条EMA均线周期差距,降低错误信号概率。或加入其他指标过滤假突破。
-
可结合量能指标等确认趋势,识别趋势转折点,减少损失。也可以适当放宽止损点位。
-
可适当增加EMA参数,降低开平仓频率。或采用其他均线指标替代。
-
识别震荡市场后,可以暂停策略,避免无效交易。
优化方向
-
周期优化:调整三条EMA的周期参数,适应不同品种特性。
-
过滤条件:加入MA、BOLL等指标,避免EMA假突破。
-
止损策略: trailing stop逐步追踪止损,保护利润。
-
资金管理:优化仓位管理,降低单笔损失对总体的影响。
-
市场态势判断:根据波动率等指标判断市场震荡程度,控制策略参与度。
-
参数自适应:使EMA周期参数可根据市场变化自动优化,提高策略鲁棒性。
总结
三EMA趋势追踪策略通过EMA均线方向判断价格趋势,实现自动跟踪趋势进行交易。该策略简单实用,参数调整空间大,可针对品种特点进行优化。同时也存在一定风险,需要注意防范EMA假突破,以及震荡市场的影响。通过持续优化,该策略可以成为稳定可靠的趋势跟踪策略。
||
Overview
The Three EMA trend following strategy judges the price trend direction by calculating EMA lines of different periods, and follows the trend automatically. This strategy is simple and effective, especially in trending instruments.
Strategy Logic
This strategy calculates three EMA lines with different periods, specifically 10-period, 20-period and 30-period EMA. The ema function in code generates the three EMA lines.
The core logic is to judge the direction consistency of the three EMA lines. If all three EMA lines rise together, a long signal is generated. If all three lines fall together, a short signal is generated.
Specifically, if ema1, ema2 and ema3 all rise in the last bar, enter_long becomes true and a long signal is generated. If ema1, ema2 and ema3 all fall in the last bar, enter_short becomes true and a short signal is generated.
Based on the long and short signals, the strategy will open corresponding long and short positions. The exit logic is opposite to entry signals. If ema1, ema2 and ema3 don't rise together in current bar, exit_long becomes true and long position will be closed. If ema1, ema2 and ema3 don't fall together in current bar, exit_short becomes true and short position will be closed.
By judging the direction consistency of the three EMA lines, the overall trend can be determined and followed.
Advantages
-
Using three EMA lines can judge the trend direction more reliably compared to a single line. The probability of wrong signals is lower.
-
EMA is more sensitive to price changes and can reflect trend reversal in time. It is more suitable for trend judgment compared to SMA etc.
-
The combination of different period EMA takes both short-term and mid-long term trend into consideration. 10-period EMA for short-term, 20 and 30-period EMA for mid-long term trend.
-
The strategy logic is simple and easy to understand, suitable for beginners. Also the parameters have large optimization space for different instruments.
-
The strategy is solely based on EMA lines, requiring less resources and suitable for high concurrency.
Risks
-
EMA line direction consistency is necessary but insufficient for trend judgment. Wrong signals may occur during EMA line false breakout.
-
EMA lines lag in trend reversal, unable to reflect turning points in time, which may cause losses.
-
EMA is sensitive to price changes, frequent long-short position flip may increase transaction costs.
-
The strategy is ineffective in ranging, volatile market where EMA lines fluctuate frequently.
-
Can optimize EMA period difference to reduce false signals. Or add other indicators to filter fake breakouts.
-
Add momentum indicators to confirm real trend and identify turning points, reducing losses. Also can loosen stop loss.
-
Increase EMA periods to reduce position flip frequency. Or use other MA indicators.
-
Suspend strategy when ranging market is identified, avoiding unnecessary trades.
Optimization
-
Period tuning: Adjust EMA periods to adapt to different instruments.
-
Add filters: Add MA, BOLL etc to avoid EMA fake breakouts.
-
Stop loss: Trailing stop to lock profits.
-
Risk management: Optimize position sizing to limit single loss impact.
-
Market regime: Use volatility to gauge oscillation and control strategy engagement.
-
Adaptive parameters: Auto-optimize EMA periods based on market changes to improve robustness.
Conclusion
The Three EMA trend following strategy trades by identifying trend direction via EMA lines. It is simple and practical with large optimization space. Risks like false breakouts and oscillation should be noted. With continuous optimizations, this strategy can become a robust trend following solution.
[/trans]
Strategy Arguments
| Argument | Default | Description |
|---|---|---|
| v_input_1 | 10 | EMA1 Period |
| v_input_2 | 20 | EMA2 Period |
| v_input_3 | 30 | EMA3 Period |
| v_input_4 | false | Long Only |
| v_input_5 | 5 | Stop-loss (%) |
| v_input_6 | false | Use Stop-Loss |
Source (PineScript)
/*backtest
start: 2023-10-10 00:00:00
end: 2023-11-09 00:00:00
period: 1d
basePeriod: 1h
exchanges: [{"eid":"Futures_Binance","currency":"BTC_USDT"}]
*/

// This source code is subject to the terms of the Mozilla Public License 2.0 at https://mozilla.org/MPL/2.0/
// © QuantCT

//@version=4
strategy("PMA Strategy Idea",
         shorttitle="PMA",
         overlay=true,
         pyramiding=0,
         default_qty_type=strategy.percent_of_equity,
         default_qty_value=100,
         initial_capital=1000,
         commission_type=strategy.commission.percent,
         commission_value=0.075)

// ____ Inputs

ema1_period = input(title="EMA1 Period", defval=10)
ema2_period = input(title="EMA2 Period", defval=20)
ema3_period = input(title="EMA3 Period", defval=30)
long_only = input(title="Long Only", defval=false)
slp = input(title="Stop-loss (%)", minval=1.0, maxval=25.0, defval=5.0)
use_sl = input(title="Use Stop-Loss", defval=false)

// ____ Logic

ema1 = ema(hlc3, ema1_period)
ema2 = ema(hlc3, ema2_period)
ema3 = ema(hlc3, ema3_period)

enter_long = (rising(ema1, 1) and rising(ema2, 1) and rising(ema3, 1))
exit_long = not enter_long
enter_short = (falling(ema1, 1) and falling(ema2, 1) and falling(ema3, 1))
exit_short = not enter_short

strategy.entry("Long", strategy.long, when=enter_long)
strategy.close("Long", when=exit_long)
if (not long_only)
    strategy.entry("Short", strategy.short, when=enter_short)
    strategy.close("Short", when=exit_short)

// ____ SL

sl_long = strategy.position_avg_price * (1- (slp/100))
sl_short = strategy.position_avg_price * (1 + (slp/100))
if (use_sl)
    strategy.exit(id="SL", from_entry="Long", stop=sl_long)
    strategy.exit(id="SL", from_entry="Short", stop=sl_short)

// ____ Plots

colors =
 enter_long ? #27D600 :
 enter_short ? #E30202 :
 color.orange

ema1_plot = plot(ema1, color=colors)
ema2_plot = plot(ema2, color=colors)
ema3_plot = plot(ema3, color=colors)
fill(ema1_plot, ema3_plot, color=colors, transp=50)
Detail
https://www.fmz.com/strategy/431667
Last Modified
2023-11-10 11:45:30