
10 KiB
Name
三重EMA追踪止损策略Triple-EMA-With-Trailing-Stop-Loss-Strategy
Author
ChaoZhang
Strategy Description
[trans]
概述
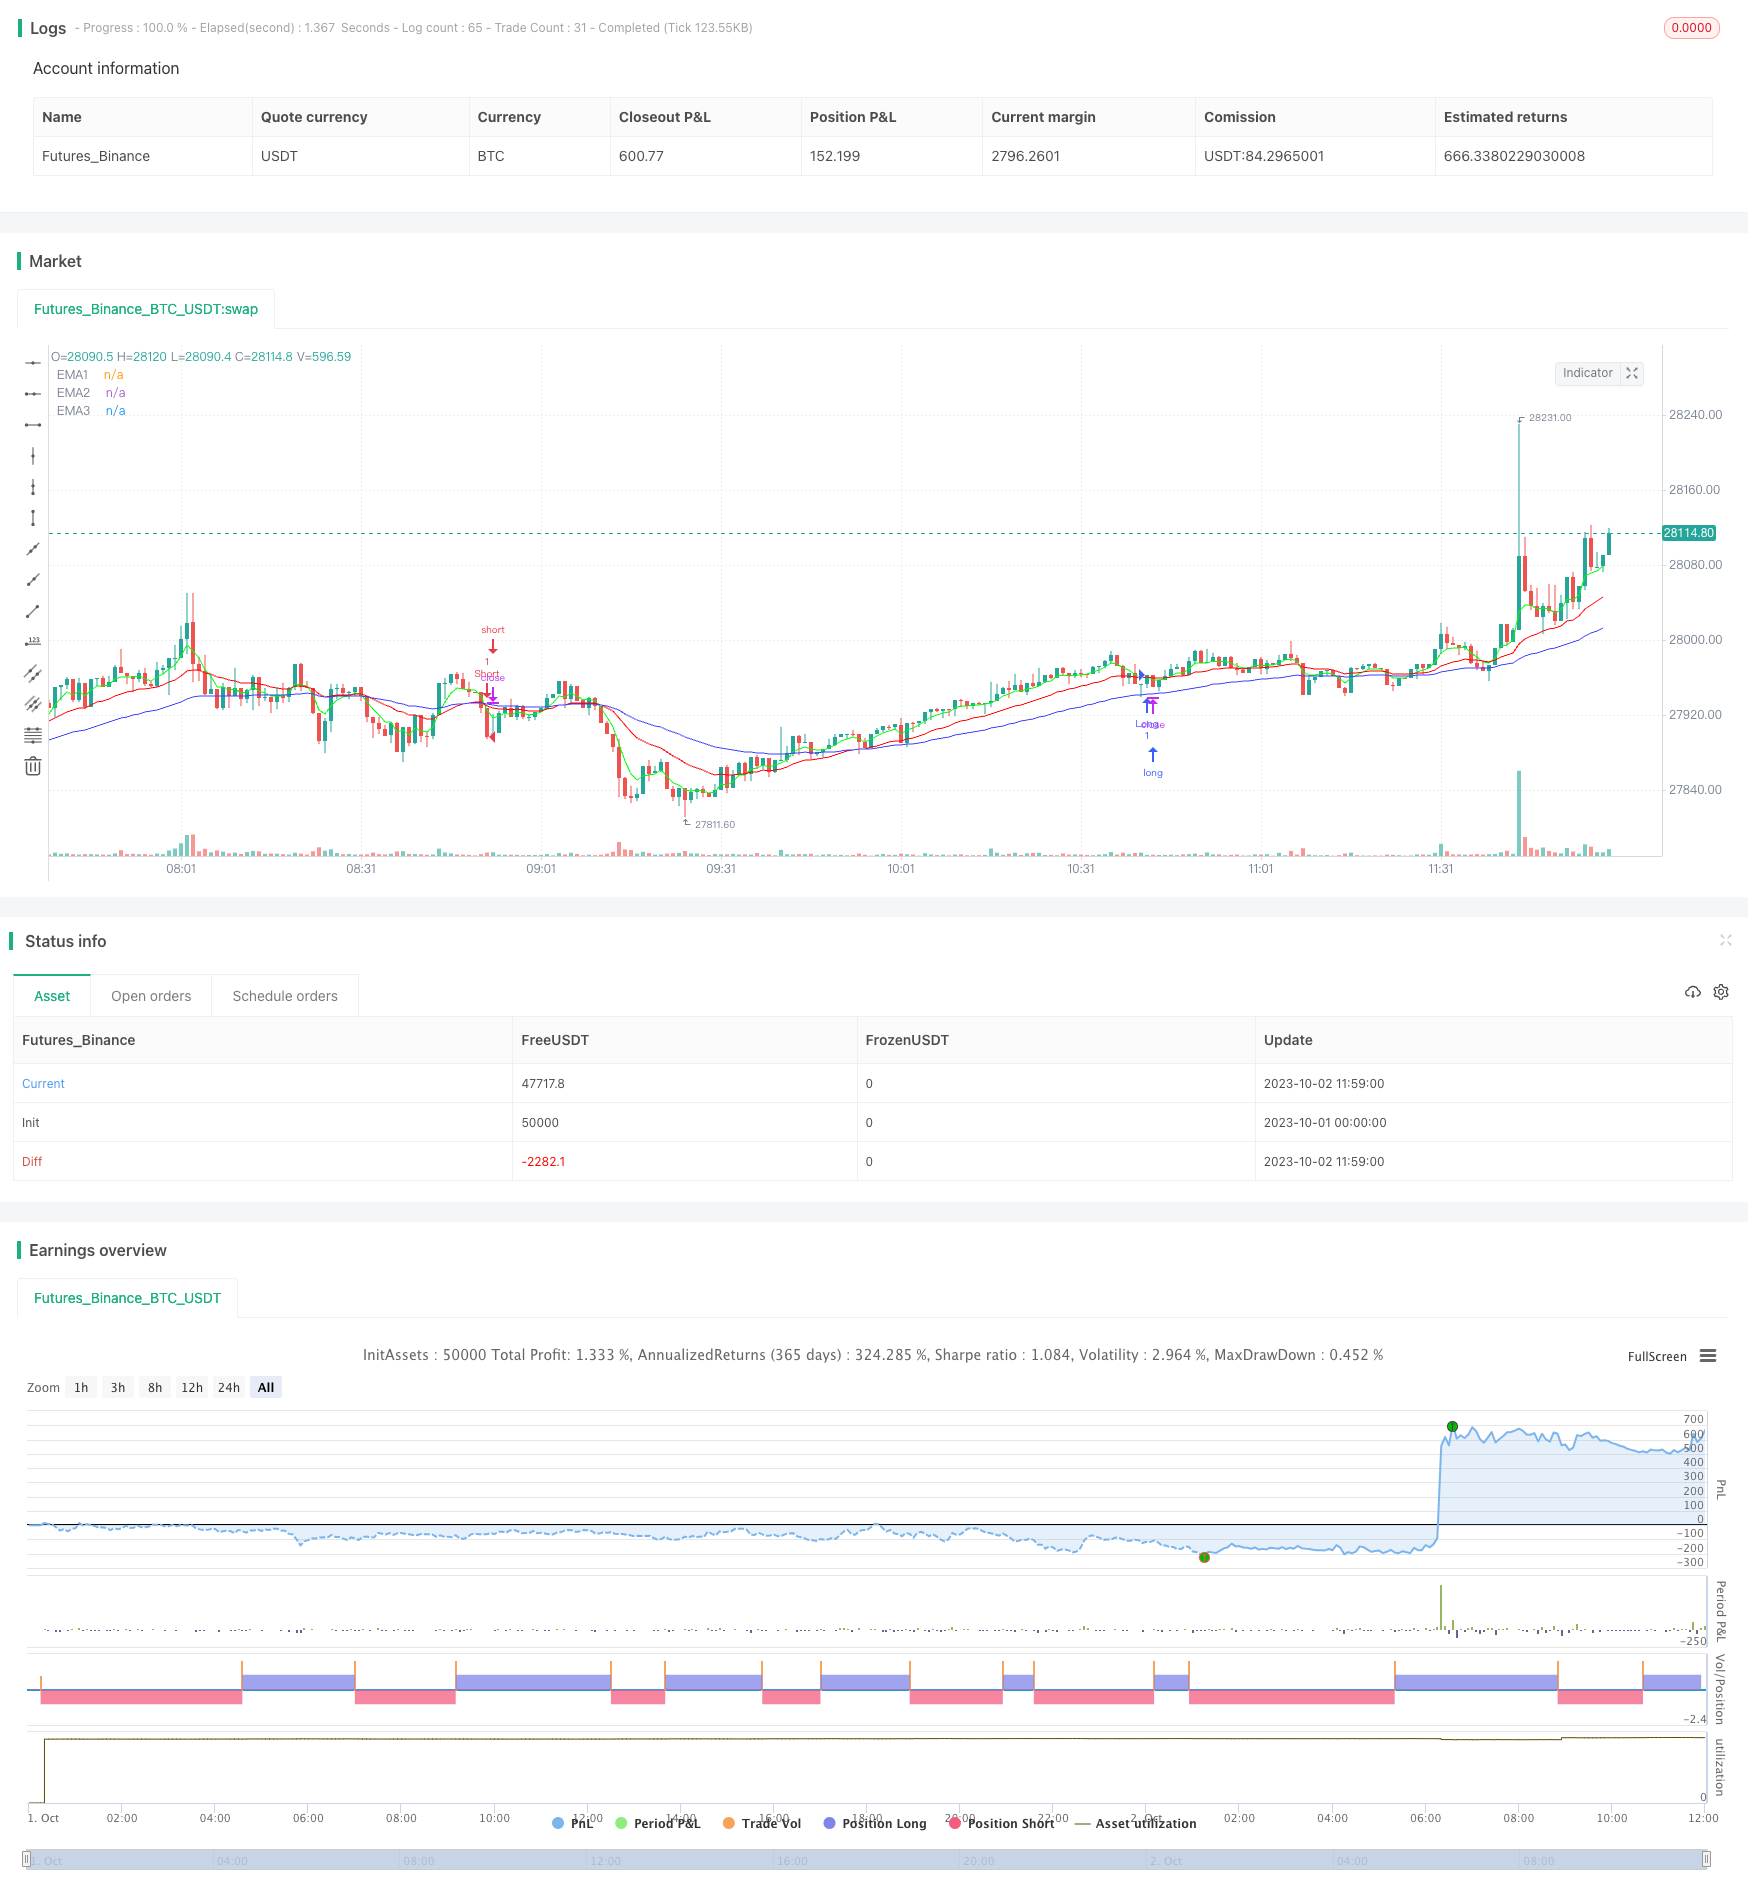
该策略是一种典型的三重指数移动平均线交易策略的实现。它通过比较快速的5日EMA,中速的20日EMA和缓慢的50日EMA的交叉情况来产生交易信号。同时,它还结合当前K线收盘价较前一日收盘价上涨或下跌一定ticks来过滤假信号。此外,该策略还采用了追踪止损来锁定利润。
原理
当5日EMA上穿20日EMA,且三条EMA均呈多头排列(5日EMA > 20日EMA > 50日EMA),并且当前K线收盘价较前一日收盘价上涨超过一定ticks时,做多;当5日EMA下穿20日EMA,且三条EMA均呈空头排列(5日EMA < 20日EMA < 50日EMA),并且当前K线收盘价较前一日收盘价下跌超过一定ticks时,做空。
入场后,如果价格运行超过一定ticks,则启动追踪止损机制,根据价格波动来持续调整止损线,以锁定更大利润。
优势
-
使用三重EMA形成交易信号,可以有效过滤市场噪音,识别趋势。快速EMA反映最新变化,中速EMA确定趋势方向,慢速EMA过滤震荡。
-
增加当前K线收盘价与前一日收盘价的比较,可以进一步过滤假信号,减少不必要的交易。
-
采用追踪止损机制,可以根据行情走势来动态调整止损线,最大程度锁定利润。
-
该策略参数设置灵活,可以根据不同品种和周期进行优化,从日线到分钟线都适用。
风险
-
在震荡行情中,EMA交叉信号频繁,容易产生过多交易而增加交易费用和滑点成本。
-
追踪止损在大幅震荡中可能过早止损,无法持有整个趋势。
-
EMA延迟特性可能错过趋势转折点,产生损失。
-
需要优化参数如EMA周期长度,追踪止损ticks等,不同品种和周期下效果差异大。
优化方向
-
可以结合其他指标如MACD、KD等来辅助过滤交易信号。
-
可以根据具体品种和周期参数进行测试和优化,找到最佳参数组合。
-
可以通过人工干预或机器学习等方法来动态调整参数。
-
可以考虑在特定行情下关闭追踪止损,全仓持有趋势。
-
可以结合自动止盈来替代简单的追踪止损。
总结
该策略整合了EMA交叉、价格突破和追踪止损三种常见技术分析方法,形成一个较为全面和可靠的趋势跟踪交易系统。通过参数优化,可适应各类品种和周期,在趋势明显的市场中效果较好。但该策略也存在一些典型的技术分析策略弱点,需要进一步优化来应对更多市场情况。总体来说,该策略为量化交易提供了一个简单实用的思路,是常见策略思想的很好实践和演示。
||
Overview
This strategy implements a typical triple exponential moving average (EMA) trading system. It generates trading signals by comparing fast 5-day EMA, medium 20-day EMA and slow 50-day EMA. It also uses the current bar's close price compared to previous bar's close to filter fake signals. In addition, a trailing stop loss is used to lock in profits.
Principles
When 5-day EMA crosses above 20-day EMA, and all three EMAs are bullishly aligned (5-day EMA > 20-day EMA > 50-day EMA), and current bar's close is above previous bar's close by certain ticks, go long. When 5-day EMA crosses below 20-day EMA, and all three EMAs are bearishly aligned (5-day EMA < 20-day EMA < 50-day EMA), and current bar's close is below previous bar's close by certain ticks, go short.
After entry, when price runs by certain ticks, a trailing stop loss will be initiated to keep adjusting the stop loss based on price fluctuation, in order to lock in larger profits.
Advantages
-
Using triple EMAs to generate signals can effectively filter market noise and identify trends. Fast EMA reflects latest changes, medium EMA determines trend direction, and slow EMA filters oscillations.
-
Comparing current bar's close with previous bar's close further filters fake signals and reduces unnecessary trades.
-
Trailing stop loss dynamically adjusts stop loss based on price action to maximize profit locking.
-
Flexible parameter settings of this strategy allows optimization across different products and timeframes from daily to minute bars.
Risks
-
Frequent EMA crossovers can generate excessive trades in ranging markets, increasing costs from commissions and slippage.
-
Trailing stop loss may prematurely exit the trend during huge whipsaws.
-
EMA lag may cause missing major turning points and losses.
-
Parameters like EMA periods, trailing stop ticks require optimization for different products and timeframes.
Enhancement Directions
-
Incorporate other indicators like MACD, KD to filter trading signals.
-
Test and optimize parameters for specific products and timeframes to find best combinations.
-
Dynamically adjust parameters through human oversight or machine learning.
-
Consider disabling trailing stop and holding full position for specific market conditions.
-
Replace simple trailing stop loss with more advanced automatic profit taking mechanisms.
Conclusion
This strategy integrates three common technical analysis techniques - EMA crossover, price breakout and trailing stop loss into a rather comprehensive and robust trend following trading system. Through parameter optimization, it can be adapted to different products and timeframes and performs well in strong trending markets. But it also has some typical weaknesses of technical analysis strategies that need further optimization to handle more market situations. Overall, this strategy provides a simple and practical idea for quantitative trading by demonstrating some common strategy concepts very well.
[/trans]
Strategy Arguments
| Argument | Default | Description |
|---|---|---|
| v_input_1 | false | ═════ Data Filtering ═════ |
| v_input_2 | 2021 | Year |
| v_input_3 | false | Month (0=ALL) |
| v_input_4 | 100 | Stop Loss (ticks) |
| v_input_5 | 130 | Trailing S/L (ticks) |
| v_input_6 | 15 | Buffer (ticks) |
| v_input_7 | 5 | EMA 1 |
| v_input_8 | 20 | EMA 2 |
| v_input_9 | 50 | EMA 3 |
Source (PineScript)
/*backtest
start: 2023-10-01 00:00:00
end: 2023-10-02 12:00:00
period: 1m
basePeriod: 1m
exchanges: [{"eid":"Futures_Binance","currency":"BTC_USDT"}]
*/

// This source code is subject to the terms of the Mozilla Public License 2.0 at https://mozilla.org/MPL/2.0/
// © Matt Dearden - IndoPilot
// @version=4

/////////////////////////////////////////////////////// Initial Parameters ///////////////////////////////////////////////////////
SystemName = "Triple EMA Strategy"
ShortSystemName = "TEMA"
InitPosition = 0
InitCapital = 50000
InitCommission = 0.004 //approx value to compensate for Oanda spreads
InitPyramidMax = 0
CalcOnorderFills = true

strategy(title=SystemName, shorttitle=ShortSystemName, overlay=true, pyramiding=InitPyramidMax,
 default_qty_type=strategy.cash, default_qty_value=InitPosition, commission_type=strategy.commission.percent,
 commission_value=InitCommission, initial_capital=InitCapital, max_lines_count=500,
 max_labels_count=500, process_orders_on_close=false, calc_on_every_tick=false)

///////////////////////////////////////////////////////////// Inputs /////////////////////////////////////////////////////////////

DateFilter = input(false, "═════ Data Filtering ═════")
InitYear = input(title="Year", type=input.integer, defval=2021, minval=2000, maxval=2021)
InitMonth = input(title="Month (0=ALL)", type=input.integer, defval=0, minval=0, maxval=12)
InitStopLoss = input(title="Stop Loss (ticks)", type=input.integer, defval=100, minval=0, maxval=1000)
TrailingStopLoss = input(title="Trailing S/L (ticks)", type=input.integer, defval=130, minval=0, maxval=1000)
InitBuffer = input(title="Buffer (ticks)", type=input.integer, defval=15, minval=0, maxval=1000)
InitEMA1 = input(title="EMA 1", type=input.integer, defval=5, minval=0, maxval=1000)
InitEMA2 = input(title="EMA 2", type=input.integer, defval=20, minval=0, maxval=1000)
InitEMA3 = input(title="EMA 3", type=input.integer, defval=50, minval=0, maxval=1000)

//////////////////////////////////////////////////////////// Variables ///////////////////////////////////////////////////////////

var StopLoss = float(0.0)
var StartPrice = float(0.0)
//setup multipliers and catch JPY difference
Multiplier = syminfo.currency == "JPY" ? 10 : 1000
//get the daily exchange rate from yesterday
//X_rate = security(AccountCurrency+syminfo.currency, "D", close[1])
OrderQty = 1
Buffer = InitBuffer / (Multiplier * 100)

/////////////////////////////////////////////////////// Triple EMA Strategy //////////////////////////////////////////////////////

EMA1 = ema(close, InitEMA1)
EMA2= ema(close, InitEMA2)
EMA3 = ema(close, InitEMA3)

//entry conditions
longCondition = crossover(EMA1, EMA2) and close > EMA3 and EMA1 > EMA3 and EMA2 > EMA3 and close > (close[1] + Buffer)
shortCondition = crossunder(EMA1, EMA2) and close < EMA3 and EMA1 < EMA3 and EMA2 < EMA3 and close < (close[1] - Buffer)

/////////////////////////////////////////////////////// Trailing Stoploss ////////////////////////////////////////////////////////

if (strategy.position_size > 0 and (close > (StartPrice + (TrailingStopLoss / (100 * Multiplier)))))
    StopLoss := max(StopLoss, close - (TrailingStopLoss / (100 * Multiplier)))
    strategy.exit("Long Stoploss", "Long")

if (strategy.position_size < 0 and (close < (StartPrice - (InitStopLoss / (100 * Multiplier)))))
    StopLoss := min(StopLoss, close + (TrailingStopLoss / (100 * Multiplier)))
    strategy.exit("Short Stoploss", "Short")

///////////////////////////////////////////////////////// Setup entries /////////////////////////////////////////////////////////

if (longCondition)
    StartPrice := close
    StopLoss := StartPrice - (InitStopLoss / (100 * Multiplier))
    strategy.entry("Long", strategy.long, qty=OrderQty)
    strategy.exit("Long Stoploss", "Long")

if (shortCondition)
    StartPrice := close
    StopLoss := StartPrice + (InitStopLoss / (100 * Multiplier))
    strategy.entry("Short", strategy.short, qty=OrderQty)
    strategy.exit("Short Stoploss", "Short")

///////////////////////////////////////////////////////// Draw the EMAs /////////////////////////////////////////////////////////
plot(EMA1, "EMA1", color=#00FF00)
plot(EMA2, "EMA2", color=#FF0000)
plot(EMA3, "EMA3", color=#4040FF)
Detail
https://www.fmz.com/strategy/429478
Last Modified
2023-10-17 15:05:41