
13 KiB
Name
RSI趋势反转策略RSI-Trend-Reversal-Strategy
Author
ChaoZhang
Strategy Description
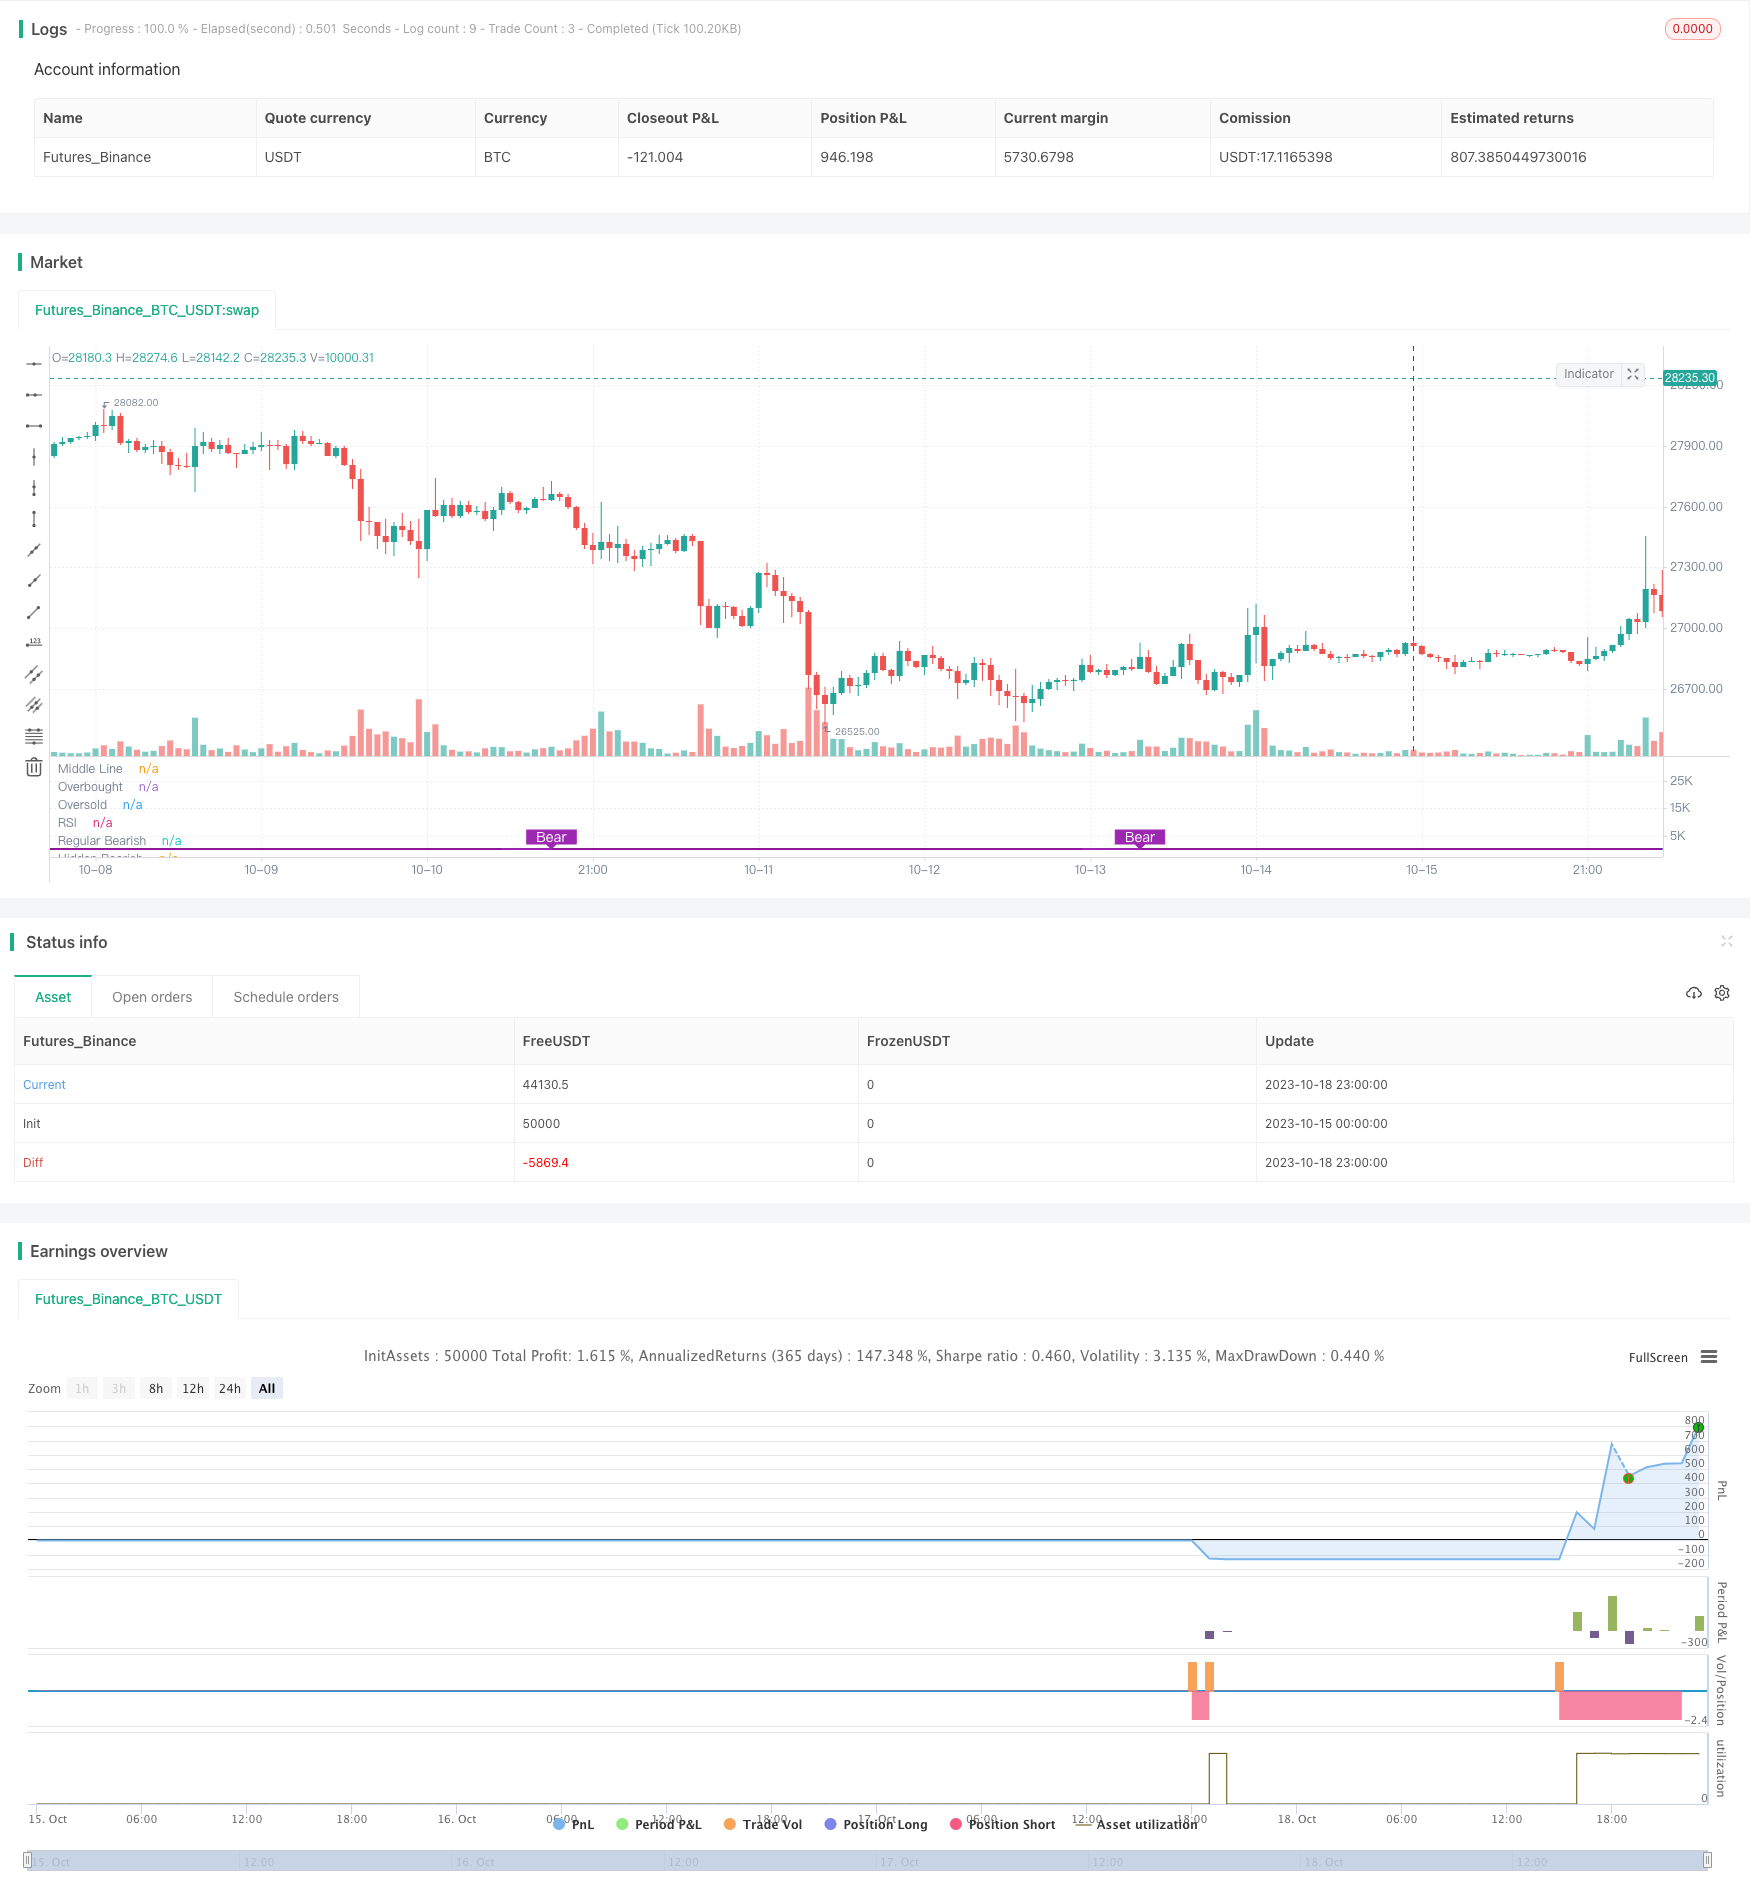
[trans]
概述
RSI趋势反转策略利用RSI指标反转信号,判断潜在趋势反转点,进场做多做空。该策略结合价格反转以及RSI反转,可以有效过滤假反转信号。
策略原理
该策略基于RSI指标的反转信号以及价格的反转信号进行组合判断,主要分为四种情况:
-
常规多头反转:当RSI形成较高低点(意味着RSI趋势反转由上向下),而价格形成较低低点时(意味着价格趋势反转由下向上),产生常规多头反转信号。
-
隐藏多头反转:当RSI形成较低低点(意味着RSI趋势继续由上向下),但价格形成较高低点时(意味着价格趋势反转由下向上),产生隐藏多头反转信号。
-
常规空头反转:当RSI形成较低高点(意味着RSI趋势反转由下向上),而价格形成较高高点时(意味着价格趋势反转由上向下),产生常规空头反转信号。
-
隐藏空头反转:当RSI形成较高高点(意味着RSI趋势继续由下向上),但价格形成较低高点时(意味着价格趋势反转由上向下),产生隐藏空头反转信号。
这样能够同时结合RSI指标反转和价格反转来发出交易信号,可以有效避免仅凭RSI指标或者仅凭价格反转造成的假信号,增强策略的稳定性。
优势分析
RSI趋势反转策略具有以下优势:
-
结合RSI指标和价格反转信号,可以有效过滤假反转信号,提高信号质量。RSI指标仅凭自己并不能完全可靠判断反转点,需要和价格行情反转共同验证。
-
识别隐藏多头和隐藏空头形态,这些隐藏形态往往预示着即将出现更加强劲的价格趋势,能够提前捕捉趋势机会。
-
RSI参数和回看周期可自定义,可以针对不同市场调整,灵活实用。
-
可视化绘制指标形态和信号,直观判断市场状态。
-
策略逻辑简洁清晰,容易理解实现,适合용作量化交易策略。
风险分析
RSI趋势反转策略也存在以下风险:
-
RSI反转结合价格反转,能够过滤许多假信号,但不排除仍会有误判的可能。指标毕竟是对价格的统计测度,不可完全依赖。
-
隐藏多头和隐藏空头形态不容易识别,可能会漏掉这些机会,需要一定的经验判断。
-
回看周期参数设置不当可能导致错过反转时点或判断滞后。不同市场需要调整周期参数。
-
需要确保止损策略配合使用,避免空头反转后继续下跌造成亏损扩大。
可以通过优化参数,严格止损,适当把握隐藏反转等方法来控制风险。
优化方向
RSI趋势反转策略可以从以下方面进行优化:
-
调整RSI参数,测试不同市场对RSI周期parameter的敏感性,找到最佳参数。
-
优化回看周期参数,平衡捕捉反转时点和防止假信号的需求。
-
增加成交量的统计分析,例如大量减仓导致价格反转的成交量背离识别。
-
结合其他指标信号进行组合,例如MACD、布林带等,提高判断准确性。
-
增加止损策略,避免亏损扩大。可以设定价格突破新高/新低之后止损。
-
根据回测结果修正策略逻辑,提高盈利因子。例如调整开仓条件逻辑关系(与、或、非),寻找最佳交易策略。
总结
RSI趋势反转策略通过组合RSI指标反转和价格反转来识别潜在的趋势转折点。它有效利用了RSI的趋势判断能力,同时结合价格行情过滤假信号。该策略逻辑简单清晰,容易实现。可以通过参数优化、止损策略优化来控制风险,并进一步提升策略表现。总体来说,RSI趋势反转策略是一种可靠、实用的短线交易策略。
||
Overview
The RSI Trend Reversal strategy utilizes the reversal signals of the RSI indicator to identify potential trend reversal points and enter long or short trades. This strategy combines price reversal and RSI reversal signals to effectively filter out false reversal signals.
Strategy Logic
This strategy is based on the combination of RSI reversal signals and price reversal signals, mainly including four situations:
-
Regular Bullish Reversal: When RSI forms a higher low (meaning RSI trend reverses from up to down) and price forms a lower low (meaning price trend reverses from down to up), a regular bullish reversal signal is generated.
-
Hidden Bullish Reversal: When RSI forms a lower low (meaning RSI trend continues from up to down) but price forms a higher low (meaning price trend reverses from down to up), a hidden bullish reversal signal is generated.
-
Regular Bearish Reversal: When RSI forms a lower high (meaning RSI trend reverses from down to up) and price forms a higher high (meaning price trend reverses from up to down), a regular bearish reversal signal is generated.
-
Hidden Bearish Reversal: When RSI forms a higher high (meaning RSI trend continues from down to up) but price forms a lower high (meaning price trend reverses from up to down), a hidden bearish reversal signal is generated.
This combines both RSI reversal and price reversal signals to generate trading signals, avoiding false signals from relying merely on RSI or price reversals alone, making the strategy more robust.
Advantage Analysis
The RSI Trend Reversal strategy has the following advantages:
-
Combining RSI and price reversal filters out many false reversal signals and improves signal quality. RSI alone is not completely reliable in identifying reversals, requiring confirmation from price.
-
Identifying hidden bullish and bearish patterns, which often precede powerful price trends, allows early entry.
-
Customizable RSI parameters and lookback periods can be adjusted for different markets, offering flexibility.
-
Visualizing indicator patterns and signals gives intuitive market state judgment.
-
Simple and clear strategy logic makes it easy to understand and implement for algo trading.
Risk Analysis
The RSI Trend Reversal strategy also has the following risks:
-
The combined RSI and price reversal may still have occasional misjudgments. Indicators are statistical measurements of price and cannot be fully relied on.
-
Hidden bullish and bearish patterns are hard to identify and opportunities could be missed without experience.
-
Improper lookback period settings may lead to missing reversal points or lagging judgments. Periods need adjusting for different markets.
-
Stop loss strategies should be implemented to avoid loss increasing after bearish reversals.
Risks can be managed by optimizing parameters, strict stop loss, prudently taking hidden reversal signals, etc.
Optimization Directions
The RSI Trend Reversal strategy can be optimized in the following aspects:
-
Adjust RSI parameters and test sensitivity to find optimal RSI period for different markets.
-
Optimize lookback period parameters to balance catching reversals early and preventing false signals.
-
Add volume analysis such as detecting high volume unwinding causing price reversals.
-
Combine other indicator signals like MACD, Bollinger Bands to improve judgment accuracy.
-
Add stop loss strategies to limit loss size. Can set stop loss after price breaks new highs/lows.
-
Refine strategy logic based on backtest results to improve profit factors. Adjust logic relationships and find optimal combinations.
Summary
The RSI Trend Reversal strategy identifies potential trend turning points by combining RSI reversals and price reversals. It makes good use of RSI's trend judging capability while filtering false signals with price information. The strategy has simple and clear logic that is easy to implement. Parameters and stop loss can be optimized to manage risks and further improve performance. Overall, the RSI Trend Reversal strategy is a reliable and practical short-term trading strategy.
[/trans]
Strategy Arguments
| Argument | Default | Description |
|---|---|---|
| v_input_1 | 5 | RSI Period |
| v_input_2_close | 0 | RSI Source: close |
| v_input_3 | 5 | Pivot Lookback Right |
| v_input_4 | 5 | Pivot Lookback Left |
| v_input_5 | 60 | Max of Lookback Range |
| v_input_6 | 5 | Min of Lookback Range |
| v_input_7 | true | Plot Bullish |
| v_input_8 | true | Plot Hidden Bullish |
| v_input_9 | true | Plot Bearish |
| v_input_10 | false | Plot Hidden Bearish |
Source (PineScript)
/*backtest
start: 2023-10-15 00:00:00
end: 2023-10-19 00:00:00
period: 1h
basePeriod: 15m
exchanges: [{"eid":"Futures_Binance","currency":"BTC_USDT"}]
*/

//@version=4
//study(title="Divergence Indicator", format=format.price)
strategy(title="RSI Divergence Indicator", overlay=false,pyramiding=1, default_qty_value=2,   default_qty_type=strategy.fixed, initial_capital=10000, currency=currency.USD)

len = input(title="RSI Period", minval=1, defval=5)
src = input(title="RSI Source", defval=close)
lbR = input(title="Pivot Lookback Right", defval=5)
lbL = input(title="Pivot Lookback Left", defval=5)
rangeUpper = input(title="Max of Lookback Range", defval=60)
rangeLower = input(title="Min of Lookback Range", defval=5)
plotBull = input(title="Plot Bullish", defval=true)
plotHiddenBull = input(title="Plot Hidden Bullish", defval=true)
plotBear = input(title="Plot Bearish", defval=true)
plotHiddenBear = input(title="Plot Hidden Bearish", defval=false)

bearColor = color.purple
bullColor = color.green
hiddenBullColor = color.new(color.green, 80)
hiddenBearColor = color.new(color.red, 80)
textColor = color.white
noneColor = color.new(color.white, 100)

osc = rsi(src, len)

plot(osc, title="RSI", linewidth=2, color=#8D1699)
hline(50, title="Middle Line", linestyle=hline.style_dotted)
obLevel = hline(70, title="Overbought", linestyle=hline.style_dotted)
osLevel = hline(30, title="Oversold", linestyle=hline.style_dotted)
fill(obLevel, osLevel, title="Background", color=#9915FF, transp=90)

plFound = na(pivotlow(osc, lbL, lbR)) ? false : true
phFound = na(pivothigh(osc, lbL, lbR)) ? false : true

_inRange(cond) =>
    bars = barssince(cond == true)
    rangeLower <= bars and bars <= rangeUpper

//------------------------------------------------------------------------------
// Regular Bullish

// Osc: Higher Low
oscHL = osc[lbR] > valuewhen(plFound, osc[lbR], 1) and _inRange(plFound[1])

// Price: Lower Low
priceLL = low[lbR] < valuewhen(plFound, low[lbR], 1)

bullCond = plotBull and priceLL and oscHL and plFound

plot(
	 plFound ? osc[lbR] : na,
	 offset=-lbR,
	 title="Regular Bullish",
	 linewidth=2,
	 color=(bullCond ? bullColor : noneColor),
	 transp=0
	 )


plotshape(
	 bullCond ? osc[lbR] : na,
	 offset=-lbR,
	 title="Regular Bullish Label",
	 text=" Bull ",
	 style=shape.labelup,
	 location=location.absolute,
	 color=bullColor,
	 textcolor=textColor,
	 transp=0
	 )

//------------------------------------------------------------------------------
// Hidden Bullish

// Osc: Lower Low
oscLL = osc[lbR] < valuewhen(plFound, osc[lbR], 1) and _inRange(plFound[1])

// Price: Higher Low
priceHL = low[lbR] > valuewhen(plFound, low[lbR], 1)

hiddenBullCond = plotHiddenBull and priceHL and oscLL and plFound

plot(
	 plFound ? osc[lbR] : na,
	 offset=-lbR,
	 title="Hidden Bullish",
	 linewidth=2,
	 color=(hiddenBullCond ? hiddenBullColor : noneColor),
	 transp=0
	 )

plotshape(
	 hiddenBullCond ? osc[lbR] : na,
	 offset=-lbR,
	 title="Hidden Bullish Label",
	 text=" H Bull ",
	 style=shape.labelup,
	 location=location.absolute,
	 color=bullColor,
	 textcolor=textColor,
	 transp=0
	 )

longCondition=bullCond or hiddenBullCond
//? osc[lbR] : na
//hiddenBullCond
strategy.entry(id="RSIDivLE", long=true,  when=longCondition)


//------------------------------------------------------------------------------
// Regular Bearish

// Osc: Lower High
oscLH = osc[lbR] < valuewhen(phFound, osc[lbR], 1) and _inRange(phFound[1])

// Price: Higher High
priceHH = high[lbR] > valuewhen(phFound, high[lbR], 1)

bearCond = plotBear and priceHH and oscLH and phFound

plot(
	 phFound ? osc[lbR] : na,
	 offset=-lbR,
	 title="Regular Bearish",
	 linewidth=2,
	 color=(bearCond ? bearColor : noneColor),
	 transp=0
	 )

plotshape(
	 bearCond ? osc[lbR] : na,
	 offset=-lbR,
	 title="Regular Bearish Label",
	 text=" Bear ",
	 style=shape.labeldown,
	 location=location.absolute,
	 color=bearColor,
	 textcolor=textColor,
	 transp=0
	 )

//------------------------------------------------------------------------------
// Hidden Bearish

// Osc: Higher High
oscHH = osc[lbR] > valuewhen(phFound, osc[lbR], 1) and _inRange(phFound[1])

// Price: Lower High
priceLH = high[lbR] < valuewhen(phFound, high[lbR], 1)

hiddenBearCond = plotHiddenBear and priceLH and oscHH and phFound

plot(
	 phFound ? osc[lbR] : na,
	 offset=-lbR,
	 title="Hidden Bearish",
	 linewidth=2,
	 color=(hiddenBearCond ? hiddenBearColor : noneColor),
	 transp=0
	 )

plotshape(
	 hiddenBearCond ? osc[lbR] : na,
	 offset=-lbR,
	 title="Hidden Bearish Label",
	 text=" H Bear ",
	 style=shape.labeldown,
	 location=location.absolute,
	 color=bearColor,
	 textcolor=textColor,
	 transp=0
	 )
longCloseCondition=crossover(osc,75) or bearCond
strategy.close(id="RSIDivLE",  when=longCloseCondition)
Detail
https://www.fmz.com/strategy/429963
Last Modified
2023-10-23 17:04:13