
13 KiB
Name
RSI离散分歧策略RSI-Divergence-Strategy
Author
ChaoZhang
Strategy Description
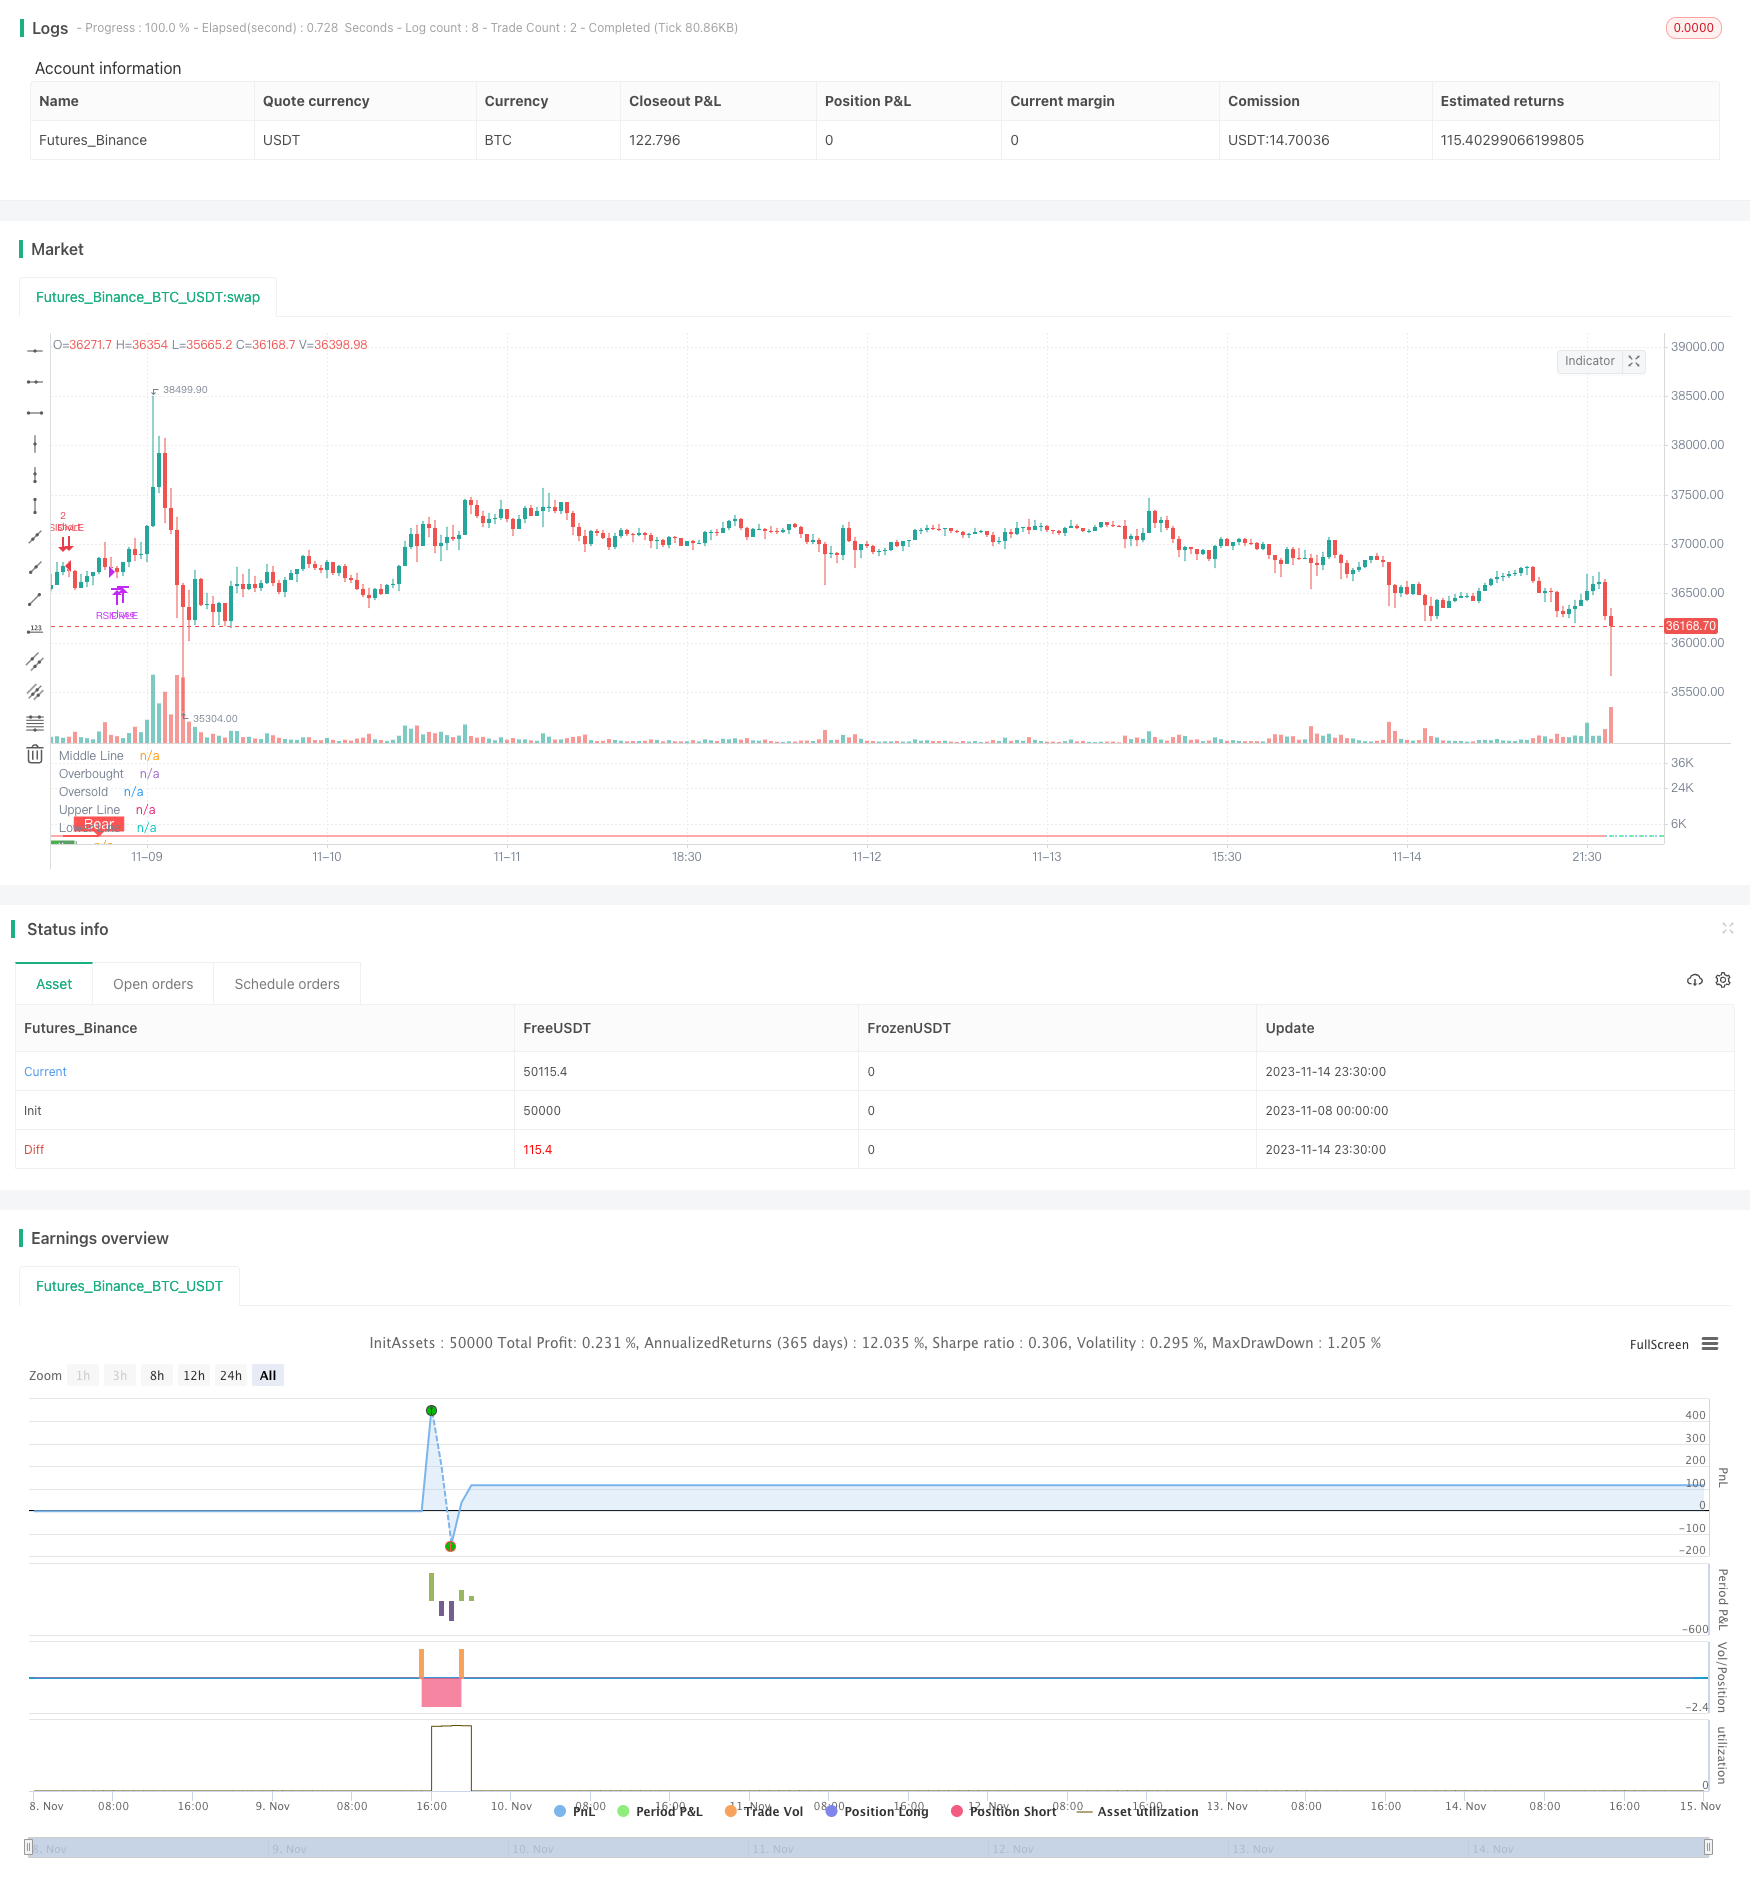 [trans]
概述
该策略通过计算RSI指标及其EMA均线的交叉情况来判断多空,并结合RSI与价格的背离来寻找潜在买卖点,属于趋势跟踪策略。
策略原理
-
计算长度为14的RSI指标,当RSI上穿50分界线时为看多信号,下穿为看空信号。
-
计算RSI的20周期EMA均线及14周期EMA均线,当快线上穿慢线时为买入信号,下穿为卖出信号。
-
检测RSI与价格的背离情况:
-
多头背离:价格创新低但RSI没有创新低,为买入信号
-
隐藏多头背离:价格创新高但RSI没有创新高,为买入信号
-
空头背离:价格创新高但RSI没有创新高,为卖出信号
-
隐藏空头背离:价格创新低但RSI没有创新低,为卖出信号
- 可选择开启止损策略,包括百分比止损和ATR止损。
优势分析
-
RSI指标的优势在于可检测超买超卖情况。EMA均线的优势在于可发挥平滑作用,滤波掉部分噪音。
-
RSI与价格背离可在趋势反转前给出提前信号。
-
整合两种指标信号,可以互相验证,提高策略稳定性。
-
止损机制可控制单笔损失。
风险分析
-
RSI作为一个随价格波动的指数指标,当价格出现剧烈波动时,RSI指标的效用会打折扣。
-
EMA均线存在时间滞后问题,不能准确定位转折点。
-
背离信号可能出现假信号,价格继续原趋势运行的情况。
-
止损点设置不合理可能造成不必要的止损。
-
回撤可能较大,需要充足的资金支持。
优化方向
-
可以测试不同参数对RSI及EMA的计算,寻找最佳参数组合。
-
可以考虑用MACD等其他指标替换EMA均线,进行组合优化。
-
可以设置确认机制,避免出现假背离。如需连续多个背离信号触发。
-
增加止盈策略,以锁定利润。
-
可以基于candlestick模式等短期信号进行入场,配合本策略的趋势判断。
总结
该策略整合了RSI指标的超买超卖判断、EMA的趋势判断和背离信号的预测,形成了一套较为完整的趋势跟踪体系。在参数调整和组合优化的基础上,可以获得较好的策略效果。但仍需要注意防范趋势市的冲击和假信号的干扰。通过严格的资金管理,该策略可以在中长线上获得稳定的超额收益。
||
Overview
This strategy determines long and short positions by calculating RSI indicator and crossovers between RSI EMA lines, combined with divergences between RSI and price to find potential trading signals. It belongs to trend following strategies.
Strategy Logic
-
Calculate 14-period RSI indicator, RSI crossing above 50 is buy signal and crossing below 50 is sell signal.
-
Calculate 20-period EMA and 14-period EMA of RSI, fast EMA crossing above slow EMA is buy signal and crossing below is sell signal.
-
Detect divergences between RSI and price:
-
Regular bullish divergence: price makes new low but RSI does not, buy signal
-
Hidden bullish divergence: price makes new high but RSI does not, buy signal
-
Regular bearish divergence: price makes new high but RSI does not, sell signal
-
Hidden bearish divergence: price makes new low but RSI does not, sell signal
- Stop loss strategies can be enabled, including percentage-based and ATR-based.
Advantage Analysis
-
RSI indicator is good at detecting overbought and oversold situations. EMAs can smooth out noise in data.
-
Divergences between RSI and price can provide early reversal signals.
-
Combining signals from two indicators can validate each other and improve strategy stability.
-
Stop loss mechanisms control single trade loss.
Risk Analysis
-
As a momentum indicator, RSI may underperform when price fluctuates violently.
-
EMAs have time lag and cannot precisely locate turning points.
-
Divergence signals may produce false signals when trend continues.
-
Improper stop loss setting may cause unnecessary loss.
-
Drawdown can be large, sufficient capital is needed.
Optimization Directions
-
Test different parameters for RSI and EMA calculation to find optimal combinations.
-
Consider replacing EMA with other indicators like MACD for ensemble optimization.
-
Add confirmation mechanisms to avoid false divergences, e.g. requiring consecutive signals.
-
Add profit taking strategies to lock in gains.
-
Incorporate short-term signals like candlestick patterns for entry, combined with trend judgment of this strategy.
Summary
This strategy integrates overbought/oversold detection of RSI, trend following with EMA, and reversal prediction of divergences into a systematic trend tracking system. With parameter tuning and ensemble optimization, good results can be achieved. But risks like trend shocks and false signals should be guarded against. With proper money management, this strategy can produce steady excess returns in medium-to-long term.
[/trans]
Strategy Arguments
| Argument | Default | Description |
|---|---|---|
| v_input_1 | 14 | RSI Period |
| v_input_2_close | 0 | RSI Source: close |
| v_input_3 | 3 | Pivot Lookback Right |
| v_input_4 | true | Pivot Lookback Left |
| v_input_5 | 80 | Take Profit at RSI Level |
| v_input_6 | 60 | Max of Lookback Range |
| v_input_7 | 5 | Min of Lookback Range |
| v_input_8 | true | Plot Bullish |
| v_input_9 | true | Plot Hidden Bullish |
| v_input_10 | true | Plot Bearish |
| v_input_11 | false | Plot Hidden Bearish |
| v_input_12 | 0 | Trailing StopLoss Type: NONE |
| v_input_13 | 5 | Stop Loss% |
| v_input_14 | 14 | ATR Length (for Trailing stop loss) |
| v_input_15 | 3.5 | ATR Multiplier (for Trailing stop loss) |
| v_input_16 | 14 | RSI Length |
| v_input_17 | 20 | EMA of RSI Length |
| v_input_18 | 14 | Fast EMA |
Source (PineScript)
/*backtest
start: 2023-11-08 00:00:00
end: 2023-11-15 00:00:00
period: 30m
basePeriod: 15m
exchanges: [{"eid":"Futures_Binance","currency":"BTC_USDT"}]
*/

//@version=4
strategy(title="RSI Divergence Indicator", overlay=false,pyramiding=2, default_qty_value=2,   default_qty_type=strategy.fixed, initial_capital=10000, currency=currency.USD)

len = input(title="RSI Period", minval=1, defval=14)
src = input(title="RSI Source", defval=close)
lbR = input(title="Pivot Lookback Right", defval=3)
lbL = input(title="Pivot Lookback Left", defval=1)
takeProfitRSILevel = input(title="Take Profit at RSI Level", minval=70, defval=80)

rangeUpper = input(title="Max of Lookback Range", defval=60)
rangeLower = input(title="Min of Lookback Range", defval=5)
plotBull = input(title="Plot Bullish", defval=true)
plotHiddenBull = input(title="Plot Hidden Bullish", defval=true)
plotBear = input(title="Plot Bearish", defval=true)
plotHiddenBear = input(title="Plot Hidden Bearish", defval=false)

sl_type = input("NONE", title="Trailing StopLoss Type", options=['ATR','PERC', 'NONE'])

stopLoss = input(title="Stop Loss%", defval=5, minval=1)

atrLength=input(14, title="ATR Length (for Trailing stop loss)")
atrMultiplier=input(3.5, title="ATR Multiplier (for Trailing stop loss)")


bearColor = color.red
bullColor = color.green
hiddenBullColor = color.new(color.green, 80)
hiddenBearColor = color.new(color.red, 80)
textColor = color.white
noneColor = color.new(color.white, 100)

osc = rsi(src, len)

plot(osc, title="RSI", linewidth=2, color=color.white)
hline(50, title="Middle Line", linestyle=hline.style_dotted)
obLevel = hline(70, title="Overbought", linestyle=hline.style_dotted)
osLevel = hline(30, title="Oversold", linestyle=hline.style_dotted)
fill(obLevel, osLevel, title="Background", color=color.gray, transp=90)

plFound = na(pivotlow(osc, lbL, lbR)) ? false : true
phFound = na(pivothigh(osc, lbL, lbR)) ? false : true

_inRange(cond) =>
    bars = barssince(cond == true)
    rangeLower <= bars and bars <= rangeUpper

//------------------------------------------------------------------------------
// Regular Bullish

// Osc: Higher Low
oscHL = osc[lbR] > valuewhen(plFound, osc[lbR], 1) and _inRange(plFound[1])

// Price: Lower Low
priceLL = low[lbR] < valuewhen(plFound, low[lbR], 1)

bullCond = plotBull and priceLL and oscHL and plFound

plot(
	 plFound ? osc[lbR] : na,
	 offset=-lbR,
	 title="Regular Bullish",
	 linewidth=2,
	 color=(bullCond ? bullColor : noneColor),
	 transp=0
	 )


plotshape(
	 bullCond ? osc[lbR] : na,
	 offset=-lbR,
	 title="Regular Bullish Label",
	 text=" Bull ",
	 style=shape.labelup,
	 location=location.absolute,
	 color=bullColor,
	 textcolor=textColor,
	 transp=0
	 )

//------------------------------------------------------------------------------
// Hidden Bullish

// Osc: Lower Low
oscLL = osc[lbR] < valuewhen(plFound, osc[lbR], 1) and _inRange(plFound[1])

// Price: Higher Low
priceHL = low[lbR] > valuewhen(plFound, low[lbR], 1)

hiddenBullCond = plotHiddenBull and priceHL and oscLL and plFound

plot(
	 plFound ? osc[lbR] : na,
	 offset=-lbR,
	 title="Hidden Bullish",
	 linewidth=2,
	 color=(hiddenBullCond ? hiddenBullColor : noneColor),
	 transp=0
	 )

plotshape(
	 hiddenBullCond ? osc[lbR] : na,
	 offset=-lbR,
	 title="Hidden Bullish Label",
	 text=" H Bull ",
	 style=shape.labelup,
	 location=location.absolute,
	 color=bullColor,
	 textcolor=textColor,
	 transp=0
	 )

longCondition=bullCond or hiddenBullCond
//? osc[lbR] : na
//hiddenBullCond
strategy.entry(id="RSIDivLE", long=true,  when=longCondition)


//Trailing StopLoss
////// Calculate trailing SL
/////////////////////////////////////////////////////
sl_val = sl_type == "ATR"      ? stopLoss * atr(atrLength) :
         sl_type == "PERC" ? close * stopLoss / 100 : 0.00

trailing_sl = 0.0
trailing_sl :=   strategy.position_size>=1 ?  max(low  - sl_val, nz(trailing_sl[1])) :  na

//draw initil stop loss
//plot(strategy.position_size>=1 ? trailing_sl : na, color = color.blue , style=plot.style_linebr,  linewidth = 2, title = "stop loss")
//plot(trailing_sl, title="ATR Trailing Stop Loss", style=plot.style_linebr, linewidth=1, color=color.purple, transp=30)
//Trailing StopLoss
////// Calculate trailing SL
/////////////////////////////////////////////////////


//------------------------------------------------------------------------------
// Regular Bearish

// Osc: Lower High
oscLH = osc[lbR] < valuewhen(phFound, osc[lbR], 1) and _inRange(phFound[1])

// Price: Higher High
priceHH = high[lbR] > valuewhen(phFound, high[lbR], 1)

bearCond = plotBear and priceHH and oscLH and phFound

plot(
	 phFound ? osc[lbR] : na,
	 offset=-lbR,
	 title="Regular Bearish",
	 linewidth=2,
	 color=(bearCond ? bearColor : noneColor),
	 transp=0
	 )

plotshape(
	 bearCond ? osc[lbR] : na,
	 offset=-lbR,
	 title="Regular Bearish Label",
	 text=" Bear ",
	 style=shape.labeldown,
	 location=location.absolute,
	 color=bearColor,
	 textcolor=textColor,
	 transp=0
	 )

//------------------------------------------------------------------------------
// Hidden Bearish

// Osc: Higher High
oscHH = osc[lbR] > valuewhen(phFound, osc[lbR], 1) and _inRange(phFound[1])

// Price: Lower High
priceLH = high[lbR] < valuewhen(phFound, high[lbR], 1)

hiddenBearCond = plotHiddenBear and priceLH and oscHH and phFound

plot(
	 phFound ? osc[lbR] : na,
	 offset=-lbR,
	 title="Hidden Bearish",
	 linewidth=2,
	 color=(hiddenBearCond ? hiddenBearColor : noneColor),
	 transp=0
	 )

plotshape(
	 hiddenBearCond ? osc[lbR] : na,
	 offset=-lbR,
	 title="Hidden Bearish Label",
	 text=" H Bear ",
	 style=shape.labeldown,
	 location=location.absolute,
	 color=bearColor,
	 textcolor=textColor,
	 transp=0
	 )
longCloseCondition=crossover(osc,takeProfitRSILevel) or bearCond
strategy.close(id="RSIDivLE", comment="Close All="+tostring(close - strategy.position_avg_price, "####.##"), when= abs(strategy.position_size)>=1  and  sl_type == "NONE" and longCloseCondition)

//close all on stop loss
strategy.close(id="RSIDivLE", comment="TSL="+tostring(close - strategy.position_avg_price, "####.##"),  when=abs(strategy.position_size)>=1 and (sl_type == "PERC"   or sl_type == "ATR" ) and crossunder(close, trailing_sl)  )  //close<ema55 and rsi5Val<20 //ema34<ema55  //close<ema89

src1 = close,
len6 = input(14, minval=1, title="RSI Length")
len7 = input(20, minval=1, title="EMA of RSI Length")
len8 = input(14,minval=1, title="Fast EMA")
up = rma(max(change(src1), 0), len6)
down = rma(-min(change(src1), 0), len6)
rsi = down == 0 ? 100 : up == 0 ? 0 : 100 - (100 / (1 + up / down))
emaRSI = ema(rsi,len7)
fastEmaRSI=ema(rsi,len8)

plot(emaRSI, title="EMA of RSI", linewidth=1, color=color.red)
plot(fastEmaRSI,title="Fast EMA of RSI", linewidth=1,color = color.lime)
band1 = hline(80, title="Upper Line", linewidth=1, color=color.red)
band0 = hline(20, title="Lower Line", linewidth=1, color=color.lime)
fill(band1, band0, color=color.purple)
Detail
https://www.fmz.com/strategy/432315
Last Modified
2023-11-16 11:36:45