
6.6 KiB
Name
RSI回调突破策略RSI-Pullback-Breakout-Strategy
Author
ChaoZhang
Strategy Description
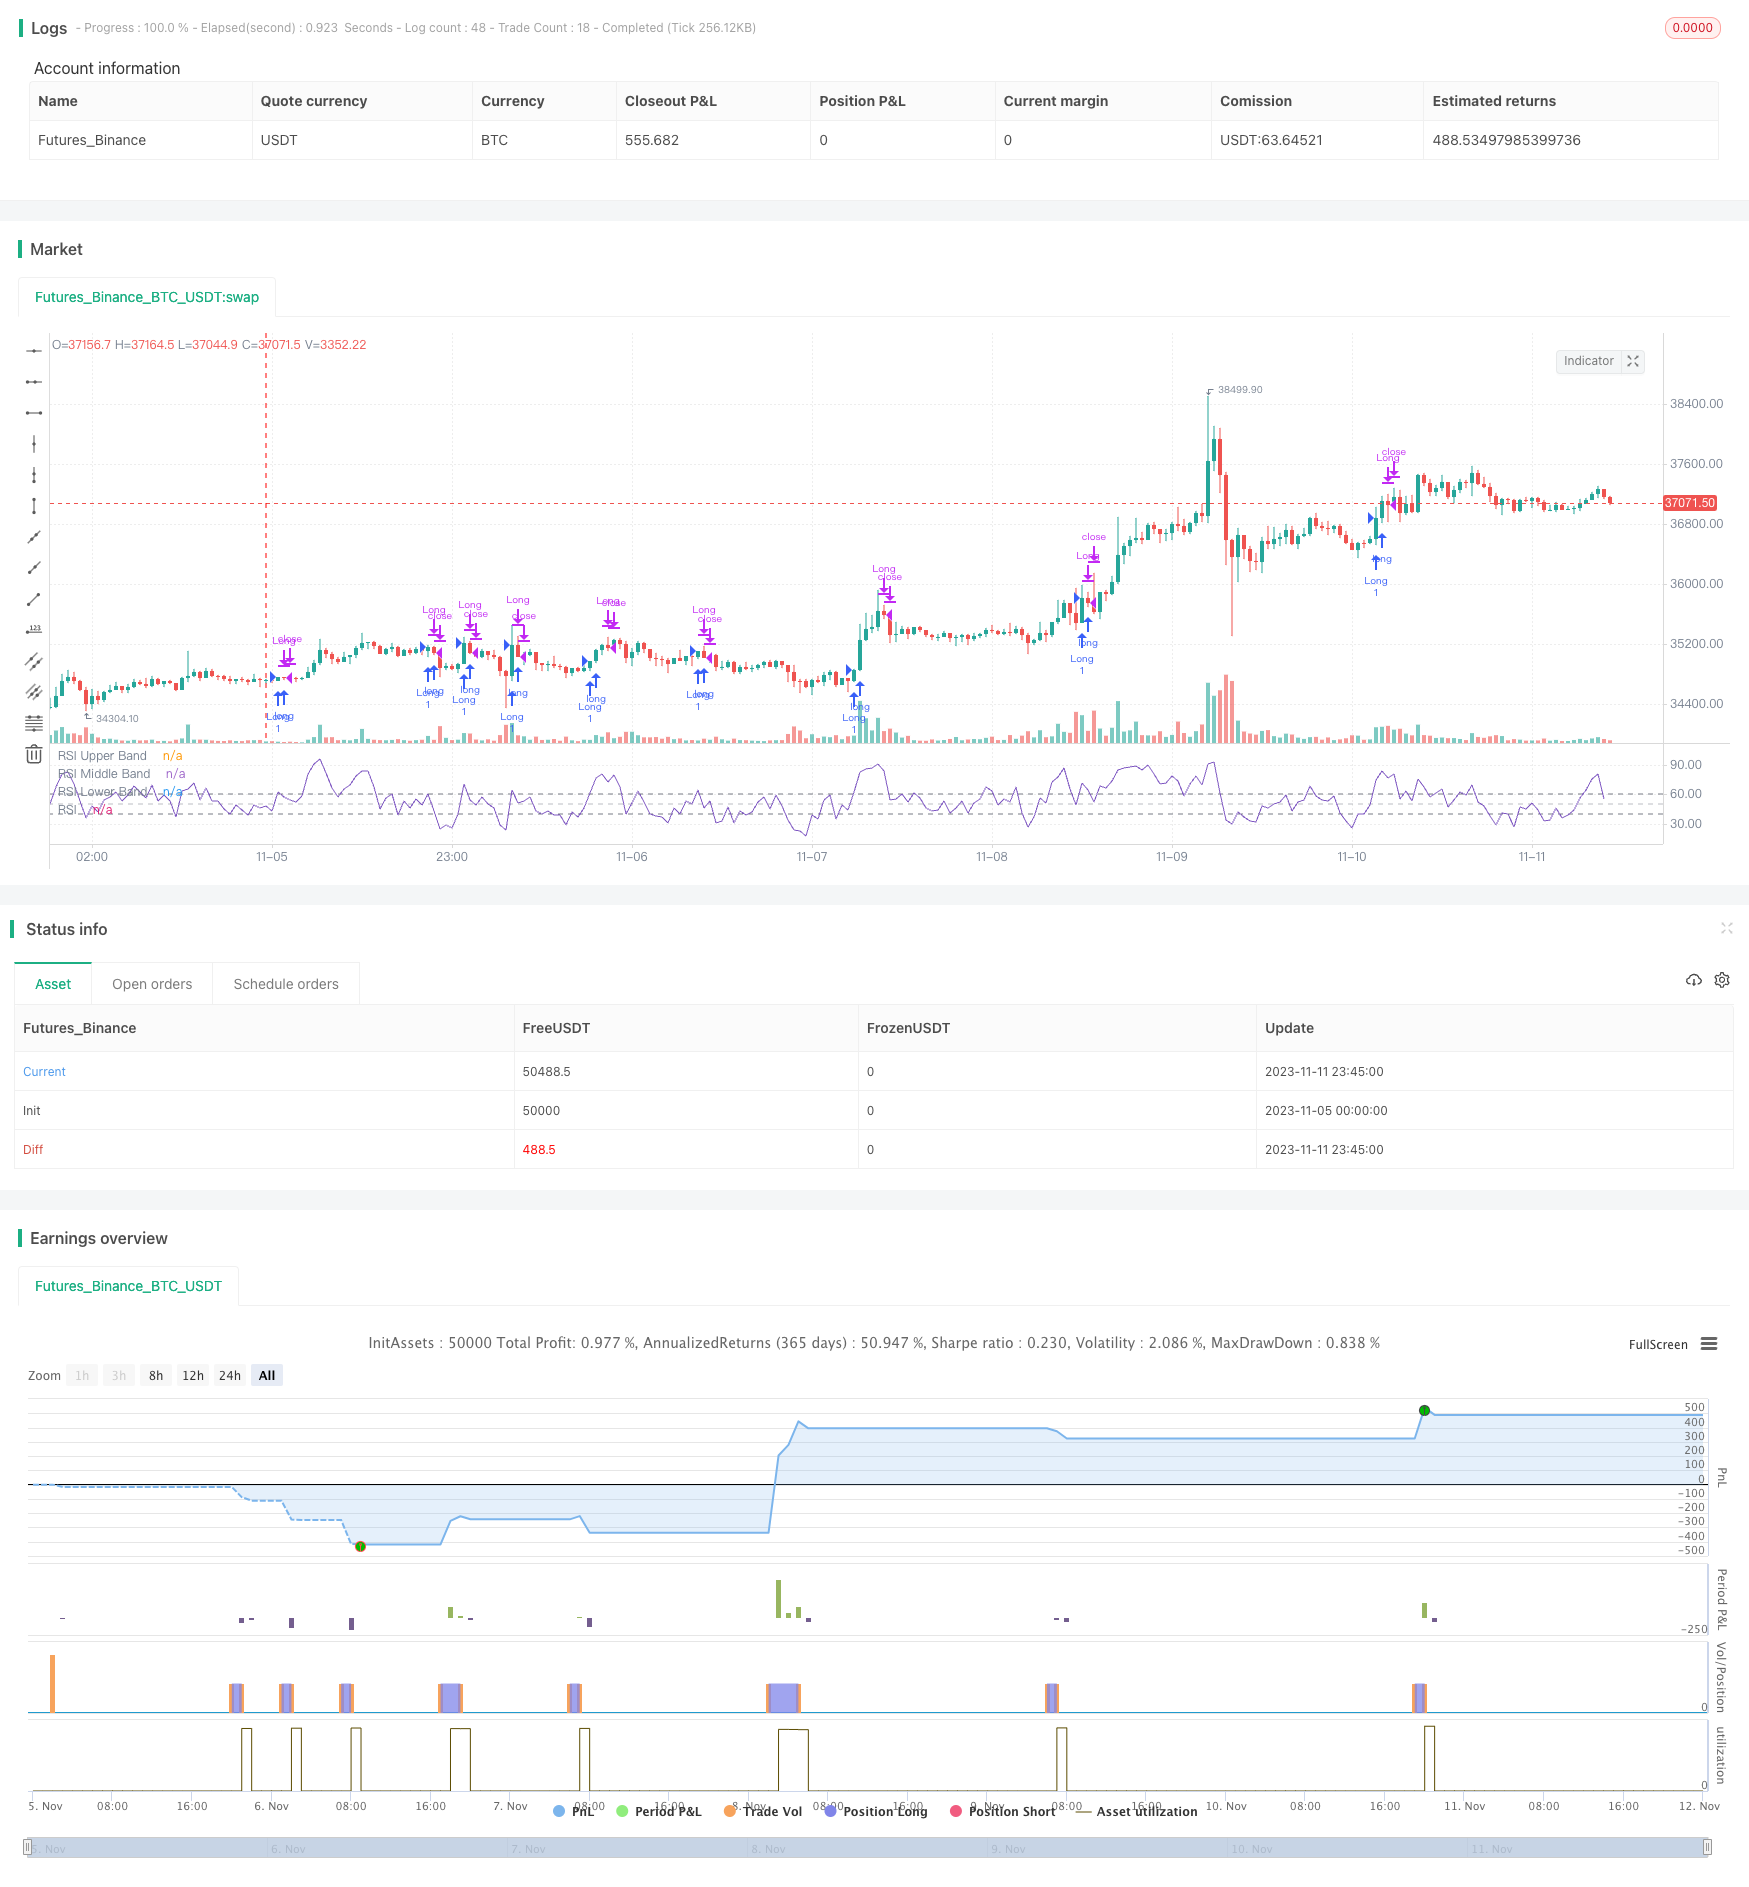 [trans]
概述
RSI回调突破策略是一种基于相对强弱指标(RSI)的短线交易策略。该策略利用RSI指标识别过卖超跌机会,在股价超跌回调时,寻找RSI指标由低位向上突破进场的机会,通过捕捉股价短线反弹获得盈利。
策略原理
该策略基于RSI指标来判断买入时机。具体逻辑是:
-
使用length=5的RSI指标,当RSI由低位向上突破60时视为买入信号。
-
RSI突破60代表股票短期内超跌比较严重,表现为弱势股,此时RSI上穿60有望代表股价产生反弹。
-
在RSI突破60时开仓做多,采用市价单全仓买入。
-
当RSI再次下破其前一周期值时视为退出信号,即RSI < RSI[1],发出平仓指令。
该策略主要依靠RSI指标识别短线超跌回调机会,通过捕捉反弹获得盈利。当股价连续下跌导致RSI进入超卖区时,通过RSI指标的回调突破来判断反弹的时机。
优势分析
该策略具有以下优势:
-
策略思路简单清晰,容易理解实现,适合新手学习;
-
利用的是成熟指标RSI,有一定的实用性;
-
采用RSI回调突破判断买点,可以 filtrate 出某些超跌反弹机会;
-
策略操作频率较高,适合短线交易,可以捕捉短期价格剧烈波动;
-
策略风险可控,采用止损方式来控制亏损。
风险分析
该策略也存在一些风险:
-
RSI指标存在一定程度的滞后性,可能导致买入点出现偏差;
-
股价反弹不一定持续,存在回调再次跌破止损点的可能;
-
交易频率较高,交易成本可能会比较高;
-
策略参数需要不断优化,如RSI长度、买入条件等;
-
多空判断依据单一,当市场持续上行时,策略可能会产生过多错误信号。
优化方向
该策略还可以从以下几个方向进行优化:
-
结合趋势指标过滤,避免在震荡行情中被套。
-
加入机器学习模型进行多因子预测,提高买入精确度。
-
优化止损策略,通过移动止损来锁定更多利润。
-
适当调整持仓时间,区分长线和短线持仓。
-
增加波动率过滤,只在大幅波动时才考虑买入。
总结
本策略整体来说较为简单直接,通过RSI指标的回调突破来判断买入时机。策略具有一定实用性,可用于发现短线超跌反弹机会。但RSI指标本身存在滞后性,多空判断单一等问题。后续可通过多因子预测、止损优化、趋势过滤等方式提升策略效果。
||
Overview
The RSI pullback breakout strategy is a short-term trading strategy based on the Relative Strength Index (RSI) indicator. It identifies oversold pullback opportunities by looking for RSI breakouts on the upside after the price has declined sharply, aiming to capture rebounds for profits.
Strategy Logic
The strategy determines entry signals based on the RSI indicator. The specific logic is:
-
Use RSI with a length of 5. A breakout above 60 on the RSI is considered a buy signal.
-
The RSI breaking above 60 represents the stock has declined significantly in the short term, performing weakly. The RSI crossing above 60 may signal a price bounce.
-
When RSI breaks through 60, open a long position using market orders.
-
When RSI falls back below its value from the previous period, i.e. RSI < RSI[1], it is considered an exit signal to close positions.
The strategy mainly relies on RSI to identify short-term oversold pullback opportunities, capturing rebounds for profits. It uses RSI pullbacks to determine timing of rebounds after successive price declines have pushed RSI into oversold levels.
Advantage Analysis
The advantages of this strategy include:
-
The logic is simple and clear, easy to understand and implement, suitable for beginners.
-
It uses the mature RSI indicator, providing some practical utility.
-
RSI pullback breakouts help identify some oversold bounce opportunities.
-
High trading frequency allows capturing short-term price swings.
-
Controllable risk due to use of stop losses.
Risk Analysis
There are also some risks:
-
RSI has some lag, which may cause inaccurate entry signals.
-
Price bounces may not sustain and could re-break stop loss levels.
-
High trading frequency leads to possibly high transaction costs.
-
Parameters like RSI length, entry criteria need continuous optimization.
-
Singular long/short basis means too many false signals in persistent uptrend/downtrend.
Enhancement Opportunities
Some ways to enhance the strategy:
-
Add trend filter to avoid whipsaws in range-bound periods.
-
Incorporate machine learning models for multifactor prediction to improve entry accuracy.
-
Optimize stop loss for locking in more profits using trailing stops.
-
Adjust holding period for long-term vs short-term holdings.
-
Add volatility filter to only consider buying after sharp declines.
Summary
The strategy is relatively simple and direct, using RSI pullback breakouts to determine entries. It has some practical utility in identifying short-term oversold bounces. However, inherent lag in RSI and singular long/short basis are issues. Enhancements like multifactor prediction, stop loss optimization, trend filters can improve strategy performance.
[/trans]
Strategy Arguments
| Argument | Default | Description |
|---|---|---|
| v_input_1 | 5 | RSI Length |
Source (PineScript)
/*backtest
start: 2023-11-05 00:00:00
end: 2023-11-12 00:00:00
period: 45m
basePeriod: 5m
exchanges: [{"eid":"Futures_Binance","currency":"BTC_USDT"}]
*/

//@version=5
strategy("*RSI 5 - Long only- Daily charts & above*", overlay = false)

// Define inputs
rsi_length = input(5, "RSI Length")

// Calculate indicators
rsi = ta.rsi(close, rsi_length)

// Entry conditions
long = rsi[1] < 50 and rsi > 60

// Exit conditions
longExit = rsi < rsi[1]


// Execute trade with adjusted position size
if (long)
    strategy.entry("Long", strategy.long)


if  (longExit)
	strategy.close("LongExit")


// Close long position if long exit condition is met
if (longExit)
    strategy.close("Long", comment="Long exit")

rsiPlot = plot(rsi, "RSI", color=#7E57C2)
rsiUpperBand = hline(60, "RSI Upper Band", color=#787B86)
midline = hline(50, "RSI Middle Band", color=color.new(#787B86, 50))
rsiLowerBand = hline(40, "RSI Lower Band", color=#787B86)
fill(rsiUpperBand, rsiLowerBand, color=color.rgb(126, 87, 194, 90), title="RSI Background Fill")
Detail
https://www.fmz.com/strategy/431889
Last Modified
2023-11-13 10:15:48