
6.7 KiB
Name
RSI双叉反转策略RSI-Dual-Cross-Reversal-Strategy
Author
ChaoZhang
Strategy Description
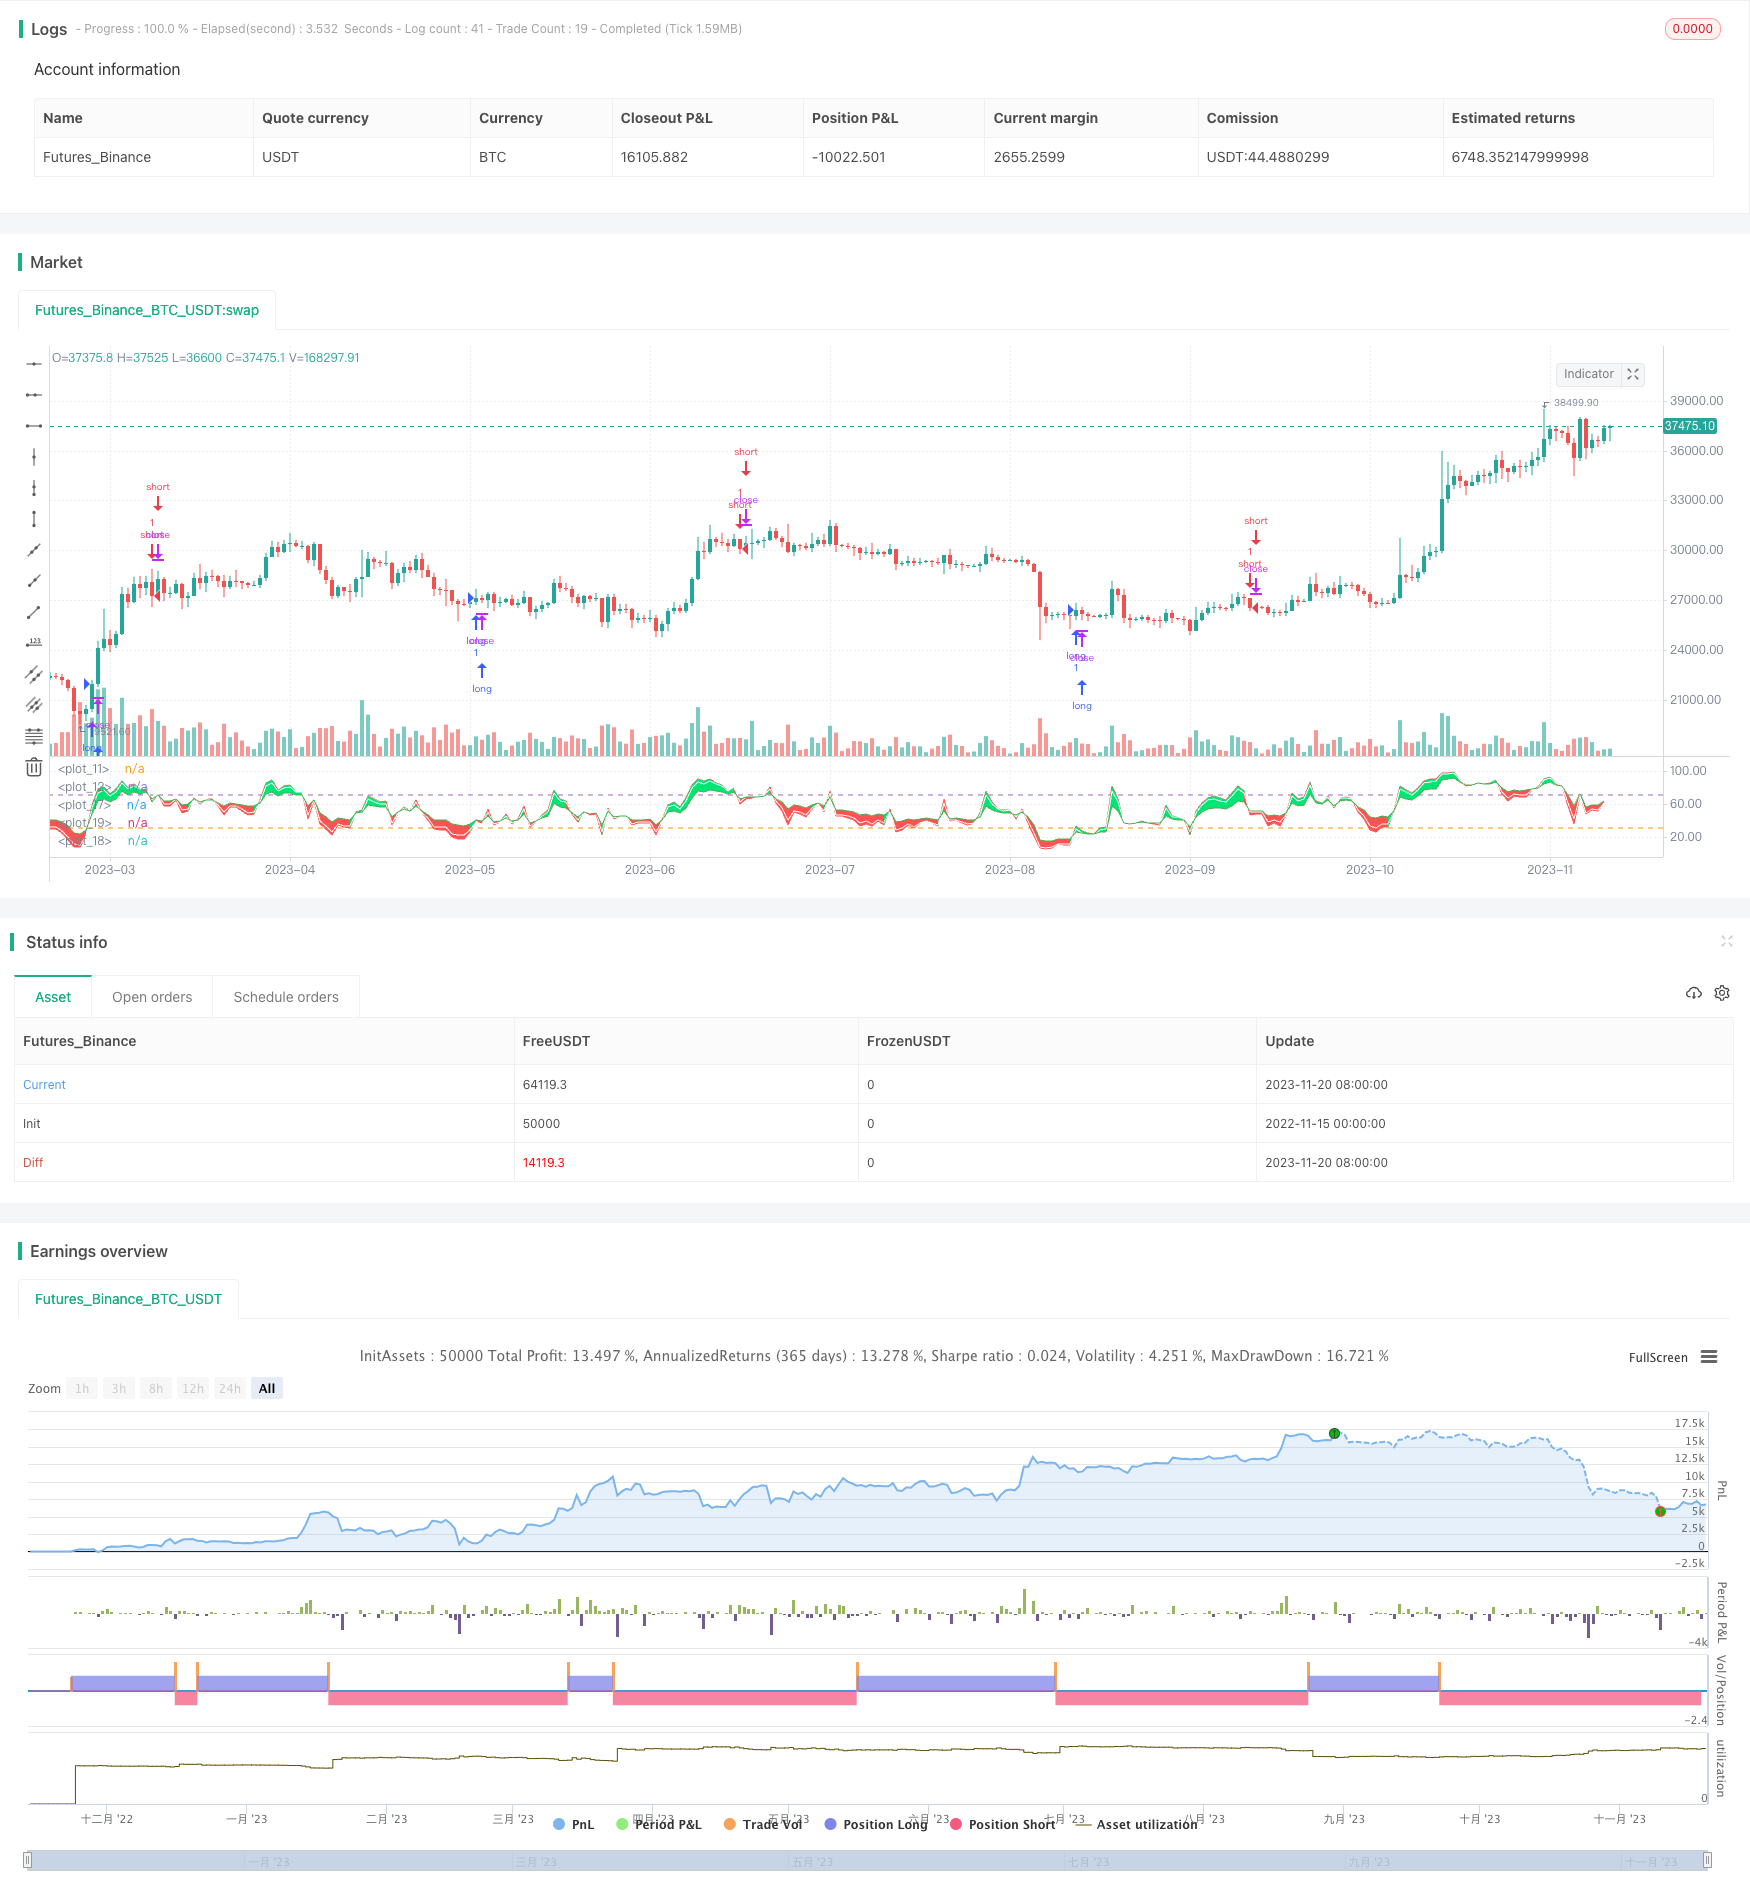
[trans]
概述
该策略是基于RSI指标的双叉反转原理制定的趋势追踪策略。它使用不同周期的RSI线交叉作为买入和卖出信号,同时结合RSI指标判断目前是否处于超买或超卖状态,进一步确认交易信号的有效性。
策略原理
该策略主要基于5日和11日两条RSI指标线。当 faster RSI(5日线)从下向上突破slower RSI(11日线)而且同时6日RSI低于30时,产生买入信号;当faster RSI 从上向下跌破slower RSI 而且同时6日RSI高于70时,产生卖出信号。
该策略同时绘制出30和70水平线。30代表超卖区域,70代表超买区域。RSI指标的基本思想就是当处于超买超卖区域时,代表资产被高估,应当考虑获利了结或等待回调机会;当RSI处于超卖区域时,代表资产被低估,应当考虑买入建立多头头寸。所以该策略加入6日RSI判断是否处于超买超卖区域,可过滤掉一些假信号,提高信号的可靠性。
在产生买入和卖出信号时,该策略会分别下单做多和做空。所以它是一个双向交易策略,既可跟踪上涨趋势,也可跟踪下跌趋势。
策略优势
- 使用双叉原理,可靠性较高
- 结合不同周期RSI判断,避免假信号
- 可双向交易,适合跟踪市场趋势
- RSI指标性能稳定,参数优化空间大
风险及解决方案
-
双叉信号滞后,可能错过部分涨跌
解决方法:适当缩短faster RSI的周期参数,使信号更加灵敏 -
趋势市场中可能出现较多假信号
解决方法:调整超买超卖判断区域的参数,避免趋势市场的假信号 -
RSI指标发散或失效的概率
解决方法:与其他指标组合使用,避免RSI单一失效的概率
优化方向
-
周期参数优化:调整更快速和更慢速RSI的周期参数,寻找最佳参数组合
-
超买超卖参数优化:调整超买超卖判断区域的参数,提高信号准确率
-
与其他指标组合:组合移动平均线或波动率指标等,形成综合交易系统
总结
本策略基于RSI双叉反转思路,是一种较为可靠的趋势跟踪策略。它使用多周期RSI判断,可避免一定的假信号,从而具有较高的实战效果。通过参数优化和指标组合,该策略可望获得更出色的表现。总体来说,该策略思路清晰,实用性强,值得重点关注和后续优化。
||
Overview
This strategy is a trend following strategy based on the dual cross reversal principle of the RSI indicator. It uses crossovers between RSI lines of different periods as buy and sell signals, while also incorporating RSI indicator judgments on whether the current situation is overbought or oversold to further confirm the validity of trading signals.
Strategy Logic
The strategy is mainly based on the 5-day and 11-day two RSI indicator lines. When the faster RSI (5-day line) breaks through the slower RSI (11-day line) upward while the 6-day RSI is below 30 at the same time, a buy signal is generated; When the faster RSI breaks through the slower RSI downward while the 6-day RSI is above 70 at the same time, a sell signal is generated.
The strategy also draws 30 and 70 horizontal lines, with 30 representing the oversold area and 70 representing the overbought area. The basic idea of the RSI indicator is that when in the overbought/oversold area, it means the asset is over/under valued and one should consider taking profit/buying opportunities. Therefore, the strategy incorporates judgments on the 6-day RSI to see if it is in the OBOS region to filter out some false signals and improve reliability.
When buy and sell signals are generated, the strategy will place long and short orders accordingly. So it is a dual directional trading strategy that can track both uptrends and downtrends.
Advantages
- High reliability due to dual cross principle
- Avoid false signals by incorporating multi-period RSI
- Dual directional trading suitable for trend following
- RSI indicator is stable with large optimization space
Risks and Solutions
-
Dual cross signals lag and may miss some ups and downs
Solution: Shorten faster RSI period parameter to make signals more sensitive -
More false signals may occur in trending markets
Solution: Adjust OBOS parameter to avoid false signals in trends -
Divergence or failure probabilities of RSI indicator
Solution: Combine with other indicators to avoid sole failure probability
Optimization Directions
-
Period parameter optimization: Adjust faster and slower RSI periods, find best combination
-
OBOS parameter optimization: Adjust OBOS parameters to improve signal accuracy
-
Combine with other indicators: Incorporate MA, volatility indicators etc to form comprehensive system
Conclusion
This strategy is a reliable trend following strategy based on the RSI dual cross reversal logic. Its multi-period RSI design can avoid certain false signals and thus has good practical results. Through parameter optimization and indicator combinations, the strategy has potential for even better performance. In summary, the strategy has clear logic and strong practicality, and is worth key attention and further optimization.
[/trans]
Strategy Arguments
| Argument | Default | Description |
|---|---|---|
| v_input_1 | 5 | MA 1 |
| v_input_2 | 11 | MA 1 |
| v_input_3 | 6 | MA 1 |
Source (PineScript)
/*backtest
start: 2022-11-15 00:00:00
end: 2023-11-21 00:00:00
period: 1d
basePeriod: 1h
exchanges: [{"eid":"Futures_Binance","currency":"BTC_USDT"}]
*/

// This source code is subject to the terms of the Mozilla Public License 2.0 at https://mozilla.org/MPL/2.0/
// © email_analysts
// This code gives indication on the chart to go long or short based on RSI crossover strategy.
//Default value has been taken as 5 and 11, with 6 being used to identify highs & lows.
//@version=4
strategy("RSITrendStrategy", overlay=false)
len1 = input(title="MA 1", defval = 5)
len2 = input(title="MA 1", defval = 11)
len3 = input(title="MA 1", defval = 6)

h1 = hline(30.)
h2 = hline(70.)
///fill(h1, h2, color = color.new(color.blue, 80))
sh = rsi(close, len1)
ln = rsi(close, len2)
rs = rsi(close, len3)
p1 = plot(sh, color = color.red)
p2 = plot(ln, color = color.green)
p3 = plot(rs, color = color.white)

mycol = sh > ln ? color.lime : color.red
fill(p1, p2, color = mycol)

buy = (sh[1] < ln[1] and sh > ln and rs[1] < 30)
if (buy)
    strategy.entry("long", strategy.long)

sell = (sh[1] > ln[1] and sh < ln and rs[1] > 70)
if (sell)
    strategy.entry("short", strategy.short)
Detail
https://www.fmz.com/strategy/432885
Last Modified
2023-11-22 14:59:07