
11 KiB
Name
Momentum-Alpha策略Momentum-Alpha-Strategy
Author
ChaoZhang
Strategy Description
[trans]
概述
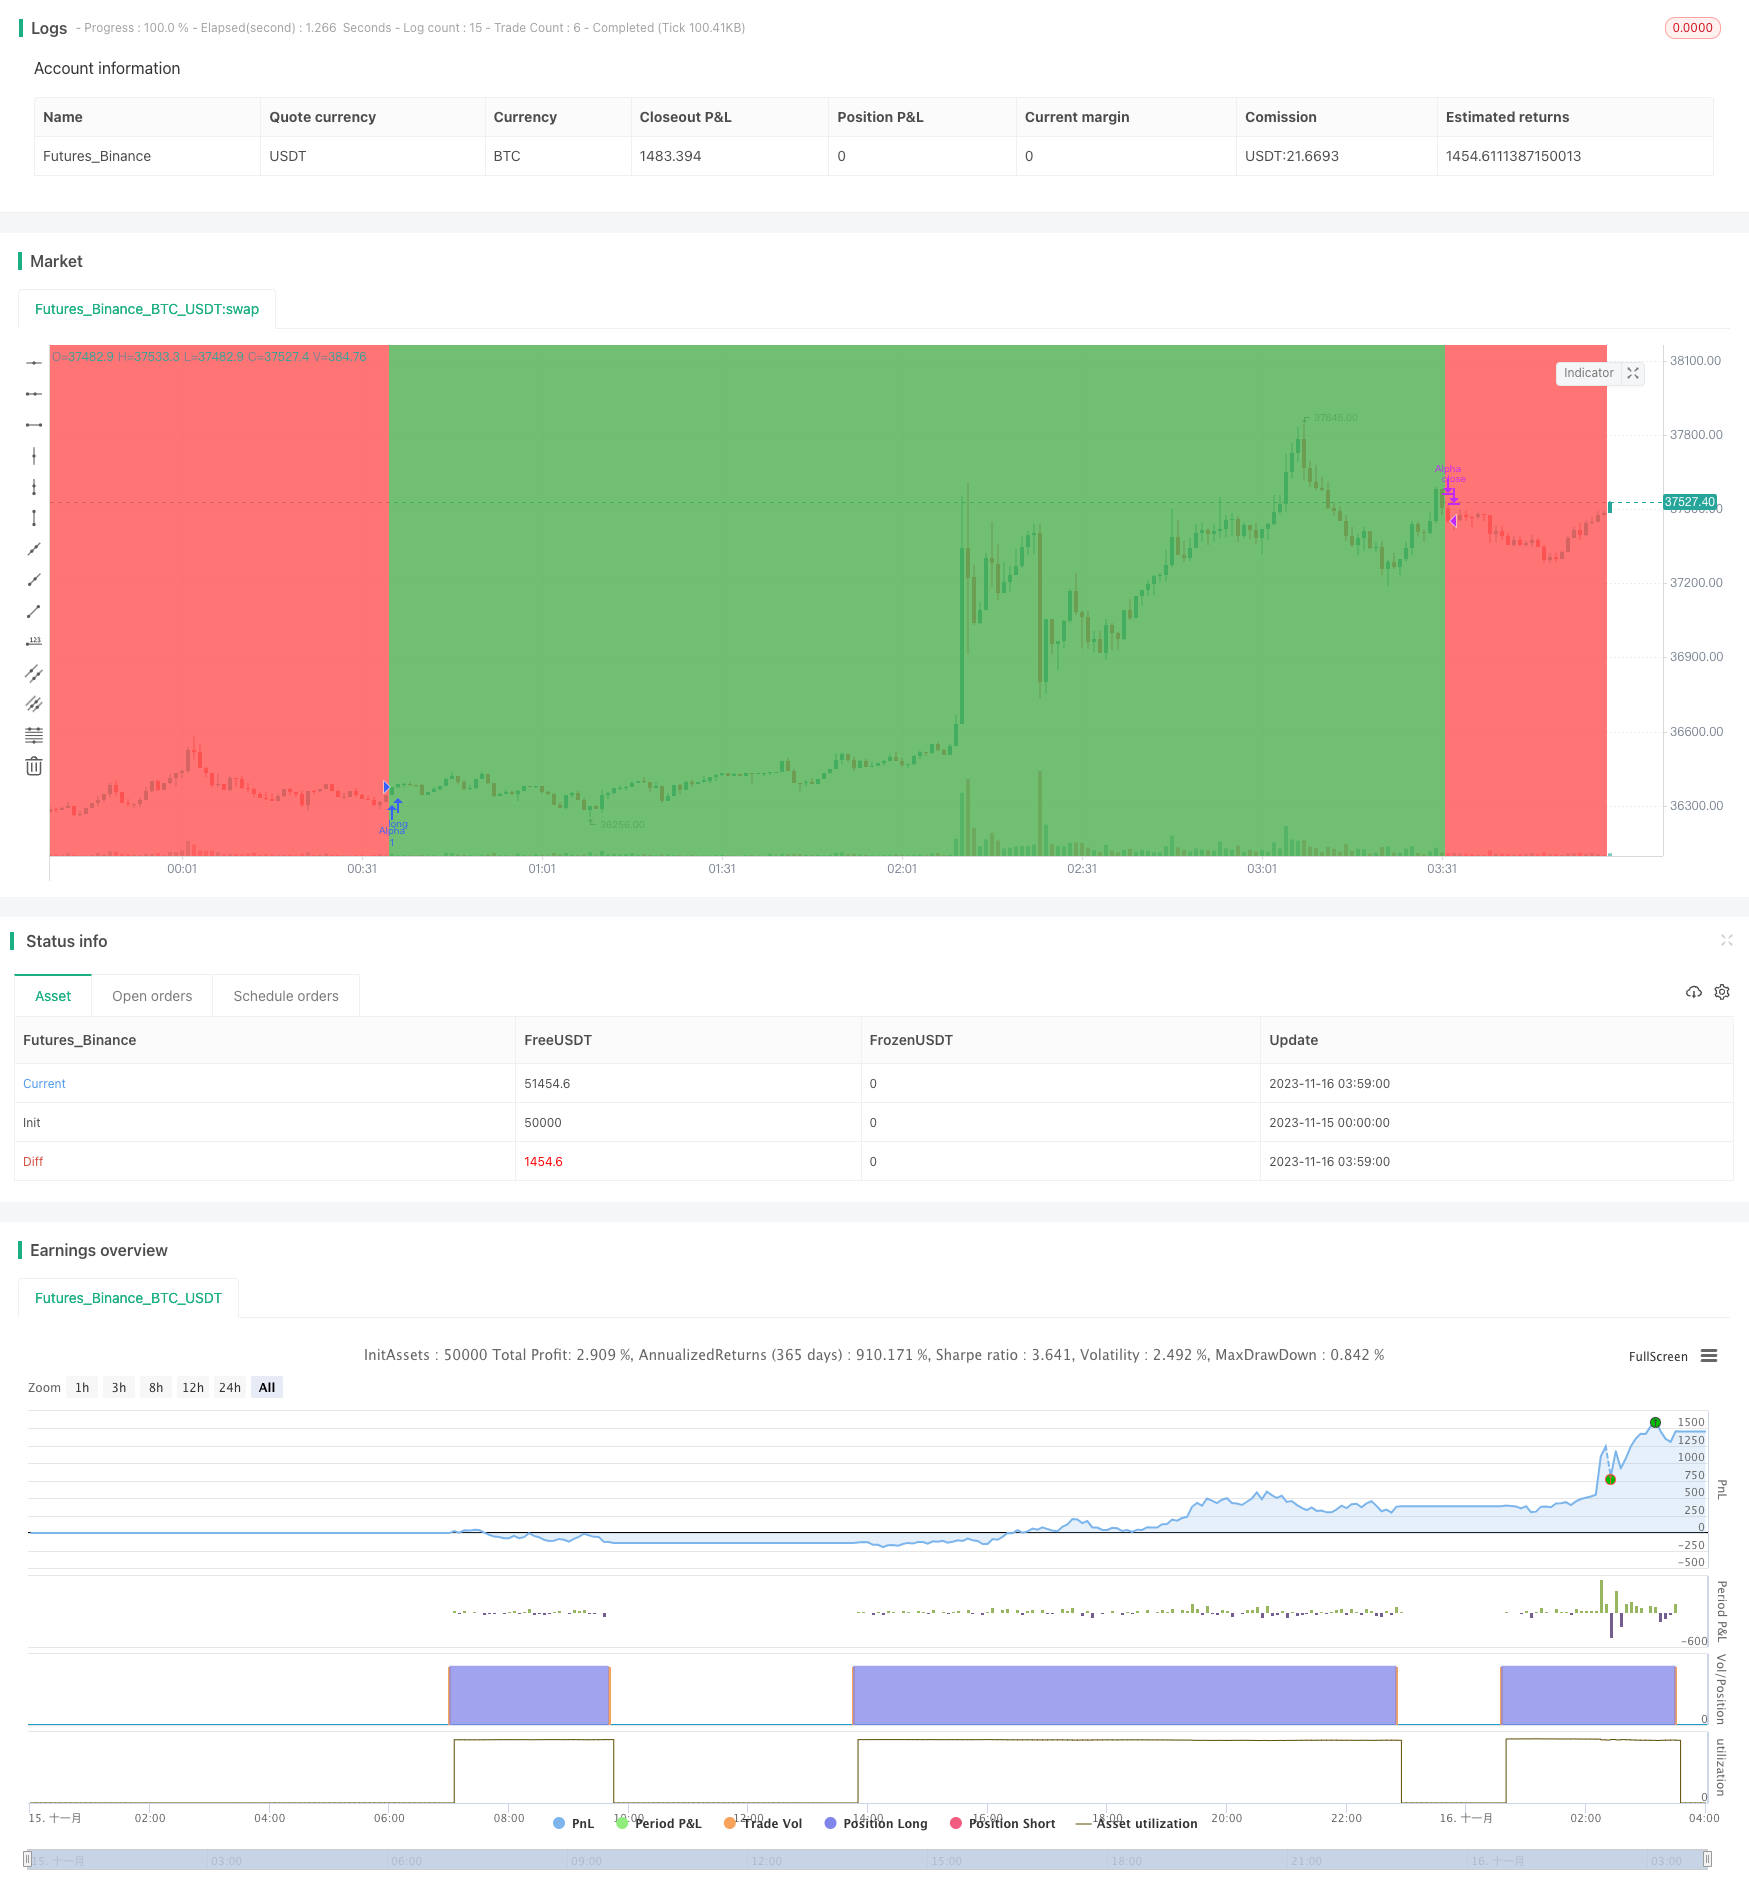
Momentum Alpha策略通过计算标的资产的夏普比率和Alpha值,判断其是否存在正的Momentum效应。当夏普比率和Alpha同时为正时,认为资产存在Momentum,做多;当指标值同时为负时,平仓。
策略原理
该策略的核心指标是夏普比率和Alpha。夏普比率反映资产的风险调整后收益,Alpha反映资产相对市场基准的超额收益。当二者同时为正,说明资产具有较高的风险调整收益和较市场为优的绩效,因此做多;当二者同时为负,说明Momentum消失,因此平仓。
具体来说,策略首先计算最近180天的夏普比率。夏普比率的计算公式为:(日收益率均值 - 无风险收益率) / 日收益率标准差。这里使用开盘价和前一日收盘价计算日收益率的均值和标准差。当夏普比率大于1时,说明资产的风险调整后收益较高。
同时,策略计算最近180天的Alpha。Alpha通过市场模型计算:Alpha = 资产实际收益率 - (市场收益率 × Beta)。这里使用标的资产的日收益率和标准普尔500指数的日收益率进行计算。当Alpha大于0时,说明资产的实际收益高于市场基准收益。
因此,当夏普比率和Alpha同时为正时,做多;当二者同时为负时,平仓。
优势分析
该策略最大的优势在于通过Momentum判断,能够捕捉大盘和部分股票在特定时期的增长机会,此外通过控制风险,可以避免长期的股灾。具体分析如下:
-
计算夏普比率反映最近期的Momentum情况,可以抓住一些大盘和股票的拉升上涨期。计算Alpha反映相对基准的超额收益,可以滤除较弱的标的。
-
通过综合考虑夏普比率和Alpha,同时控制长短期Momentum,可以更准确判断是否具有正的Momentum。
-
当Momentum消失时,及时止损,避免较大亏损。这就是在拉升行情过后及时止盈的策略。
-
相比单一Momentum指标,该策略更稳定,同时也更灵活,可以在股票和大盘上都使用。
风险分析
尽管该策略有一定优势,但依然存在以下风险:
-
Momentum指标存在回撤的可能。当市场发生转折,Momentum股可能面临较快下跌。此时策略会亏损较大。可以适当调整参数,或考虑与其他指标组合使用。
-
Alpha和夏普比率指标计算存在时间滞后。当市场快速变化时,指标数值可能滞后,无法及时反映最新趋势变化。可以考虑缩短计算周期。
-
多空仓位没有控制,可能导致风险过于集中。可以考虑根据市场情况或资金情况适当控制仓位规模。
-
回测数据可能不足,实盘效果存疑。应增加更长时间段和不同品种的回测验证。同时缩短参数优化周期,避免过拟合。
优化方向
该策略还可以从以下几个方面进行优化:
-
增加止损机制。当价格出现较大单日跌幅时,可以设置止损点,避免出现大额亏损。
-
增加仓位管理。可以根据市场波动率等指标控制每次开仓的资金量。降低单笔损失风险。
-
优化参数。可以测试不同时间周期的参数,使之更符合不同标的和市况的特征。同时也可以测试不同的参数组合效果。
-
增加过滤条件。可以设置交易量或者波动率等其他条件。避免掉入一些震荡 Healthcare 或低流动性的陷阱。
-
组合其他策略。可以考虑与类似的趋势跟踪策略组合使用。既可以增强效果stabilit,又可以分散单一策略的风险。
总结
Momentum Alpha策略通过同时判断资产的风险调整收益和相对市场表现,动态捕捉正Momentum的机会。与单一Momentum指标相比,具有判断更为准确,适用范围更广,抗风险能力更强的优势。但该策略依然存在一定的回撤和滞后风险,需要反复优化与组合其他策略使用,才能在实盘中稳定获利。
||
Overview
The Momentum Alpha strategy judges whether an underlying asset has positive momentum by calculating its Sharpe ratio and alpha value. It goes long when both the Sharpe ratio and alpha are positive, and flattens the position when both indicators turn negative.
Strategy Principle
The core indicators of this strategy are Sharpe ratio and alpha. The Sharpe ratio reflects the risk-adjusted return of an asset, while alpha reflects its excess return over the market benchmark. When both are positive, it indicates the asset has high risk-adjusted returns and outperforms the market benchmark. Therefore, a long position is taken. When both turn negative, it means the momentum is gone and the position is flattened.
Specifically, the strategy first calculates the Sharpe ratio over the past 180 days. The Sharpe ratio is calculated as: (average daily return – risk free return) / standard deviation of daily returns. Here the average and standard deviation of daily returns are calculated using opening price and previous closing price. When the Sharpe ratio is greater than 1, it means the asset has a relatively high risk-adjusted return.
At the same time, the alpha over the past 180 days is calculated. Alpha is computed through the market model: Alpha = Actual asset return – (Market return x Beta). Here the daily returns of the underlying asset and S&P 500 index are used. When alpha is greater than 0, it means the actual return of the asset is higher than that of the market benchmark.
Therefore, when both the Sharpe ratio and alpha are positive, a long position is taken. When both turn negative, the position is flattened.
Advantage Analysis
The biggest advantage of this strategy is that by judging momentum, it can capture the growth opportunities of the broader market and some individual stocks during certain periods, while controlling risk to avoid prolonged market crashes. The advantages are analyzed in detail as follows:
-
Calculating the Sharpe ratio reflects recent momentum conditions and can capture the uptrends of some markets and stocks. Calculating alpha reflects excess returns over benchmark and filters out weaker underlyings.
-
By comprehensively considering both indicators across different time horizons, positive momentum can be more accurately determined.
-
When momentum disappears, timely stop losses avoid major losses. This allows proper profit taking after an uptrend.
-
Compared to single momentum indicators, this strategy is more stable while also being flexible enough to use on both stocks and indexes.
Risk Analysis
Despite the advantages, the strategy still has the following risks:
-
Momentum indicators can retract. When the market turns, momentum stocks may drop quickly. This can lead to large losses. Parameters could be adjusted or combined with other indicators.
-
Alpha and Sharpe ratio have time lags. When markets move fast, indicator values may lag and fail to reflect the latest trends. The calculation period could be shortened.
-
There is no position sizing control, leading to concentrated risks. Consider controlling position sizes based on market conditions or available capital.
-
Backtest data may be insufficient and live performance uncertain. More timeframe and instrument backtests should be performed. Parameter optimization windows should be shortened to prevent overfitting.
Optimization Directions
The strategy can be optimized in the following aspects:
-
Add stop loss mechanisms. Set stop loss points when prices drop sharply in a day to avoid huge losses.
-
Add position sizing management. Control the capital per trade based on market volatility to limit per trade loss.
-
Optimize parameters. Test different timeframes to fit characteristics of different underlyings and market conditions. Different parameter combinations could also be evaluated.
-
Add filtering conditions. Set filters such as trading volumes or volatility avoid getting stuck in ranging or low liquidity situations.
-
Combine with other strategies. Consider combining with other trend following strategies. This could both enhance stability and diversify risks away from a single strategy.
Summary
The Momentum Alpha strategy dynamically captures momentum opportunities by judging both the risk-adjusted returns and relative market performance of assets. Compared to single momentum indicators, it has the advantages of more accurate judgments, wider applicability, and higher risk resilience. But the strategy still carries risks of drawdowns and lags. It needs continuous optimization and combination with other strategies before stable live profits can be achieved.
[/trans]
Strategy Arguments
| Argument | Default | Description |
|---|---|---|
| v_input_1 | 180 | Sharpe/Alpha/Beta Period |
| v_input_2 | 2 | Sensitivity |
Source (PineScript)
/*backtest
start: 2023-11-15 00:00:00
end: 2023-11-16 04:00:00
period: 1m
basePeriod: 1m
exchanges: [{"eid":"Futures_Binance","currency":"BTC_USDT"}]
*/

//@version=2
strategy("Alpha strategy - simple version", overlay=true)

//by NIKLAUS
//USE ON DAILY TIMEFRAME TO DETECT MOMO STOCKS & ETFs AND TRADE THEM
//USE ON 5MIN CHART FOR INTRADAY USAGE
//examples to try this on: GER30, NAS100, JPN225, AAPL, IBB, TSLA, FB, etc.

//This Strategy goes long when Sharpe Ratio is > 1 and Alpha against the S&P500 is generated. It exits when conditions break away.

//https://en.wikipedia.org/wiki/Alpha_(finance)
//------------------------------------------------------------------------------------------------------------------------------------
//Alpha is a measure of the active return on an investment, the performance of that investment compared to a suitable market index.
//An alpha of 1% means the investment's return on investment over a selected period of time was 1% better than the market during that same period,
//an alpha of -1 means the investment underperformed the market.
//Alpha is one of the five key measures in modern portfolio theory: alpha, beta, standard deviation, R-squared and the Sharpe ratio.


//simplified sharpe
src = ohlc4, len = input(180, title = "Sharpe/Alpha/Beta Period")
pc = ((src - src[len])/src)
std = stdev(src,len)
stdaspercent = std/src
sharpe = pc/stdaspercent


//alpha
sym = "BTC_USDT:swap", res=timeframe.period, src2 = close
ovr = request.security(sym, res, src2)

ret = ((close - close[1])/close)
retb = ((ovr - ovr[1])/ovr)
secd = stdev(ret, len), mktd = stdev(retb, len)
Beta = correlation(ret, retb, len) * secd / mktd

ret2 = ((close - close[len])/close)
retb2 = ((ovr - ovr[len])/ovr)

alpha = ret2 - retb2*Beta
//plot(Beta, color=green, style=area, transp=40)


smatrig = input(title="Sensitivity",  defval=2, minval=1, maxval=3)
bgcolor (sma(sharpe,len/smatrig) > 1 and sma(alpha,len/smatrig) > 0 ? green : red, transp=70)

if (close > open) and (sma(sharpe,len/smatrig) > 1) and (sma(alpha,len/smatrig) > 0)
    strategy.entry("Alpha", strategy.long)
strategy.close("Alpha", when = (sma(sharpe,len/smatrig) < 1) or (sma(alpha,len/smatrig) < 0))
Detail
https://www.fmz.com/strategy/432974
Last Modified
2023-11-23 11:34:40