
8.5 KiB
Name
Ichimoku-Kinko-Hyo交易策略Ichimoku-Kinko-Hyo-Trading-Strategy
Author
ChaoZhang
Strategy Description
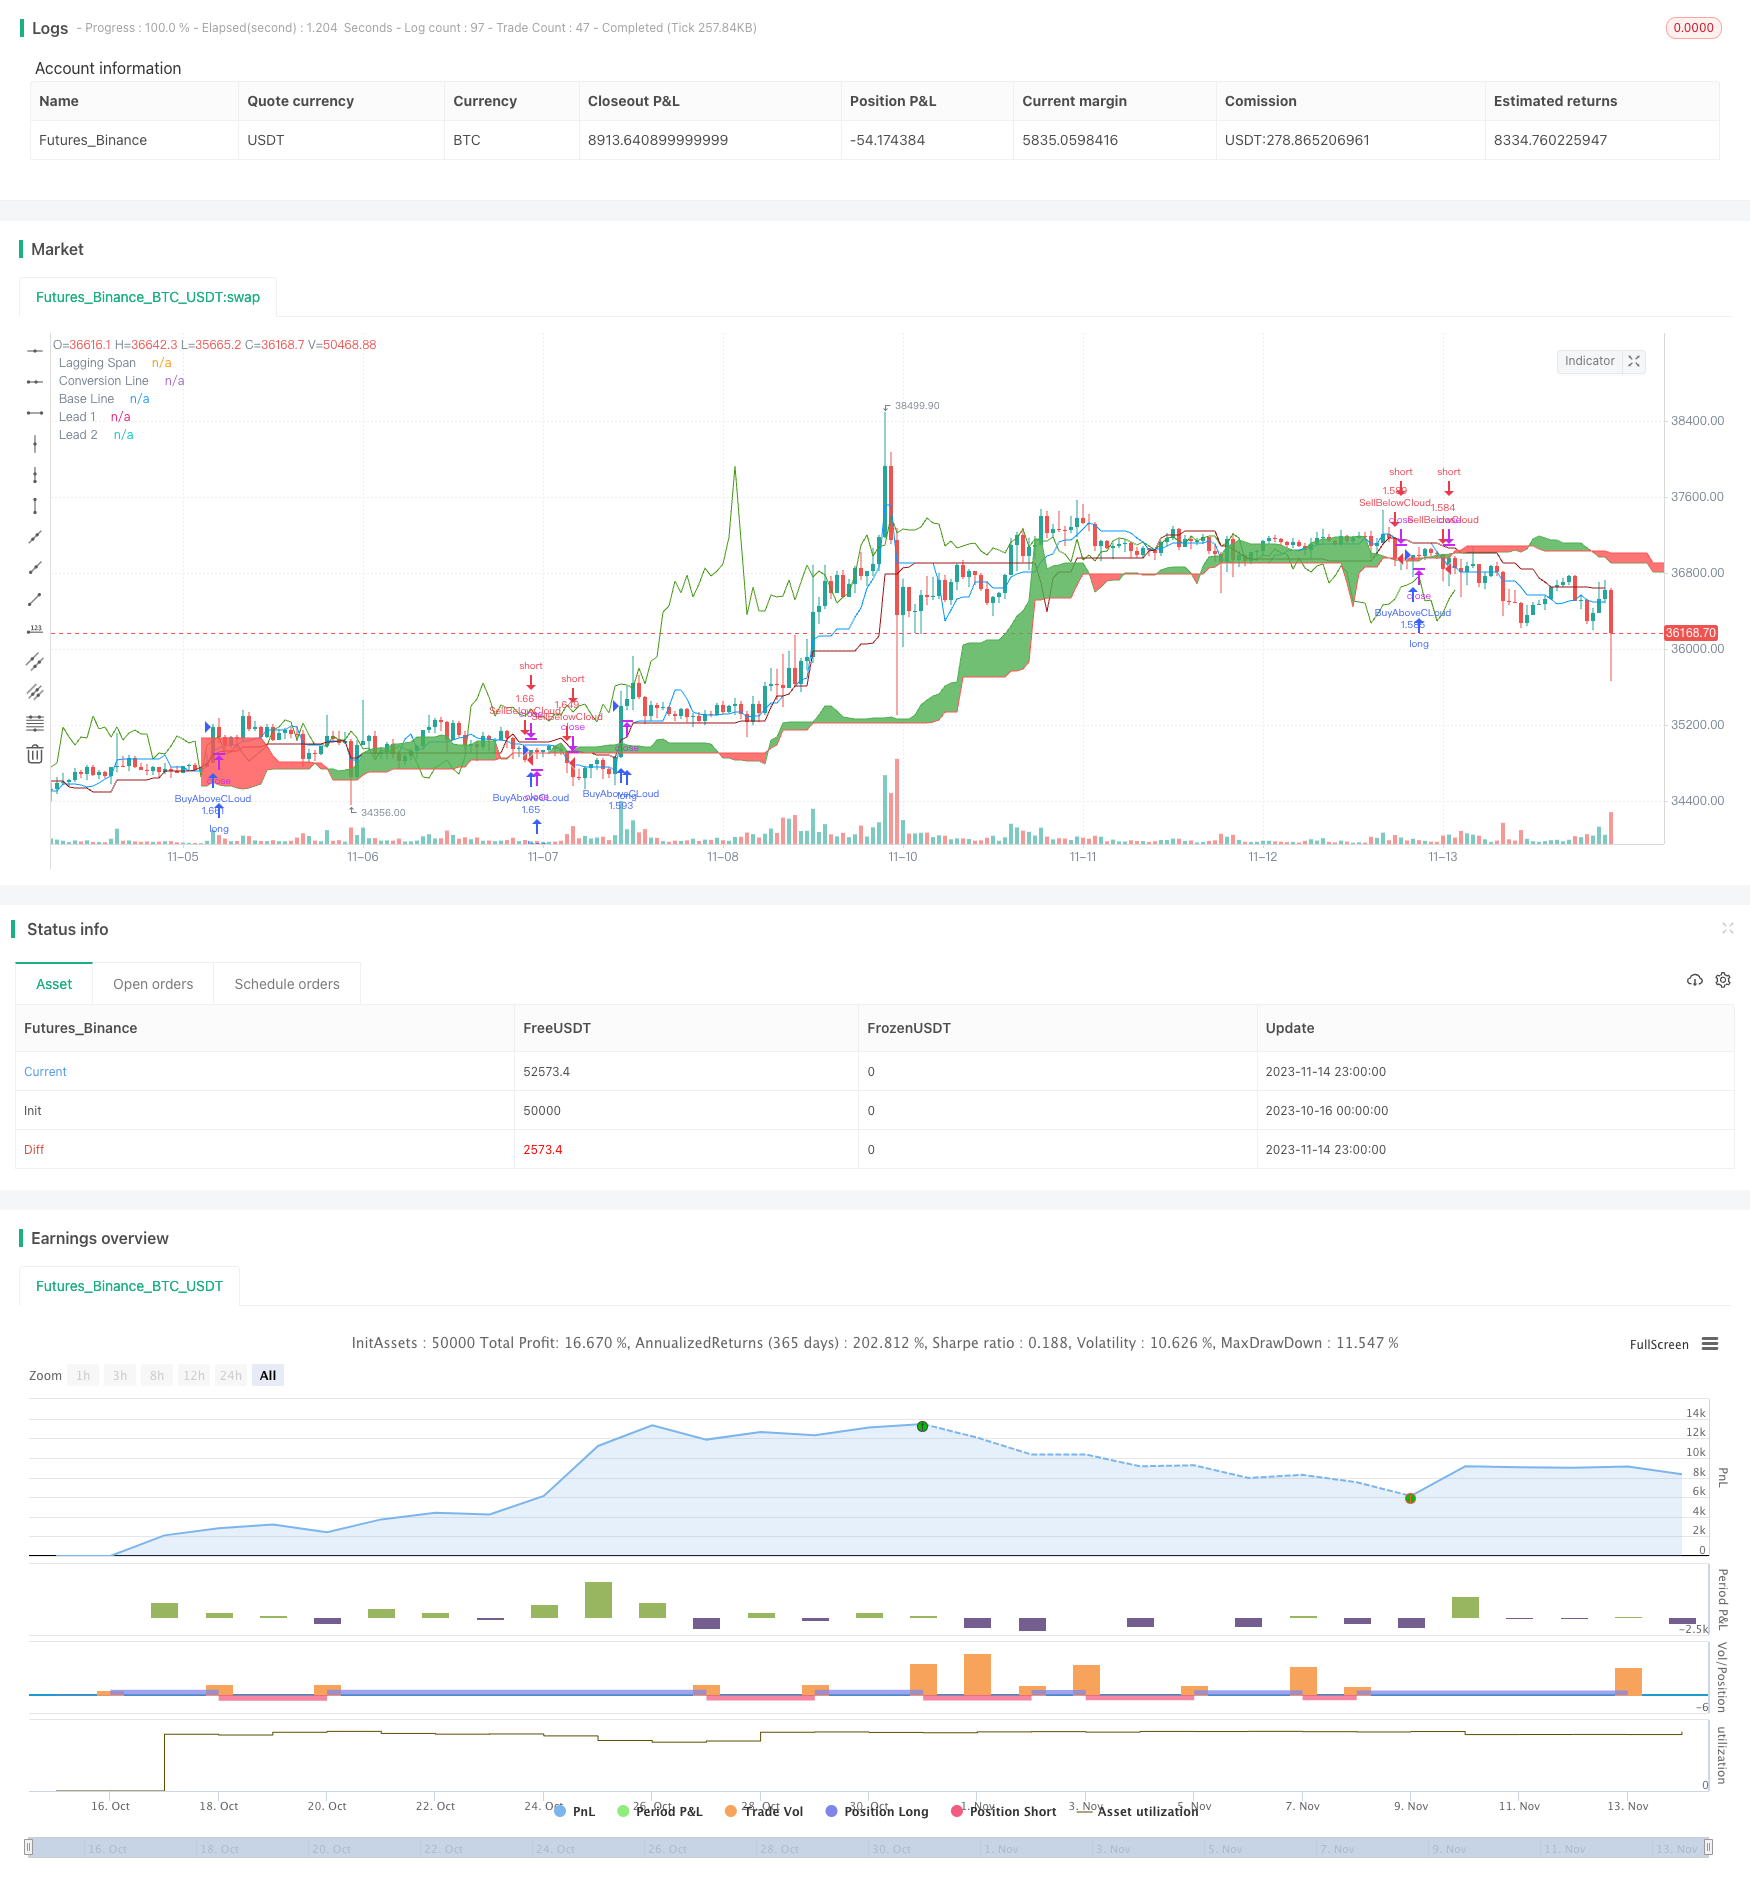 [trans]
概述
Ichimoku Kinko Hyo交易策略是一个基于Ichimoku技术指标的趋势跟踪策略。该策略利用Ichimoku的转换线、基准线、领先线1、领先线2等指标判断趋势方向,以及进场和止损的时机。
策略原理
该策略主要判断以下四个条件来决定交易方向:
- 关闭价上穿基准线上方26期平均值时,做多
- 关闭价下穿基准线下方26期平均值时,做空
- 止盈条件:百分之3.5
- 止损条件:百分之1.5
具体来说,策略首先计算出转换线、基准线、领先线1和领先线2。然后判断关闭价是否突破云图的上沿或下沿,来决定做多还是做空。
如果关闭价上穿云图的上沿,即上穿领先线1和领先线2的较大值的26期平均值时,表示股价进入上升趋势,这时做多。
如果关闭价下穿云图的下沿,即下穿领先线1和领先线2的较小值的26期平均值时,表示股价进入下降趋势,这时做空。
进场后设置止盈和止损条件。止盈条件为入场价的3.5%,止损条件为入场价的1.5%。
优势分析
Ichimoku Kinko Hyo交易策略具有以下优势:
- 能够识别趋势的变化,及早进入趋势
- 使用云图判断支撑和阻力区域,进场较为准确
- 同时考虑价格和交易量,不易被假突破误导
- 止盈止损条件明确,可以控制交易风险
风险分析
Ichimoku Kinko Hyo交易策略也存在一些风险:
- 在盘整行情中,容易产生多次小幅亏损
- 若大趋势发生转变,止损可能较大
- 需同时满足多个条件才能进场,机会较少
- 参数设置不当可能导致曲解指标信号
对策:
- 可适当放宽进场条件,增加交易机会
- 优化参数,使之更符合市场特点
- 结合其他指标过滤假信号
优化方向
Ichimoku Kinko Hyo交易策略可以从以下几个方面进行优化:
- 优化转换线、基准线等参数,使之更贴合不同周期的市场行情
- 优化入场条件,避免错过较好的机会
- 优化止盈止损策略,实现更高的风险调整收益
- 结合其他指标进行信号过滤,以减少套利次数
- 动态调整仓位,根据市场波动程度来确定具体投入资金量
总结
Ichimoku Kinko Hyo交易策略overall relatively good strategy that can capture potential trends in a timely manner. But it still needs further optimization and combination with other indicators to form a robust trading system. By adjusting parameters, improving entry and exit techniques, and controlling risks, Ichimoku strategy can achieve higher risk-adjusted returns in trending markets.
||
Overview
The Ichimoku Kinko Hyo trading strategy is a trend-following strategy based on the Ichimoku technical indicator. It uses the conversion line, base line, leading span 1, leading span 2 and other indicators of the Ichimoku system to determine trend direction and timing of entry and exit.
Strategy Logic
The strategy mainly judges the following four conditions to decide the trading direction:
- Go long when the closing price crosses above the 26-period average of the top of the cloud
- Go short when the closing price crosses below the 26-period average of the bottom of the cloud
- Take profit condition: 3.5%
- Stop loss condition: 1.5%
Specifically, the strategy first calculates the conversion line, base line, leading span 1 and leading span 2. It then determines whether to go long or short based on if the closing price breaks through the top or bottom of the cloud.
If the closing price crosses above the top of the cloud, i.e. above the 26-period average of the greater value between leading span 1 and leading span 2, it indicates an upward trend and goes long.
If the closing price crosses below the bottom of the cloud, i.e. below the 26-period average of the lower value between leading span 1 and leading span 2, it indicates a downward trend and goes short.
After entry, take profit and stop loss conditions are set. Take profit is set at 3.5% of entry price and stop loss is 1.5% of entry price.
Advantage Analysis
The Ichimoku Kinko Hyo trading strategy has the following advantages:
- Ability to identify trend changes early and enter trends in a timely manner
- Using the cloud to determine support and resistance areas makes entries more accurate
- Considers both price and volume to avoid false breakouts
- Clear profit taking and stop loss conditions to control trading risk
Risk Analysis
The Ichimoku Kinko Hyo trading strategy also has some risks:
- It can produce multiple small losses in range-bound markets
- Stop loss can be large if the major trend reverses
- Needs multiple conditions to be met which reduces opportunities
- Incorrect parameter settings may misinterpret indicator signals
Solutions:
- Relax entry conditions to increase opportunities
- Optimize parameters to fit market characteristics better
- Add filters with other indicators to avoid false signals
Optimization Directions
The Ichimoku Kinko Hyo trading strategy can be optimized in the following aspects:
- Optimize conversion line, base line and other parameters to fit different period market conditions
- Optimize entry conditions to capitalize on more opportunities
- Optimize take profit and stop loss strategies for higher risk-adjusted returns
- Add filters with other indicators to reduce whipsaws
- Dynamically adjust position sizing based on market volatility
Summary
The Ichimoku Kinko Hyo trading strategy is an overall relatively good strategy that can capture potential trends in a timely manner. But it still needs further optimization and combination with other indicators to form a robust trading system. By adjusting parameters, improving entry and exit techniques, and controlling risks, Ichimoku strategy can achieve higher risk-adjusted returns in trending markets.
[/trans]
Strategy Arguments
| Argument | Default | Description |
|---|---|---|
| v_input_1 | false | only shows buying Trade |
| v_input_2 | 9 | Conversion Line Periods |
| v_input_3 | 26 | Base Line Periods |
| v_input_4 | 52 | Lagging Span 2 Periods |
| v_input_5 | 26 | Displacement |
| v_input_6 | 3.5 | enter target in % after entry |
| v_input_7 | 1.5 | enter Stoploss in % after entry |
Source (PineScript)
/*backtest
start: 2023-10-16 00:00:00
end: 2023-11-15 00:00:00
period: 1h
basePeriod: 15m
exchanges: [{"eid":"Futures_Binance","currency":"BTC_USDT"}]
*/

//@version=4
strategy("Ichimoku system", overlay=true, initial_capital = 100000, default_qty_type = strategy.percent_of_equity, default_qty_value=100)

buyOnly = input(false, "only shows buying Trade", type = input.bool)


conversionPeriods = input(9, minval=1, title="Conversion Line Periods"),
basePeriods = input(26, minval=1, title="Base Line Periods")
laggingSpan2Periods = input(52, minval=1, title="Lagging Span 2 Periods"),
displacement = input(26, minval=1, title="Displacement")

donchian(len) => avg(lowest(len), highest(len))

conversionLine = donchian(conversionPeriods)
baseLine = donchian(basePeriods)
leadLine1 = avg(conversionLine, baseLine)
leadLine2 = donchian(laggingSpan2Periods)

plot(conversionLine, color=#0496ff, title="Conversion Line")
plot(baseLine, color=#991515, title="Base Line")
plot(close, offset = -displacement + 1, color=#459915, title="Lagging Span")

p1 = plot(leadLine1, offset = displacement - 1, color=color.green,
 title="Lead 1")
p2 = plot(leadLine2, offset = displacement - 1, color=color.red,
 title="Lead 2")
fill(p1, p2, color = leadLine1 > leadLine2 ? color.green : color.red)


profit = input(3.5, "enter target in % after entry", step = 0.5)

stoploss = input(1.5, "enter Stoploss in % after entry", step = 0.5)


sl = stoploss /100 * strategy.position_avg_price / syminfo.mintick

profitt = profit /100 * strategy.position_avg_price / syminfo.mintick


abovecloud =  max(leadLine1, leadLine2)

belowcloud = min(leadLine1, leadLine2)


buying = close > abovecloud[26] and close[1] < abovecloud[27]

selling = close < belowcloud[26] and close[1] > belowcloud[27]

strategy.entry("BuyAboveCLoud", true, when = buying)

if buyOnly
    strategy.close("BuyAboveCLoud", when = selling)
else
    strategy.entry("SellBelowCloud", false, when = selling)

//strategy.exit("Exit Position", "BuyAboveCLoud", profit = profitt, loss = sl)


//strategy.exit("Exit Position", "SellBelowCloud", profit = profitt, loss = sl)
Detail
https://www.fmz.com/strategy/432358
Last Modified
2023-11-16 17:31:56