
7.0 KiB
Name
DEMA趋势追踪策略The-DEMA-Trend-Following-Strategy
Author
ChaoZhang
Strategy Description
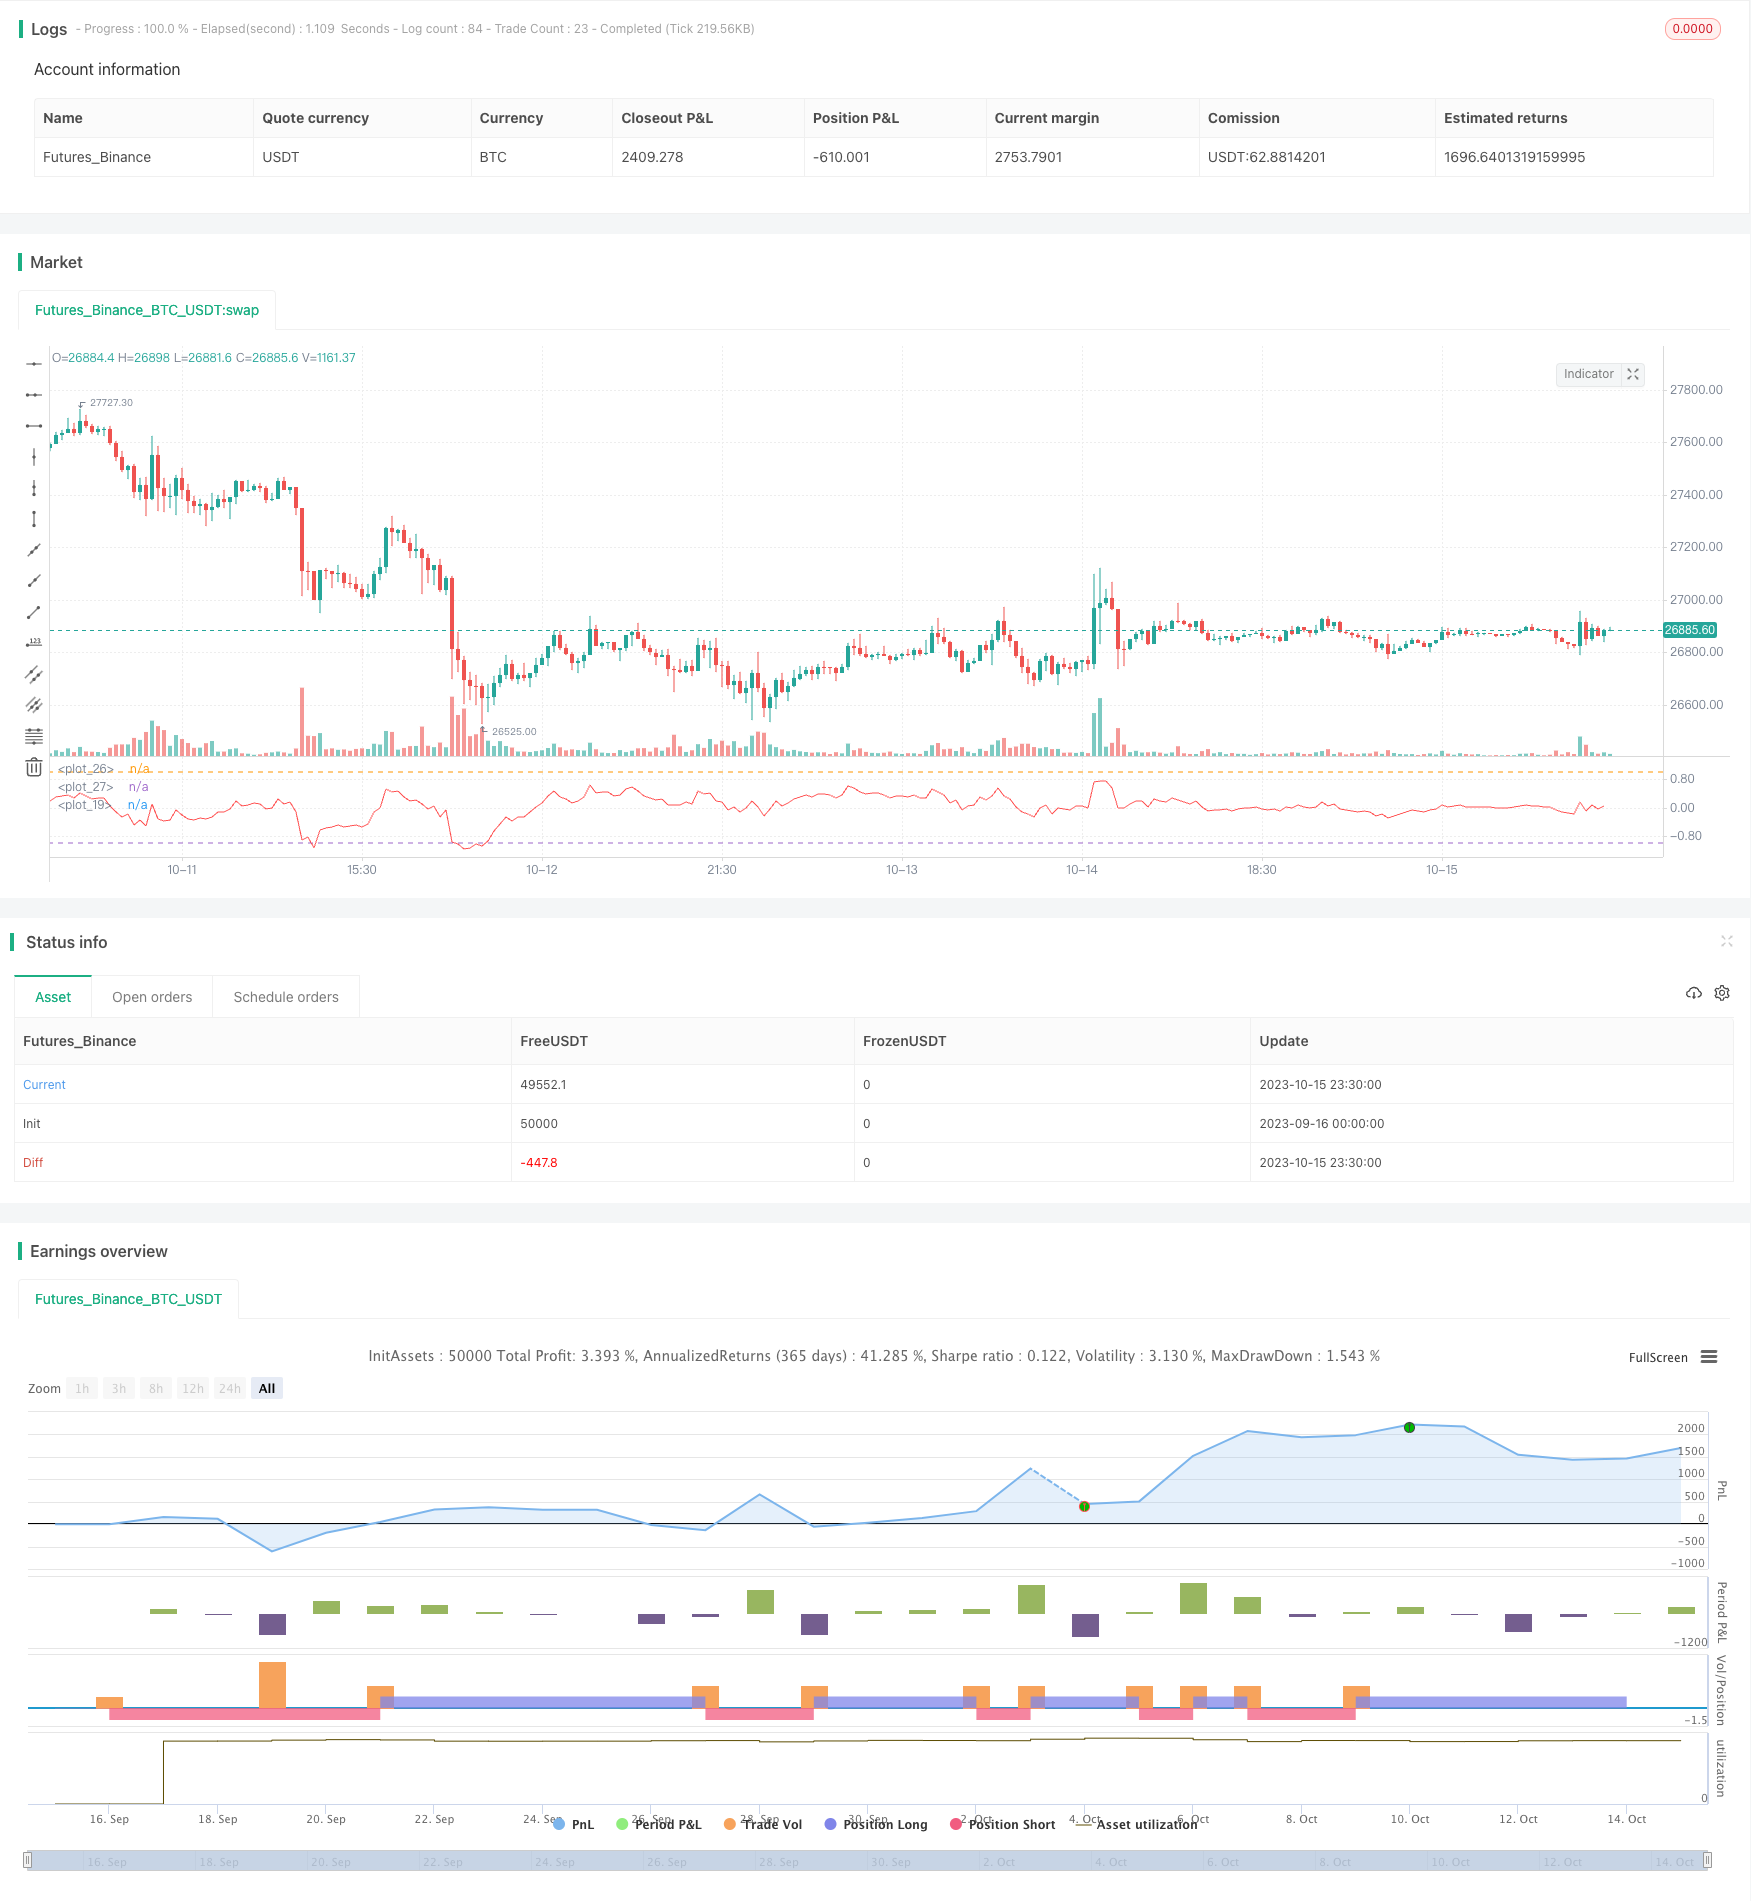
[trans]
概述
DEMA趋势追踪策略基于DEMA指标设计,当价格突破DEMA指标下轨时产生买入信号,当价格跌破DEMA指标上轨时产生卖出信号,属于趋势跟踪策略。
策略原理
该策略使用DEMA指标判断价格趋势。DEMA指标是双指数移动平均线,它使用两个EMA线计算得到,可以更快捕捉价格变化。策略通过计算价格与DEMA的差值百分比,然后给出买入和卖出信号。
当差值百分比上穿设定的参数buyper时,产生买入信号。当差值百分比下穿设定的参数sellper时,产生卖出信号。buyper和sellper参数代表产生信号的strength,可以根据市场调整。
此外,策略还设置了年月日范围作为过滤条件,只有在指定的日期内才会产生交易信号。
策略优势分析
- 使用DEMA指标可以更敏感地捕捉价格变化,及时捕捉趋势反转。
- 相比SMA指标,DEMA指标有更低的滞后性。
- 设置买卖strength参数,可以控制交易频率。
- 添加日期过滤条件,可以针对季节性行情进行优化。
- 整体来说,该策略parametrs设置合理,可以进行参数优化,从而适应不同市场环境。
策略风险分析
- DEMA指标本身存在滞后性,可能错过短期趋势反转。
- 信号产生有一定滞后,入场时点不精确。
- 策略仅基于DEMA指标,没有辅助指标验证信号可靠性。
- 没有设置止损,可能给账户带来较大亏损。
可以通过结合其他指标验证信号,优化参数设置,添加止损来控制风险。
策略优化方向
- 可以考虑加入MA指标进行信号过滤,利用MA的顺势性特点验证趋势。
- 可以测试不同参数对策略收益率的影响,找到最优参数组合。
- 可以添加止损策略,设置合理的止损幅度,控制单笔亏损。
- 可以测试不同股票对策略效果的影响,优化股票池。
- 可以尝试多种exit策略,如趋势反转,突破等退出机制。
总结
DEMA趋势追踪策略整体设计合理,具有一定的稳定盈利能力。该策略成功运用DEMA指标判断趋势方向,可以对多种股票和大中长线周期有效。通过参数优化、辅助指标验证、止损策略等手段可以进一步提高策略收益率并控制风险。该策略有一定的实盘运用价值,但需要根据不同市场环境不断测试和优化,才能获得长期稳定收益。
||
Overview
The DEMA trend following strategy is designed based on the DEMA indicator. It generates buy signals when the price breaks through the lower band of the DEMA and sell signals when the price breaks through the upper band. This strategy belongs to the trend following system.
Strategy Logic
This strategy uses the DEMA indicator to determine the price trend. DEMA is the Double Exponential Moving Average, which is calculated with two EMA lines and can capture price changes faster. The strategy calculates the percentage difference between the price and DEMA, and then generates trading signals.
When the percentage difference crosses above the buyper parameter, a buy signal is generated. When the percentage difference crosses below the sellper parameter, a sell signal is generated. The buyper and sellper parameters represent the strength to generate signals, which can be adjusted based on market conditions.
In addition, the strategy also sets date ranges as filter conditions. Trading signals are only generated within the specified date range.
Advantage Analysis
- Using DEMA can capture price changes more sensitively and identify trend reversals in a timely manner.
- Compared with SMA, DEMA has lower lagging.
- Setting buy/sell strength parameters can control the trading frequency.
- Adding date filters can optimize for seasonal patterns.
- Overall, the parameter settings are reasonable and can be optimized for different market environments.
Risk Analysis
- DEMA itself has some lagging effect and may miss short-term trend reversals.
- There is certain lag in signal generation, entry timing is not precise.
- The strategy relies solely on DEMA without other indicators to verify the signal reliability.
- No stop loss is set, which can lead to large losses.
Risks can be mitigated by combining other indicators for signal verification, optimizing parameters, and adding stop loss.
Optimization Directions
- Consider adding MA indicators for signal filtering, utilizing the trending quality of MA.
- Test the impact of different parameters on return to find the optimal parameter combination.
- Add stop loss strategies with reasonable stop loss percentage to control per trade loss.
- Test the strategy on different stocks to optimize the stock pool.
- Try various exit strategies like trend reversal, breakout etc.
Conclusion
The DEMA trend following strategy is reasonably designed with stable profitability. It successfully uses the DEMA indicator to determine trend direction and works well on various stocks and medium-to-long-term timeframes. Further improvements on parameters, additional indicators, stop loss can enhance return and risk control. This strategy has practical value for live trading but needs continuous testing and optimization for long-term stability.
[/trans]
Strategy Arguments
| Argument | Default | Description |
|---|---|---|
| v_input_1 | -1 | buyper |
| v_input_2 | true | sellper |
| v_input_3 | 50 | Dema Length |
| v_input_4 | true | Band for OverBought |
| v_input_5 | -1 | Band for OverSold |
| v_input_6 | 2018 | yearfrom |
| v_input_7 | 2019 | yearuntil |
| v_input_8 | 6 | monthfrom |
| v_input_9 | 12 | monthuntil |
| v_input_10 | true | dayfrom |
| v_input_11 | 31 | dayuntil |
Source (PineScript)
/*backtest
start: 2023-09-16 00:00:00
end: 2023-10-16 00:00:00
period: 30m
basePeriod: 15m
exchanges: [{"eid":"Futures_Binance","currency":"BTC_USDT"}]
*/

//@version= 2
strategy("DEMA PRICE DİFFERENCE Strategy ",shorttitle="DPD% STR " ,overlay=false)

buyper =input(-1)
sellper=input(1)

demalen = input(50,title="Dema Length")

e1= ema(close,demalen)
e2=ema(e1,demalen)
demaprice  =   2 * e1 - e2

price=close

demadifper =  ((price-demaprice)/price)*100


plot(demadifper, color=red)
OverDemaPer = input(1, title="Band for OverBought")
UnderDemaPer= input(-1,title="Band for OverSold")


band1 = hline(OverDemaPer)
band0 = hline(UnderDemaPer)
zeroline=0
fill(band1, band0, color=green, transp=90)


yearfrom = input(2018)
yearuntil =input(2019)
monthfrom =input(6)
monthuntil =input(12)
dayfrom=input(1)
dayuntil=input(31)


if (  crossover(demadifper,buyper))
    strategy.entry("BUY", strategy.long, stop=close, oca_name="TREND",  comment="BUY")

else
    strategy.cancel(id="BUY")


if ( crossunder(demadifper,sellper)  )

    strategy.entry("SELL", strategy.short,stop=close, oca_name="TREND",  comment="SELL")
else
    strategy.cancel(id="SELL")
Detail
https://www.fmz.com/strategy/429510
Last Modified
2023-10-17 17:17:34