
9.1 KiB
Name
顺势突破均线交叉策略Schaff-Trend-Cycle-with-Double-Moving-Average-Crossover-Strategy
Author
ChaoZhang
Strategy Description
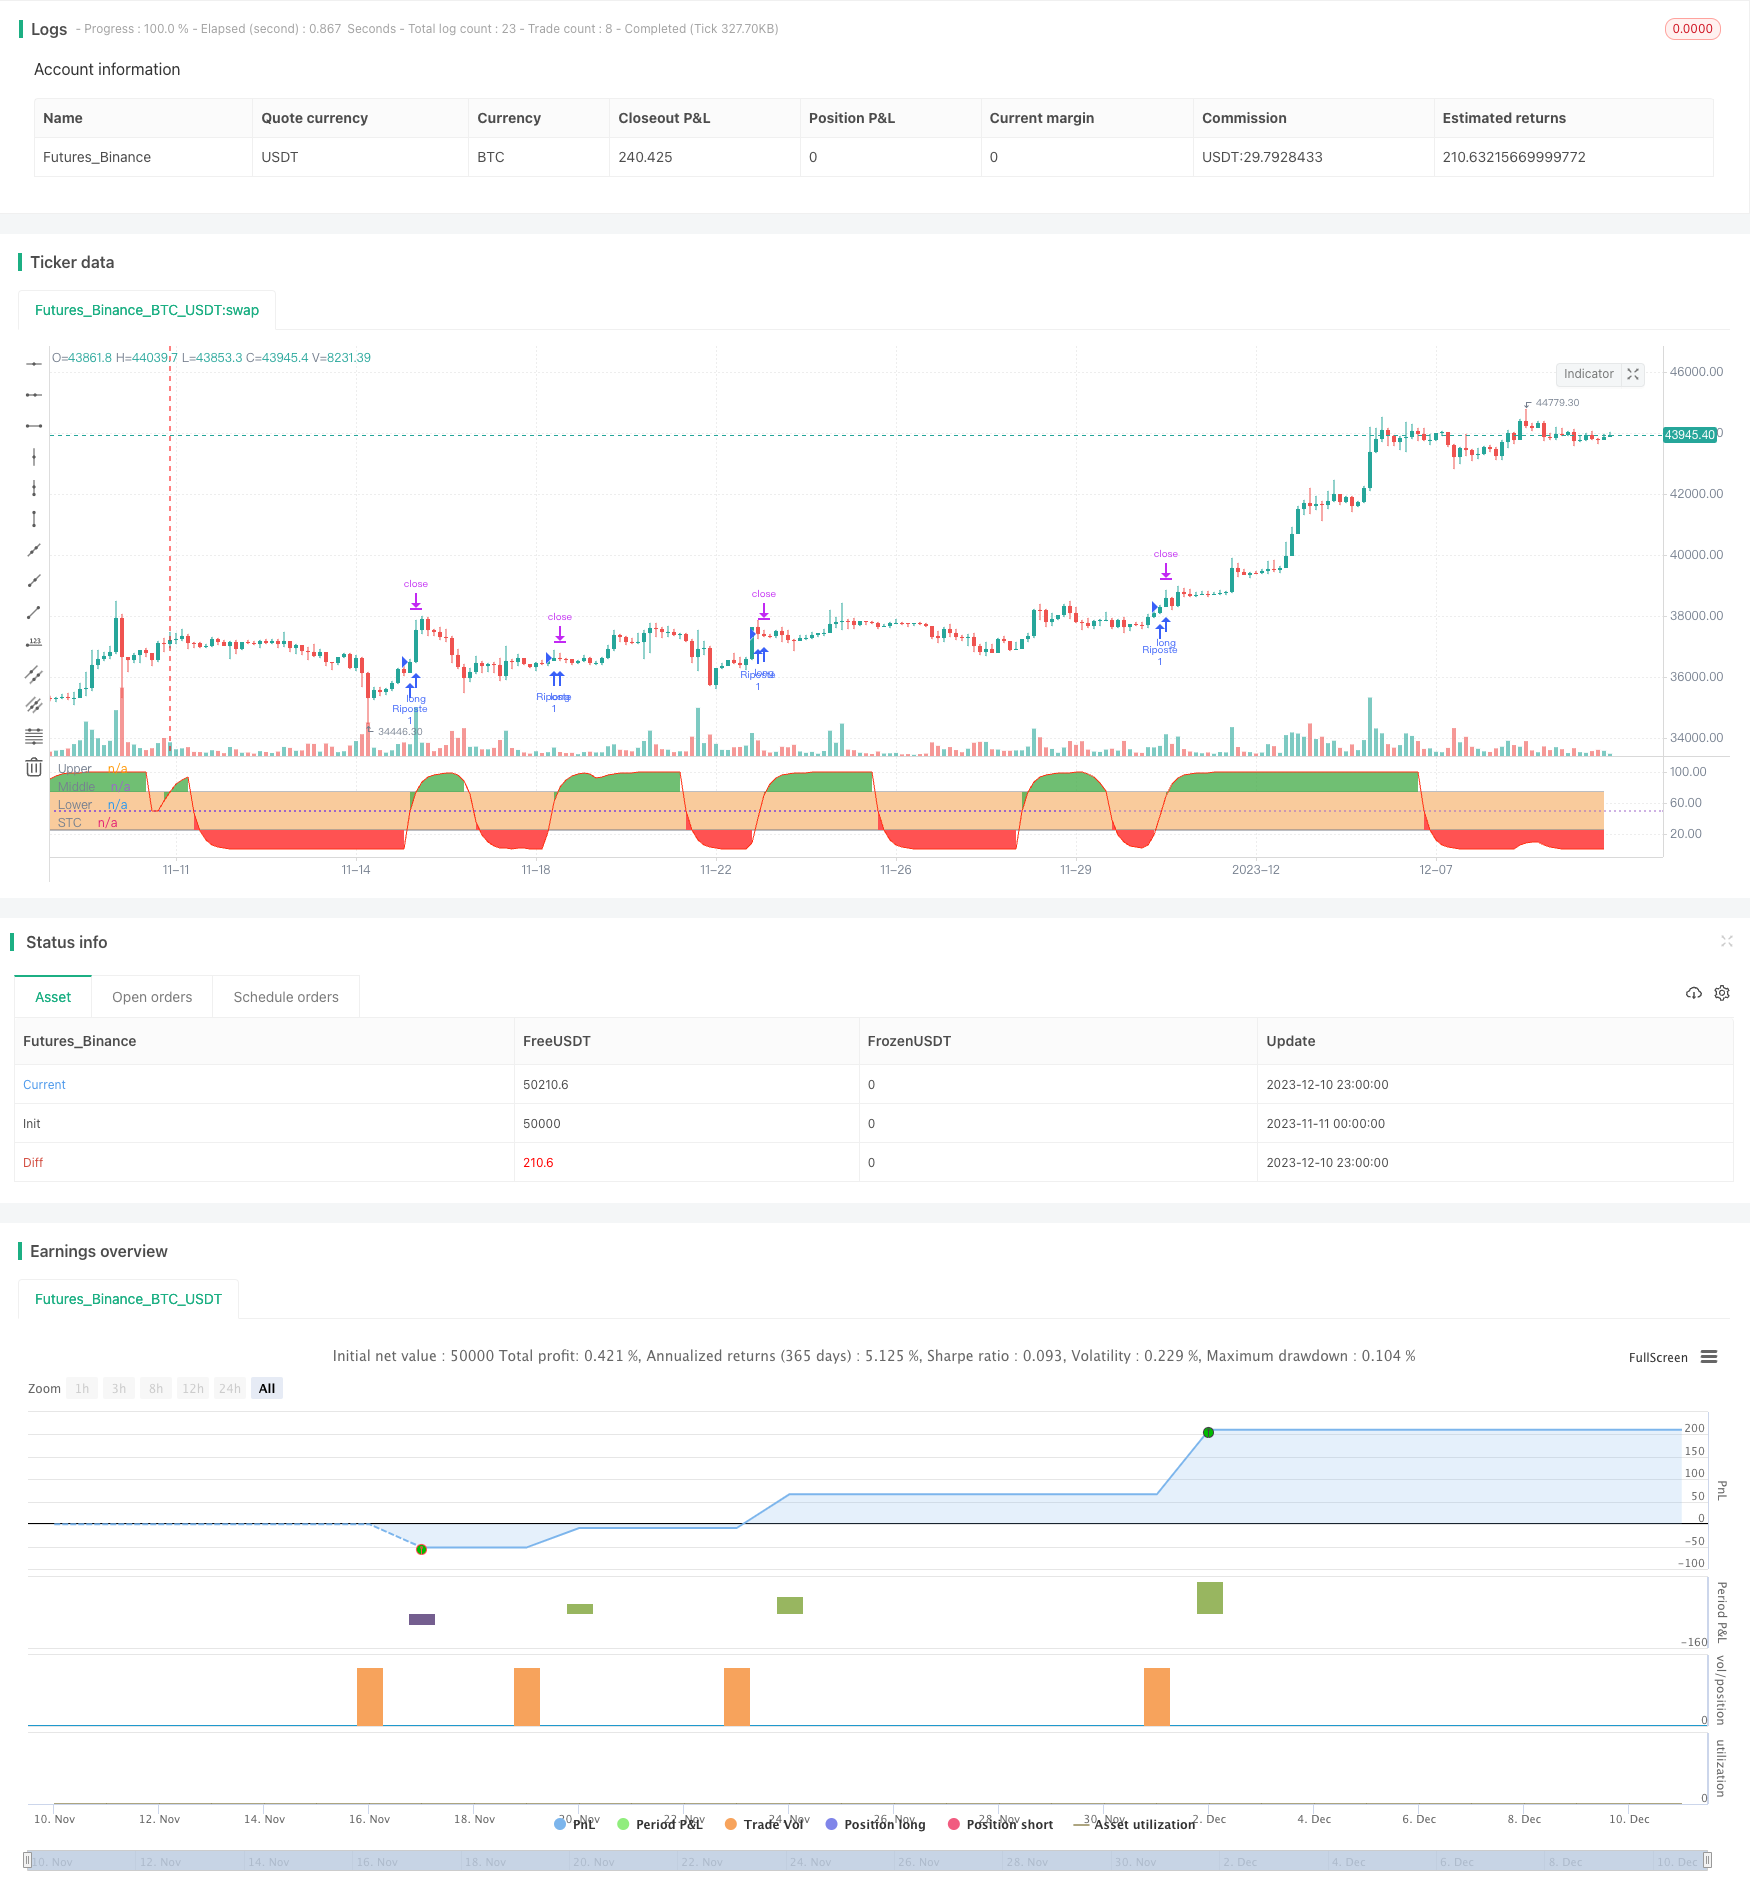 [trans]
概述
本策略名为“顺势突破均线交叉策略”,主要思想是结合顺势指标和均线交叉进行判断做多做空。具体来说,本策略运用 шаф趋势周期(Schaff Trend Cycle,STC)指标和双平均线交叉。当 STC 方向突破超买超卖区域,价格高于短期指数移动平均线,短期指数移动平均线高于长期指数移动平均线时,做多;反之,做空。
策略原理
本策略主要基于两个技术指标:
-
顺势指标:STC 指标,判断趋势方向。STS 指标包含 MACD 指标、Stoch 指标和 STC 指标线。当 STC 线从 0-25 区间向上突破时为多头信号;当从 75-100 区间向下突破时为空头信号。
-
均线交叉:快速简单移动平均线(默认周期 35)和慢速简单移动平均线(默认周期 200)的交叉。快速线上穿慢速线为多头信号,快速线下穿慢速线为空头信号。
本策略的交易信号判断逻辑如下:
-
做多信号:STC 指标向上突破 25 线,且快速简单移动平均线高于慢速简单移动平均线,且价格高于快速简单移动平均线时,做多。
-
做空信号:STC 指标向下突破 75 线,且快速简单移动平均线低于慢速简单移动平均线,且价格低于快速简单移动平均线时,做空。
优势分析
本策略具有以下优势:
-
结合趋势指标和均线指标,交易信号比较可靠。STC 指标判断大趋势方向,双均线判断具体入场。
-
均线参数可调。可以根据市场调整均线参数,优化策略。
-
风险可控。STC 指标判断超买超卖区域,避免在极端区域追高抄底。目标止损设置了 400 个点的止盈止损范围。
风险分析
本策略也存在一定风险:
-
STC 指标可能出现假突破。需要结合价格实体判断。
-
均线交叉可能产生较多假信号。需要调整均线周期参数。
-
只做单边交易。空间有限。可以考虑双向交易。
-
没有处理外汇保证金交易的滑点风险。实盘中滑点可能较大。
优化方向
本策略可以从以下几个方面进行优化:
-
调整 STC 参数,优化超买超卖判断。
-
优化均线周期,提高交叉信号的可靠性。
-
增加其他滤波指标,过滤假突破。例如布林带。
-
增加双向交易逻辑。降低空间风险。
-
添加止损逻辑。控制单笔亏损。
总结
本策略综合运用了顺势指标和均线交叉指标,判断趋势方向和具体入场点位。在确保一定的风险控制条件下,可以获得较好的收益。该策略模型简单清晰,容易理解,也便于根据不同市场进行参数调整和功能优化,适合初学者学习和应用。
||
Overview
This strategy is named "Schaff Trend Cycle with Double Moving Average Crossover Strategy". The main idea is to determine long and short positions based on the Schaff Trend Cycle (STC) indicator and double moving average crossover. Specifically, when the STC breaks out of the overbought or oversold areas, the price is above the fast exponential moving average, and the fast EMA is above the slow EMA, a long position is opened. Conversely, a short position is opened.
Strategy Logic
The strategy relies primarily on two technical indicators:
-
Trend indicator: STC indicator to determine trend direction. The STC includes the MACD, Stochastic, and STC indicator line. An upward breakout from the 0-25 zone signals a bullish trend, while a downward breakout from the 75-100 zone signals a bearish trend.
-
Moving average crossover: Fast simple moving average (default period 35) crosses above/below the slow SMA (default period 200). A bullish signal triggered when the fast SMA crosses above the slow SMA. A bearish signal triggered on the opposite crossover.
The trading signal logic is defined as follows:
-
Long signal: STC breaks above the 25 line, fast SMA is above slow SMA, and close price is above fast SMA.
-
Short signal: STC breaks below 75 line, fast SMA is below slow SMA, and close price is below fast SMA.
Advantage Analysis
The advantages of this strategy include:
-
Reliable trading signals from combining trend and moving average indicators. STC determines overall trend, while double MAs generate specific entry signals.
-
Customizable moving average periods. MA periods can be optimized for different market conditions.
-
Controllable risk. STC identifies overbought/oversold levels to avoid buying tops and selling bottoms. Target stops set 400 point profit/loss range.
Risk Analysis
There are some risks to consider:
-
Potential for STC false breakouts. Needs to be confirmed by price action.
-
More false signals from MA crosses. Requires tuning of MA periods.
-
Only trades in one direction at a time. Limits space for open positions. Consider allowing dual-directional trading.
-
No handling of spread risk in margin FX trading. Spread could be substantial in live trading.
Optimization
Possible optimization paths include:
-
Adjust STC overbought/oversold parameters.
-
Optimize MA periods to improve crossover signal reliability.
-
Add additional filters like Bollinger Bands to reduce false breakout trades.
-
Implement dual-directional trading logic to increase capacity.
-
Add stop loss logic to control loss per trade.
Conclusion
In summary, this strategy combines trend and moving average crossover indicators to determine trend direction and timing of entries. With proper risk controls, it can achieve good returns. The straightforward logic makes it easy to understand and optimize across different market conditions, well-suited for beginners.
[/trans]
Strategy Arguments
| Argument | Default | Description |
|---|---|---|
| v_input_1 | 23 | MACD Fast Length |
| v_input_2 | 50 | MACD Slow Length |
| v_input_3 | 10 | Cycle Length |
| v_input_4 | 3 | 1st %D Length |
| v_input_5 | 3 | 2nd %D Length |
| v_input_6 | true | Highlight Breakouts ? |
| v_input_7 | 400 | Target/stop |
| v_input_8 | 35 | SMA1 |
| v_input_9 | 200 | SMA2 |
Source (PineScript)
/*backtest
start: 2023-11-11 00:00:00
end: 2023-12-11 00:00:00
period: 3h
basePeriod: 15m
exchanges: [{"eid":"Futures_Binance","currency":"BTC_USDT"}]
*/

//@version=4
// Shaff Trend Cycle coded by Alex Orekhov (everget)
// Strategy and its additional conditions provided by greenmask
// Schaff Trend Cycle script may be freely distributed under the MIT license.
strategy("STC", shorttitle="STC")

fastLength = input(title="MACD Fast Length", type=input.integer, defval=23)
slowLength = input(title="MACD Slow Length", type=input.integer, defval=50)
cycleLength = input(title="Cycle Length", type=input.integer, defval=10)
d1Length = input(title="1st %D Length", type=input.integer, defval=3)
d2Length = input(title="2nd %D Length", type=input.integer, defval=3)
src = close
highlightBreakouts = input(title="Highlight Breakouts ?", type=input.bool, defval=true)

macd = ema(src, fastLength) - ema(src, slowLength)
k = nz(fixnan(stoch(macd, macd, macd, cycleLength)))
d = ema(k, d1Length)
kd = nz(fixnan(stoch(d, d, d, cycleLength)))
stc = ema(kd, d2Length)
stc := 	stc > 100 ? 100 : stc < 0 ? 0 : stc
stcColor = not highlightBreakouts ? (stc > stc[1] ? color.green : color.red) : #ff3013
stcPlot = plot(stc, title="STC", color=stcColor, transp=0)
upper = 75
lower = 25
transparent = color.new(color.white, 100)
upperLevel = plot(upper, title="Upper", color=color.gray)
hline(50, title="Middle", linestyle=hline.style_dotted)
lowerLevel = plot(lower, title="Lower", color=color.gray)

fill(upperLevel, lowerLevel, color=#f9cb9c, transp=90)

upperFillColor = stc > upper and highlightBreakouts ? color.green : transparent
lowerFillColor = stc < lower and highlightBreakouts ? color.red : transparent

fill(upperLevel, stcPlot, color=upperFillColor, transp=80)
fill(lowerLevel, stcPlot, color=lowerFillColor, transp=80)
strategy.initial_capital = 50000
ordersize=floor(strategy.initial_capital/close)
targetvalue = input(title="Target/stop", type=input.integer, defval=400)

ma1length = input(title="SMA1", type=input.integer, defval=35)
ma2length = input(title="SMA2", type=input.integer, defval=200)
ma1 = ema(close,ma1length)
ma2 = ema(close,ma2length)

bullbuy = crossover(stc, lower) and ma1>ma2 and close>ma1
bearsell = crossunder(stc, upper) and ma1<ma2 and close<ma1

if (bullbuy)
    strategy.entry("Riposte", strategy.long, ordersize)
    strategy.exit( "Riposte close", from_entry="Riposte", qty_percent=100, profit=targetvalue,loss=targetvalue)

if (bearsell)
    strategy.entry("Riposte", strategy.short, ordersize)
    strategy.exit( "Riposte close", from_entry="Riposte", qty_percent=100, profit=targetvalue,loss=targetvalue)

//plotshape(bullbuy,  title= "Purple", location=location.belowbar, color=#006600, transp=0, style=shape.circle, size=size.tiny, text="Riposte")
//plotshape(bearsell,  title= "Purple", location=location.abovebar, color=#006600, transp=0, style=shape.circle, size=size.tiny, text="Riposte")
Detail
https://www.fmz.com/strategy/435160
Last Modified
2023-12-12 17:43:19