
9.6 KiB
Name
震荡突破策略Zigzag-Breakout-Strategy
Author
ChaoZhang
Strategy Description
[trans]
概述
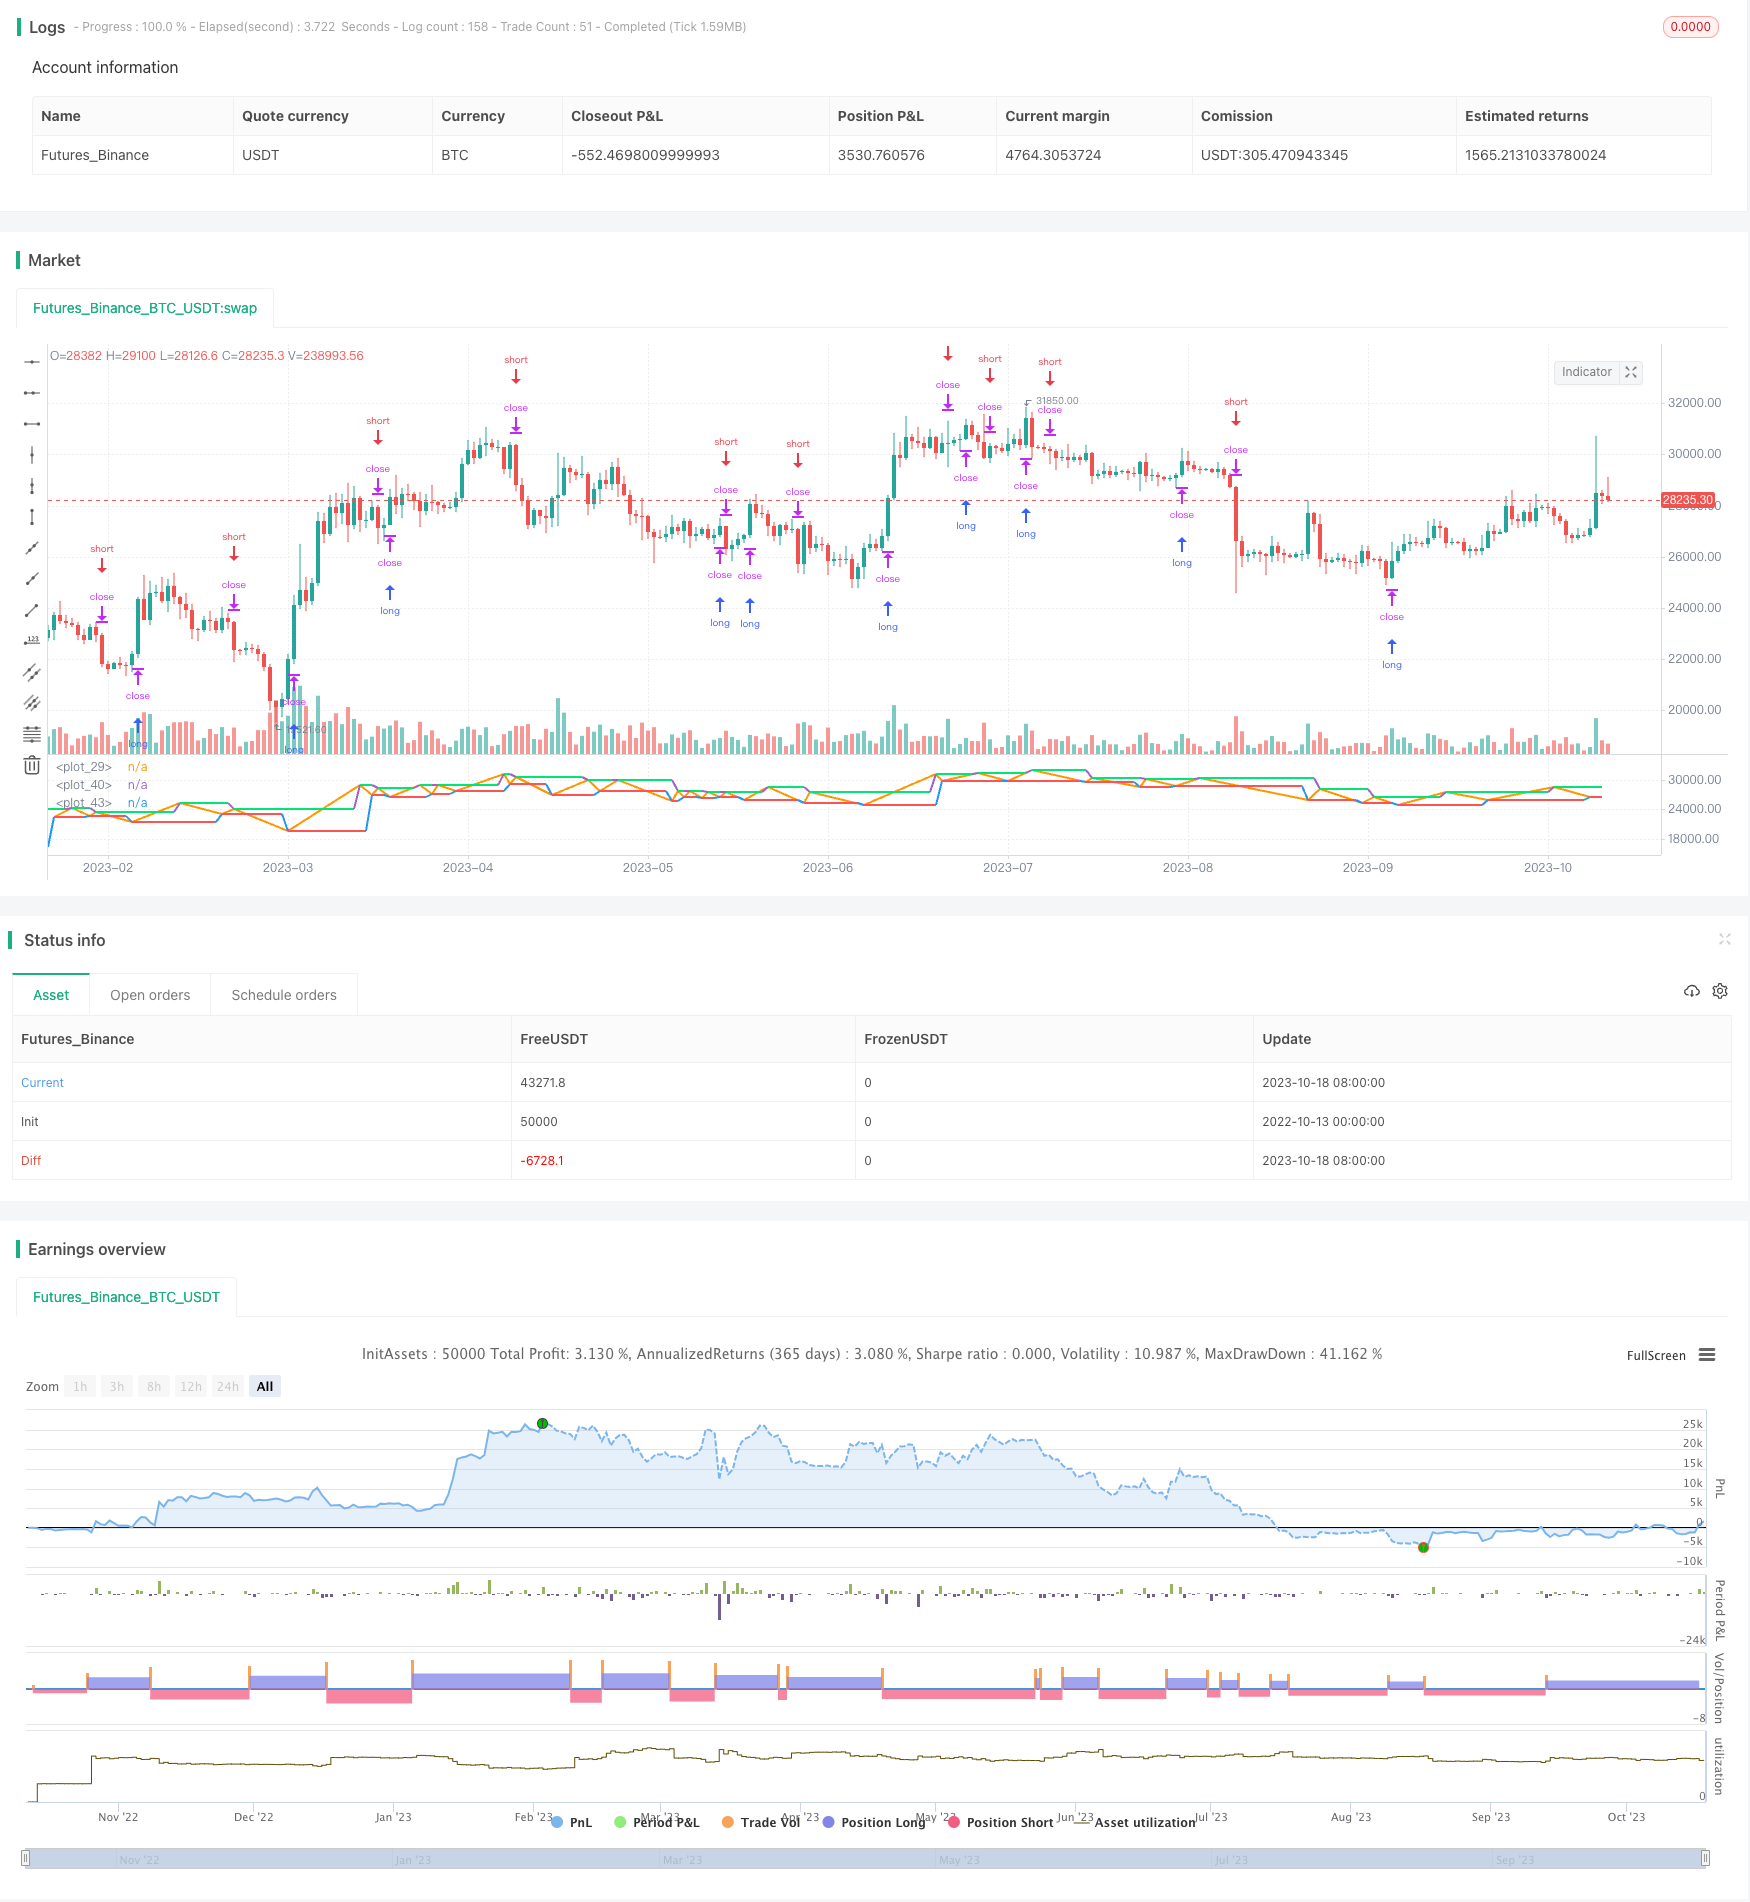
该策略利用ZigZag指标绘制支撑和阻力线,在价格突破支撑或阻力线时采取相应的做多或做空操作。
策略原理
该策略首先使用ZigZag指标在特定参数下绘制Z字形线。然后在ZigZag指标出现底部时画出绿色的支撑线,在出现顶部时画出红色的阻力线。当价格上穿绿线时做多,下穿红线时做空。
具体来说,该策略的核心逻辑是:
-
使用ema对close价格进行三次指数移动平均,得到平滑曲线_hls。
-
判断平滑曲线是否上升,如果上升且前一根K线未上升,记为底部,取这根K线的最低值。如果下降且前一根K线上升,记为顶部,取这根K线的最高值。否则为NaN。
-
重复此过程即得到ZigZag线zigzag。
-
当zigzag上升时,记为当前顶部点dot;当下降时,记为当前底部点dot。
-
在dot上升时,绘制绿色的支撑线uplevel;在dot下降时,绘制红色的阻力线dnlevel。
-
当价格上穿绿线时做多,下穿红线时做空。
优势分析
这种策略具有以下几点优势:
-
利用ZigZag指标识别关键支撑阻力位,这些位往往具有重要意义。
-
ZigZag抹掉市场中部分噪音,使交易信号更清晰。
-
采用突破方式进行入场,可以及时捕捉趋势的转折。
-
支撑阻力线的绘制方式简单有效。
-
策略逻辑清晰易懂,参数优化空间大。
-
可灵活选择交易品种和时间周期,适应性强。
风险分析
该策略也存在一些风险:
-
ZigZag指标参数设置不当可能导致错失交易机会。
-
支撑阻力位被突破后可能出现再测试,应设置止损来控制风险。
-
突破信号可能存在误导,应结合趋势和形态进行验证。
-
市场可能长期横盘震荡,这时策略会产生过多无效交易。
-
需要考虑交易成本的影响,避免过于频繁交易。
对应措施有:
-
优化ZigZag参数,找到最佳参数组合。
-
在突破后及时设置止损,控制单笔损失。
-
结合趋势指标等过滤信号,提高准确率。
-
加入条件来识别盘整市,在此期间不交易。
-
适当放宽突破幅度,减少无效交易。
优化方向
该策略可以从以下几个方面进行优化:
-
优化ZigZag参数,找到最佳参数组合。可以通过遍历回测找出最佳参数。
-
在突破入场后考虑再次测试支撑阻力位的可能性,设置再测试的退出逻辑。
-
结合趋势指标如MA等来过滤出现低概率的交易信号。
-
增加量能指标等来确认突破信号,避免出现的错误信号。
-
设置 Lachenbruch 提及的“dual手法”(同时做多做空),以过滤错误信号并获利。
-
考虑采用机器学习等算法来动态优化参数。
-
引入止损策略,设定止损点来控制风险。
总结
该策略总体来说是一个简单实用的震荡突破策略。它利用ZigZag指标绘制支撑和阻力线,在价格突破这些线时采取行动。策略具有较强的适应性,但也存在一定的风险。通过参数优化、信号过滤、风险控制等手段可以对策略进行改进。此类突破策略适合掌握市场节奏的活跃交易者。
||
Overview
This strategy uses the Zigzag indicator to draw support and resistance lines and takes long or short positions when the price breaks through the support or resistance lines.
Strategy Logic
The strategy first uses the Zigzag indicator to draw Zigzag lines under certain parameters. Green support lines are drawn when the Zigzag indicator bottoms out. Red resistance lines are drawn when the Zigzag tops out. Long positions are taken when the price breaks above the green line. Short positions are taken when the price breaks below the red line.
Specifically, the core logic is:
-
Use ema to smooth the close price with triple exponential moving averages, obtaining the smoothed curve _hls.
-
Judge if the smoothed curve is rising. If rising and the previous bar was not rising, it is considered a bottom. Take the lowest price of this bar. If falling and the previous bar was rising, it is considered a top. Take the highest price of this bar. Otherwise NaN.
-
Repeat this process to obtain the Zigzag line zigzag.
-
When zigzag rises, record the current peak dot. When falling, record the current trough dot.
-
Draw the green support line uplevel when dot rises. Draw the red resistance line dnlevel when dot falls.
-
Take long position when price breaks above green line. Take short position when price breaks below red line.
Advantage Analysis
The advantages of this strategy include:
-
Identify key support/resistance levels using Zigzag indicator. These levels are often significant.
-
Zigzag filters out some market noise, generating clearer trading signals.
-
Enter positions by breakout, which can timely capture trend reversals.
-
Simple and effective way to draw support/resistance lines.
-
Clear logic and large parameter optimization space.
-
Flexibility in choosing products and timeframes. Strong adaptability.
Risk Analysis
Risks of this strategy:
-
Improper Zigzag parameters may miss trading opportunities.
-
Prices may retest support/resistance after breakout. Use stop loss to control risks.
-
Breakout signals may be misleading. Need validation with trends and patterns.
-
Prolonged sideways may generate excessive ineffective trades.
-
Consider transaction costs. Avoid overly frequent trading.
Solutions:
-
Optimize Zigzag parameters to find best combination.
-
Set timely stop loss after breakout to limit losses.
-
Add filters like trend indicators to improve accuracy.
-
Identify sideways and avoid trading during these periods.
-
Relax breakout range to reduce ineffective trades.
Optimization Directions
The strategy can be optimized in the following aspects:
-
Optimize Zigzag parameters by backtesting to find optimum.
-
Consider the possibility of retesting support/resistance after breakout. Add exit logic for retest scenarios.
-
Add filters like MA to screen out low probability signals.
-
Incorporate volume indicators to confirm breakout signals.
-
Implement Lachenbruch's dual methodology (long and short) to filter incorrect signals and profit.
-
Use machine learning to dynamically optimize parameters.
-
Introduce stop loss strategy to limit risks.
Conclusion
In summary, this is a simple and practical oscillation breakout strategy. It draws support/resistance using Zigzag and trades breakouts. The strategy is adaptive but with some risks. Optimization on parameters, signal filters and risk control can improve it. Such breakout strategies suit active traders who can grasp market rhythm.
[/trans]
Strategy Arguments
| Argument | Default | Description |
|---|---|---|
| v_input_1 | true | Long |
| v_input_2 | true | Short |
| v_input_3 | 100 | Capital, % |
| v_input_4 | 4 | ZigZag length |
| v_input_5 | 4 | ZigZag extreme |
| v_input_6_close | 0 | Source: close |
| v_input_7 | false | Show ZigZag |
| v_input_8 | 1900 | From Year |
| v_input_9 | 2100 | To Year |
| v_input_10 | true | From Month |
| v_input_11 | 12 | To Month |
| v_input_12 | true | From day |
| v_input_13 | 31 | To day |
Source (PineScript)
/*backtest
start: 2022-10-13 00:00:00
end: 2023-10-19 00:00:00
period: 1d
basePeriod: 1h
exchanges: [{"eid":"Futures_Binance","currency":"BTC_USDT"}]
*/

//Noro
//2018

//@version=3
// strategy(title = "Noro's ZZ-2 Strategy", shorttitle = "Noro's ZZ-2 Strategy", overlay = true, default_qty_type = strategy.percent_of_equity, default_qty_value = 100, pyramiding = 0)

//Settings
needlong = input(true, defval = true, title = "Long")
needshort = input(true, defval = true, title = "Short")
capital = input(100, defval = 100, minval = 1, maxval = 10000, title = "Capital, %")
length = input(4, title = "ZigZag length")
Extreme = input(4, title = "ZigZag extreme")
src = input(close, title = "Source")
showzz = input(false, defval = false, title = "Show ZigZag")
fromyear = input(1900, defval = 1900, minval = 1900, maxval = 2100, title = "From Year")
toyear = input(2100, defval = 2100, minval = 1900, maxval = 2100, title = "To Year")
frommonth = input(01, defval = 01, minval = 01, maxval = 12, title = "From Month")
tomonth = input(12, defval = 12, minval = 01, maxval = 12, title = "To Month")
fromday = input(01, defval = 01, minval = 01, maxval = 31, title = "From day")
today = input(31, defval = 31, minval = 01, maxval = 31, title = "To day")

//ZigZag
f_zz(_length, _detection)=>
    _hls = ema(ema(ema(src, _length), round(_length*0.66)), round(_length*0.33))
    _isRising = _hls >= _hls[1]
    _zigzag = _isRising and not _isRising[1] ? lowest(_detection) :  not _isRising and _isRising[1] ? highest(_detection) : na
zigzag = f_zz(length, Extreme)
zzcol = showzz ? black : na
plot(zigzag, color = zzcol, linewidth = 2)

//Levels
dot = 0.0
dot := zigzag > 0 ? zigzag : dot[1]
uplevel = 0.0
uplevel := dot > dot[1] ? zigzag : uplevel[1]
dnlevel = 0.0
dnlevel := dot < dot[1] ? zigzag : dnlevel[1]
upcol = na
upcol := dot > dot[1] ? na : lime
plot(uplevel, color = upcol, linewidth = 2)
dncol = na
dncol := dot < dot[1] ? na : red
plot(dnlevel, color = dncol, linewidth = 2)

//Trading
lot = 0.0
lot := strategy.position_size != strategy.position_size[1] ? strategy.equity / close * capital / 100 : lot[1]
if dot > 0
    strategy.entry("Long", strategy.long, needlong == false ? 0 : lot, stop = uplevel)
    strategy.entry("Short", strategy.short, needshort == false ? 0 : lot, stop = dnlevel)
Detail
https://www.fmz.com/strategy/429776
Last Modified
2023-10-20 16:37:28