
7.8 KiB
Name
震荡突破策略Reversal-Breakout-Strategy
Author
ChaoZhang
Strategy Description
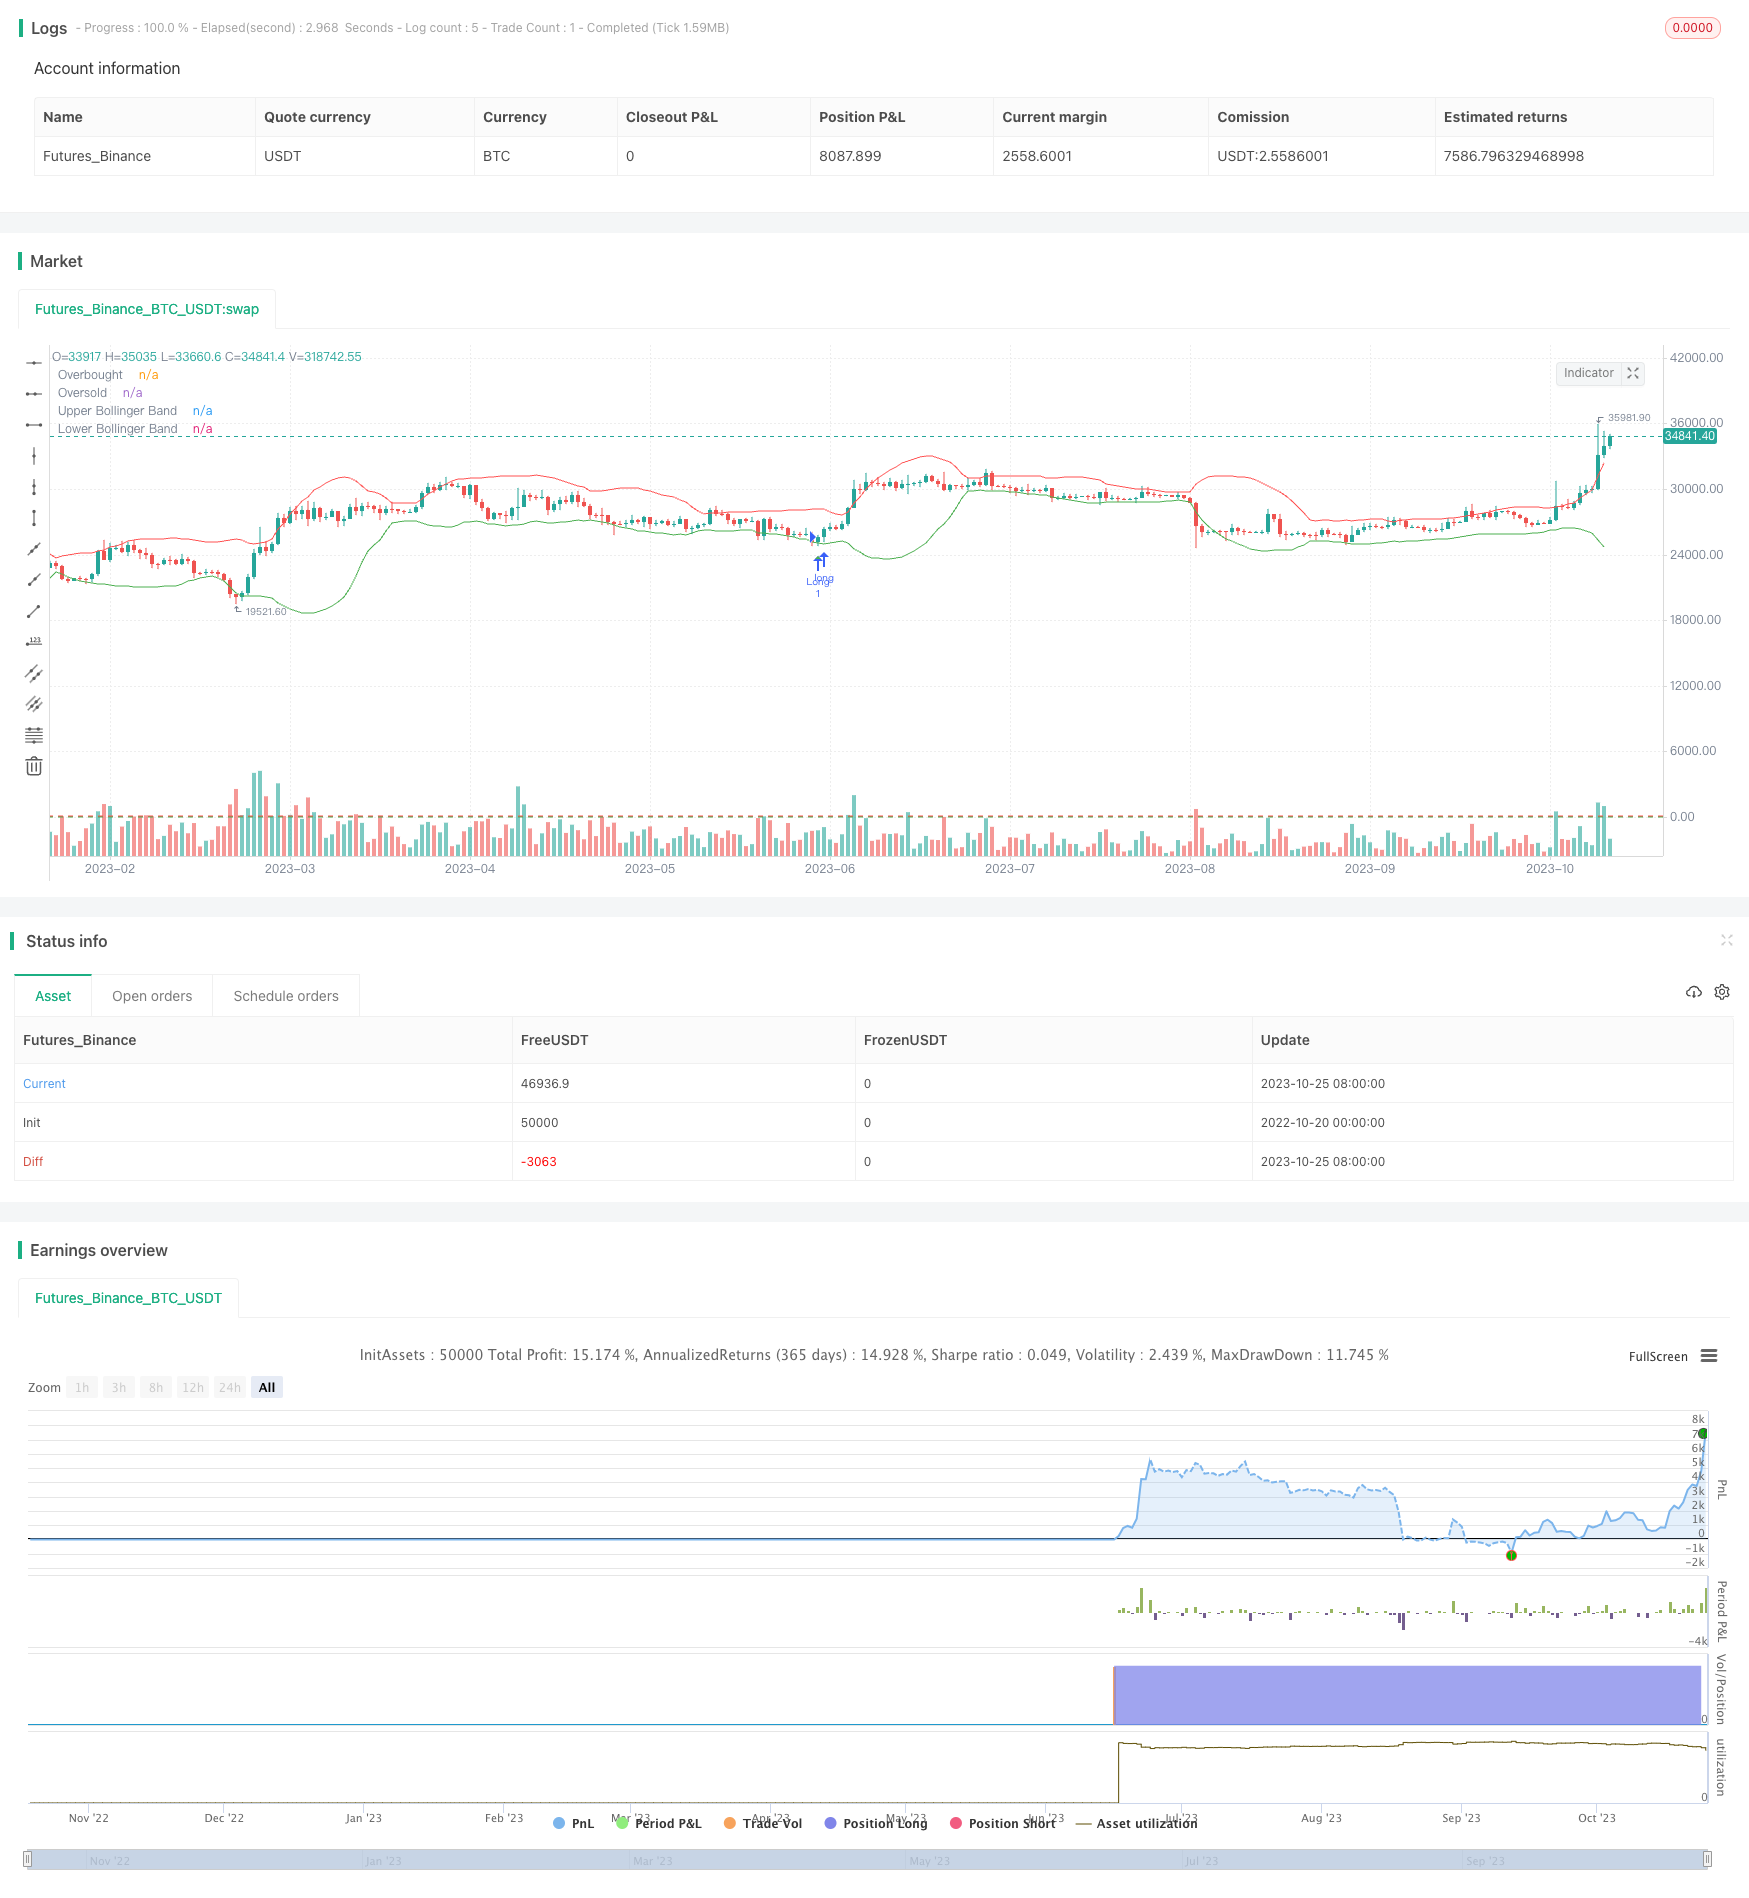 [trans]
概述
震荡突破策略运用布林带和随机指标,识别资产价格达到超买超卖区域时的潜在反转点,适合日内交易者利用小幅价格波动获利。该策略主要思想是在特定资产价格突破布林带上下轨,且随机指标显示超买超卖信号时,寻找交易机会。
策略原理
该策略同时使用布林带和随机指标作为主要技术指标。布林带通过计算指定周期(如20天)的均线及标准差,得到上轨和下轨。价格到达上轨时被认为超买,到达下轨时被认为超卖。随机指标RSI则判断价格是否过度超买或超卖。RSI低于20时为超卖,高于80时为超买。
具体交易策略是:当价格突破布林带下轨,同时随机指标RSI低于20时,做多;当价格突破布林带上轨,同时随机指标RSI高于80时,做空。做多时的止损价格设在当前K线低点之下若干点,做空止损价格设在当前K线高点之上若干点。目标利润设在最近几根K线平均波动点数之外。
代码通过交叉函数实现布林带轨道突破判断,RSI高低位判断,并绘制形状标记突破信号。进场后设置止损和止盈,跟踪价格变动退出。
优势分析
该策略结合布林带判定支撑压力区域,和RSI判断超买超卖区域,可以提高交易信号质量。相比单一指标,可以减少错误信号。
利用K线突破布林带上下轨道,配合RSI过滤,可以捕捉反转机会。这类反转交易潜在获利空间较大。
止损距离较小,有利于控制单笔损失。止盈根据平均波动设定,可以较好平衡获利大小。
该策略交易频次较高,适合日内短线交易,可以充分利用小范围市场波动获利。
风险分析
布林带轨道突破假设价格会发生回归均线的反转,但部分突破可能是假突破,无法形成趋势反转。这会导致亏损。
RSI具有滞后性,可能出现提前触发超买超卖信号,从而错过部分交易机会的情况。
止损距离较小,追求控制单笔损失,但也限制了单笔盈利空间。
高频交易需要较强心理质量,过于频繁止损可能影响总体盈利。
优化方向
可以测试调整布林带参数,如增大周期长度,来提高突破信号质量。
可以尝试以K线收盘价突破布林带作为信号,而不是直接突破判定,减少假突破。
可以结合其他指标如MACD、KD等与RSI形成组合,提升超买超卖判定的准确性。
可以根据不同品种特点设定动态止损距离,而不是固定点数止损。
总结
该策略整合布林带判定支撑压力区域,和RSI指标判断超买超卖区域,在理论上可以较好发现反转机会。实际操作中,关键是找到合适的参数配置,控制风险,持续优化。
||
Overview
The reversal breakout strategy utilizes Bollinger Bands and Stochastic Oscillator to identify potential reversal points when an asset is overbought or oversold. It is suitable for intraday traders to capitalize on small price fluctuations for profits. The main idea is to look for trading opportunities when the price breaks out of the Bollinger Bands and Stochastic shows overbought/oversold signals.
Strategy Logic
The strategy uses both Bollinger Bands and Stochastic as the main technical indicators. Bollinger Bands are plotted at standard deviation levels above and below a simple moving average. Prices reaching the upper band are considered overbought while lower band oversold. Stochastic Oscillator determines if prices have moved too far and are due for a reversal. Readings above 80 suggest overbought conditions while below 20 oversold.
The trading rules are: go long when price breaks below the lower Bollinger band and Stochastic is below 20; go short when price breaks above the upper band and Stochastic is above 80. The stop loss is placed a few pips below the low (for longs) or above the high (for shorts). Take profit target is set at average price swing beyond recent bars.
The crossovers identify the band breakouts. Shape markers plot the entry signals. Stops and profit targets are defined after entry.
Advantages
Combining bands for support/resistance and Stochastic for overbought/oversold improves signal quality vs. a single indicator. Reversal trading after band breakouts has potential for larger gains.
The tight stop loss helps limit losses. Take profit based on average true range aims for balanced reward/risk. High frequency trading captures small moves.
Risks
Band breakouts assume mean reversion which may fail. Stochastic lags price so some moves may be missed.
Small stops restrain the profit potential. Frequent trading needs strong psychology - avoiding over-stopping.
Enhancements
Test longer Bollinger periods or confirm closes outside bands to improve quality.
Combine other indicators like MACD and KD with Stochastic for better overbought/oversold signals.
Consider dynamic stops based on volatility instead of fixed pips.
Conclusion
The strategy seeks to identify reversals by combining Bollinger Bands for support/resistance and Stochastic for overbought/oversold conditions. Fine tuning parameters, controlling risk, and ongoing optimization are key for real-world performance. Transaction costs should be considered. Past performance is no guarantee of future results.
[/trans]
Strategy Arguments
| Argument | Default | Description |
|---|---|---|
| v_input_1 | 20 | Bollinger Bands Length |
| v_input_2_close | 0 | Source: close |
| v_input_3 | 2 | Multiplier |
| v_input_4 | 14 | Stochastic Length |
| v_input_5 | 5 | Stochastic %K Smoothing |
| v_input_6 | 3 | Stochastic %D Smoothing |
| v_input_7 | 50 | Take Profit (pips) |
| v_input_8 | 3 | Stop Loss (pips) |
Source (PineScript)
/*backtest
start: 2022-10-20 00:00:00
end: 2023-10-26 00:00:00
period: 1d
basePeriod: 1h
exchanges: [{"eid":"Futures_Binance","currency":"BTC_USDT"}]
*/

//@version=4
strategy("Bollinger Bands & Stochastic Scalping Strategy", shorttitle="BB & Stoch Scalp", overlay=true)

// Bollinger Bands
length = input(20, title="Bollinger Bands Length")
src = input(close, title="Source")
mult = input(2, title="Multiplier")
basis = sma(src, length)
dev = mult * stdev(src, length)
upperBB = basis + dev
lowerBB = basis - dev

// Stochastic
stochLength = input(14, title="Stochastic Length")
smoothK = input(5, title="Stochastic %K Smoothing")
smoothD = input(3, title="Stochastic %D Smoothing")
k = sma(stoch(close, high, low, stochLength), smoothK)
d = sma(k, smoothD)

// Entry Conditions
longCondition = crossover(close, lowerBB) and crossover(k, 20)
shortCondition = crossunder(close, upperBB) and crossunder(k, 80)

// Exit Conditions
takeProfit = input(50, title="Take Profit (pips)")

plotshape(series=longCondition, title="Long Entry Signal", location=location.belowbar, color=color.green, style=shape.triangleup, size=size.small)
plotshape(series=shortCondition, title="Short Entry Signal", location=location.abovebar, color=color.red, style=shape.triangledown, size=size.small)

// Stop Loss
stopLossPips = input(3, title="Stop Loss (pips)")
stopLossLong = close - stopLossPips * syminfo.mintick
stopLossShort = close + stopLossPips * syminfo.mintick

strategy.entry("Long", strategy.long, when=longCondition)
strategy.entry("Short", strategy.short, when=shortCondition)

strategy.exit("Take Profit/Stop Loss", from_entry="Long", profit=takeProfit, stop=stopLossLong)
strategy.exit("Take Profit/Stop Loss", from_entry="Short", profit=takeProfit, stop=stopLossShort)

plot(upperBB, title="Upper Bollinger Band", color=color.red)
plot(lowerBB, title="Lower Bollinger Band", color=color.green)

hline(80, "Overbought", color=color.red)
hline(20, "Oversold", color=color.green)
Detail
https://www.fmz.com/strategy/430368
Last Modified
2023-10-27 16:14:16