
8.9 KiB
Name
震荡突破策略Breakout-Swing-Strategy
Author
ChaoZhang
Strategy Description
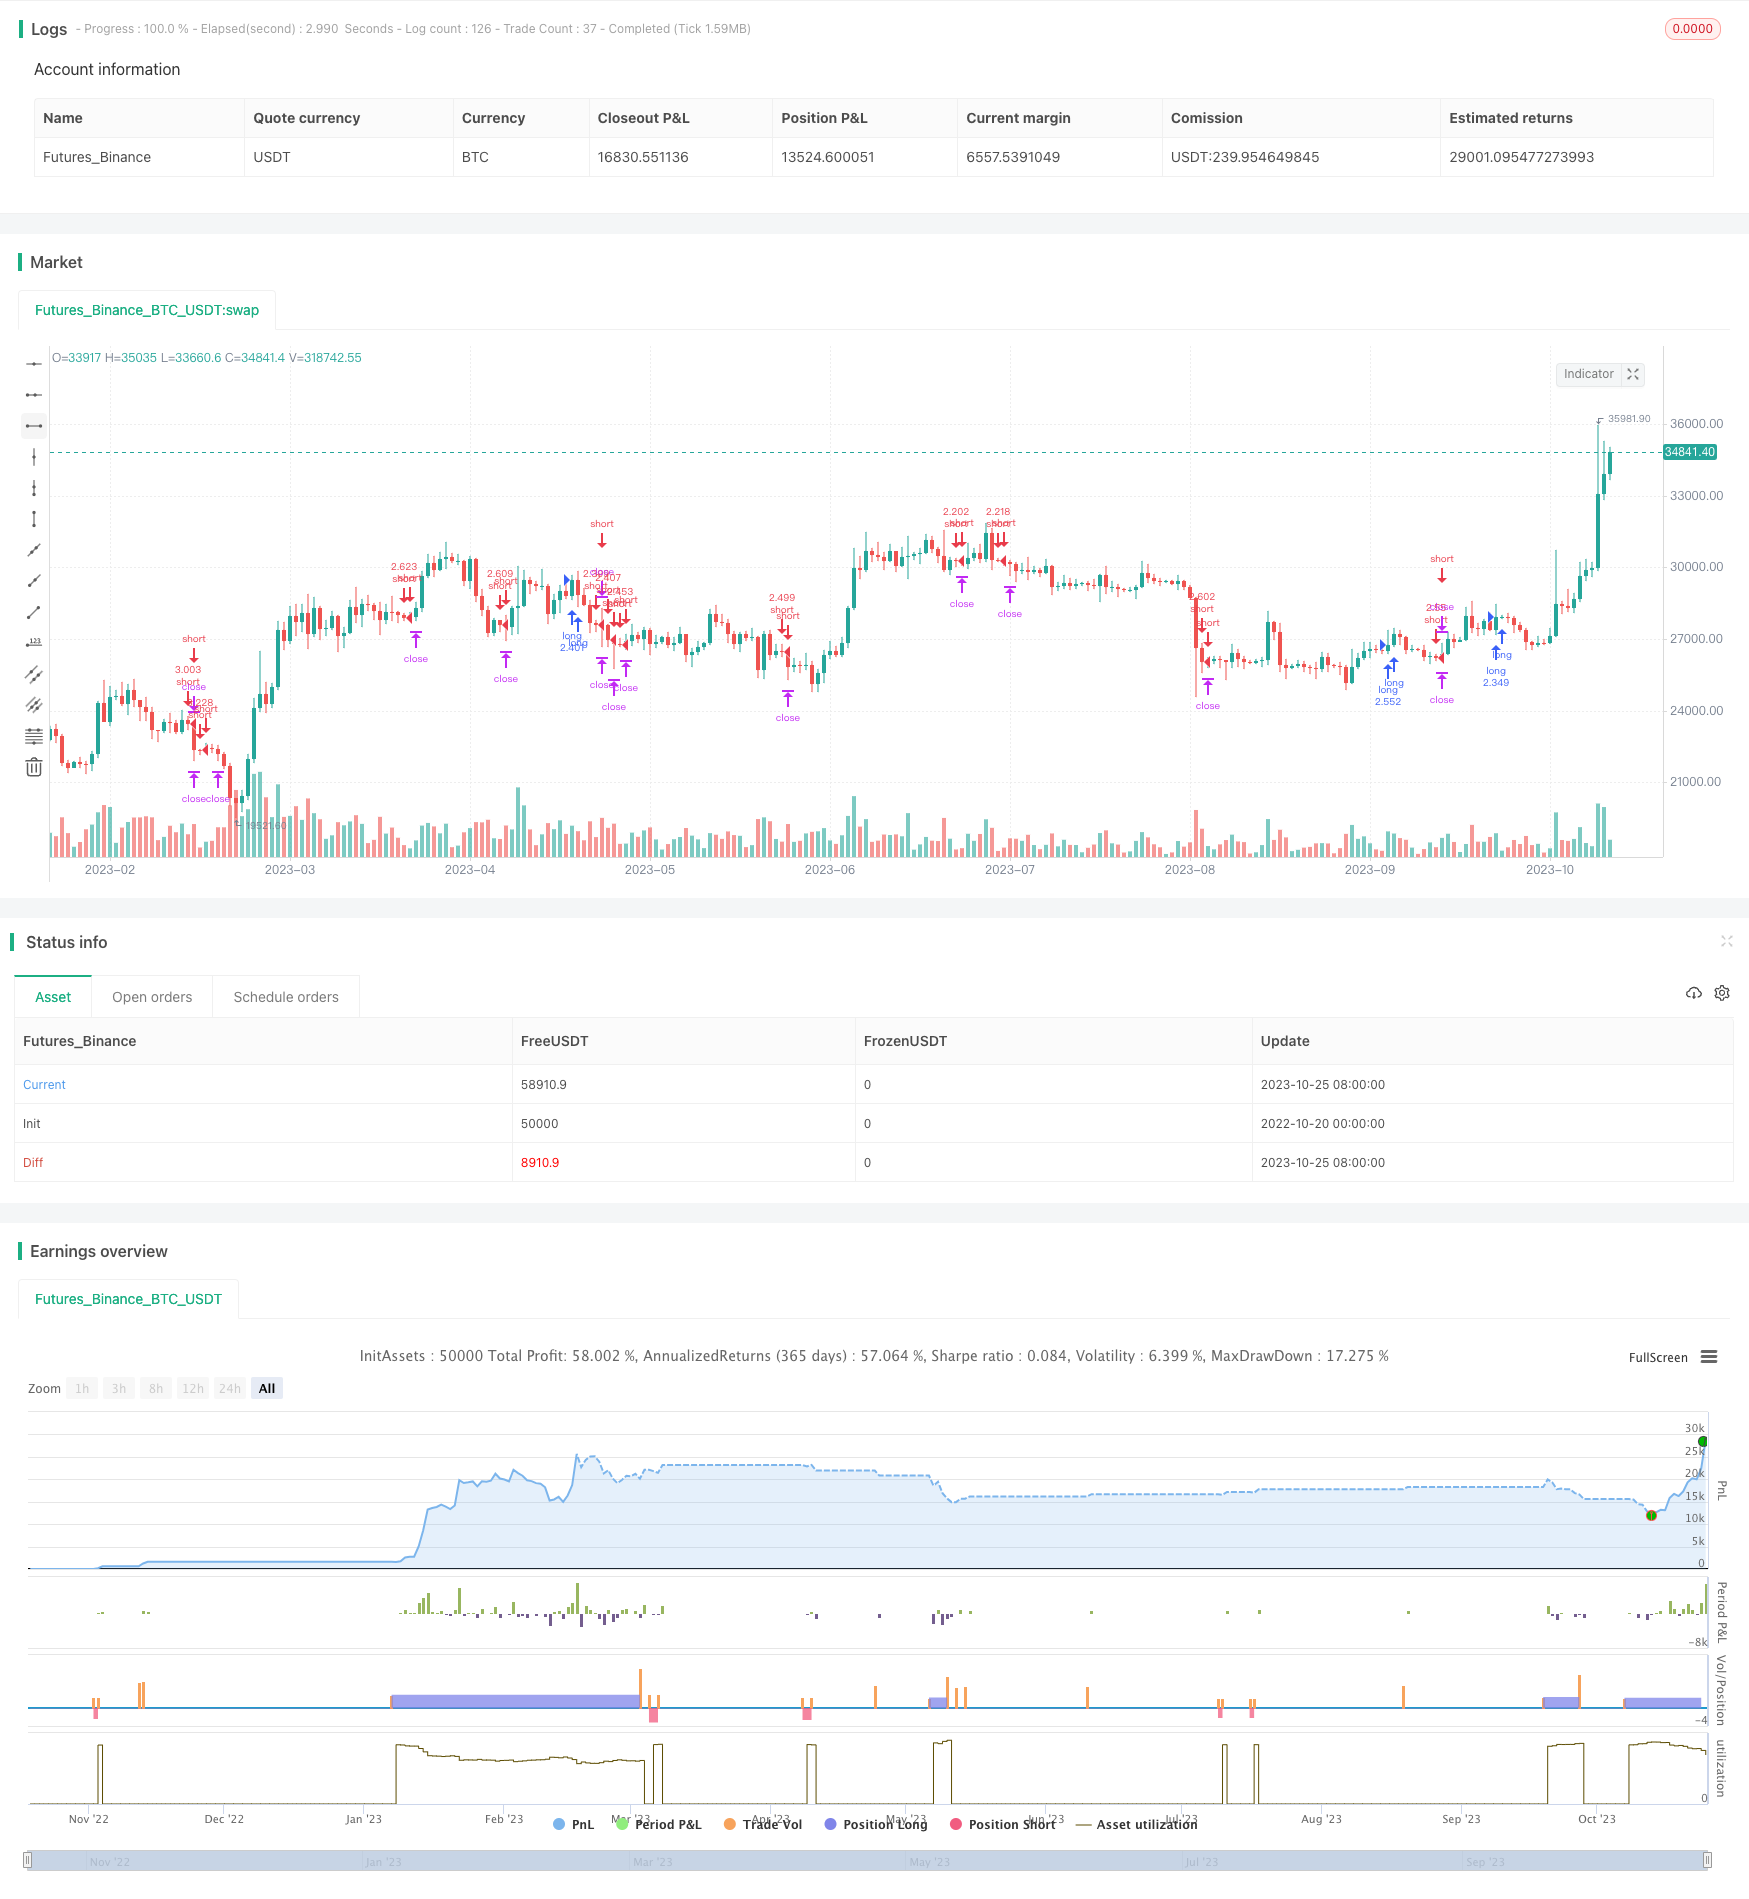
[trans]
概述
这个策略主要利用K线的震荡区间和趋势判断来寻找入场机会。它会在价格突破前一根K线的高点或低点时发出交易信号。在趋势向上时,当价格突破高点时做多;当趋势向下时,价格突破低点时做空。
策略原理
这个策略主要基于两点:
-
Klinger 振荡器判断趋势方向。当指标大于0时表示多头趋势,小于0时表示空头趋势。
-
价格突破前一根K线的最高价或最低价。在多头趋势下突破最高价做多,空头趋势下突破最低价做空。
具体来说,策略的入场逻辑如下:
多头入场:
- 当前K线高点大于前一K线高点
- 当前K线低点小于前一K线低点
- Klinger 振荡器大于0,表示多头趋势
- 当前K线收盘价上穿Hull移动平均线
- 当前K线为多头K线(收盘价高于开盘价)
空头入场:
- 当前K线高点小于前一K线高点
- 当前K线低点大于前一K线低点
- Klinger 振荡器小于0,表示空头趋势
- 当前K线收盘价下穿Hull移动平均线
- 当前K线为空头K线(收盘价低于开盘价)
在入场后,止损或止盈价格根据入场价格的一定百分比设置。
优势分析
该策略的主要优势有:
-
能够在趋势发生转折时及时捕捉机会,增强获利概率。
-
使用Klinger 振荡器判断趋势方向,避免在震荡市场无方向交易。
-
结合移动平均线过滤假突破。
-
风险可控,止损止盈设置合理。
风险分析
该策略主要风险有:
-
在震荡行情中,可能出现较多止损。
-
移动平均线参数设置不当可能导致误判。
-
突破失败可能形成回调损失。
-
趋势反转时,亏损可能扩大。
-
交易频繁,手续费用成本较高。
可以通过优化参数,寻找更合适的移动平均线期数来减少误判。合理设置止损距离,控制单笔损失。寻找交易行情趋势明显的品种进行交易。适当减少交易频率等方法可以控制风险。
优化方向
该策略可以从以下几个方面进行优化:
-
优化移动平均线参数,找到平滑程度更高的参数,减少噪音。
-
测试不同的指标来判断趋势,寻找更可靠的判断指标。
-
优化止损止盈策略,使其更符合市场统计特性。
-
增加趋势过滤,避免震荡行情的虚假突破。
-
增加交易时间和品种过滤,选择交易时段和品种。
-
研究不同时间周期的参数设置。
总结
这个策略整体来说是一个较简单实用的突破策略。它优点是风险可控,通过指标判断可避免无方向交易。但需要注意防止震荡市场的假突破和及时止损。通过参数优化和增强指标可靠性,可以进一步提高策略顺利率。该策略适用于趋势较明显的市场,如果用在具有较强震荡的品种和时间周期上,效果可能会打折扣。
||
Overview
This strategy mainly uses the price swing range and trend judgment of K-line to find trading opportunities. It will send trading signals when the price breaks through the high or low points of the previous K-line. When the trend goes up, go long when the price breaks through the high point; When the trend goes down, go short when the price breaks through the low point.
Strategy Principle
This strategy is mainly based on two points:
-
Klinger Oscillator to judge the trend direction. When the indicator is greater than 0, it indicates a bullish trend, and when it is less than 0, it indicates a bearish trend.
-
The price breaks through the highest price or the lowest price of the previous K-line. Go long in an uptrend when breaking through the highest price, and go short in a downtrend when breaking through the lowest price.
Specifically, the entry logic of the strategy is as follows:
Long entry:
- The current K-line high point is greater than the previous K-line high point
- The current K-line low point is less than the previous K-line low point
- Klinger Oscillator is greater than 0, indicating a bullish trend
- The close price of the current K-line crosses above the Hull moving average
- The current K-line is a bullish K-line (close price is higher than open price)
Short entry:
- The current K-line high point is less than the previous K-line high point
- The current K-line low point is greater than the previous K-line low point
- Klinger Oscillator is less than 0, indicating a bearish trend
- The close price of the current K-line crosses below the Hull moving average
- The current K-line is a bearish K-line (close price is lower than open price)
After entering the market, the stop loss or take profit price is set according to a certain percentage of the entry price.
Advantage Analysis
The main advantages of this strategy are:
-
Able to capture opportunities in time when trend turns. Increase profit probability.
-
Use Klinger Oscillator to determine trend direction, avoid trading without direction in oscillating market.
-
Combine moving average to filter false breakout.
-
Controllable risks, reasonable stop loss and take profit.
Risk Analysis
The main risks of this strategy are:
-
There may be more stop loss in oscillating market.
-
Improper moving average parameter setting may cause misjudgment.
-
Failed breakout may lead to pullback loss.
-
Loss may expand when trend reverses.
-
Frequent trading, high commission costs.
Risks can be controlled by optimizing parameters to find more suitable moving average periods to reduce misjudgment. Set reasonable stop loss distance to control single loss. Trade varieties with obvious trend. Appropriately reduce trading frequency.
Optimization Directions
This strategy can be optimized in the following aspects:
-
Optimize moving average parameters to find parameters with higher smoothness to reduce noise.
-
Test different indicators to determine the trend and find more reliable determination indicators.
-
Optimize stop loss and take profit strategies to make them more in line with market statistical characteristics.
-
Increase trend filtering to avoid false breakouts in oscillating markets.
-
Add trading time and variety filtering to select trading hours and varieties.
-
Research parameter settings for different time cycles.
Summary
In general, this is a relatively simple and practical breakout strategy. Its advantages are controllable risks and avoid directionless trading by using indicators. But need to pay attention to prevent false breakout in oscillating market and timely stop loss. Further improve the strategy success rate through parameter optimization and enhancing indicator reliability. This strategy is suitable for markets with obvious trends. If used in varieties and time cycles with stronger oscillation, the results may be compromised.
[/trans]
Strategy Arguments
| Argument | Default | Description |
|---|---|---|
| v_input_1 | 27 | Length |
| v_input_2_close | 0 | Source: close |
| v_input_3 | 0.006 | Take profit % for long |
| v_input_4 | 0.012 | Stop loss % for long |
| v_input_5 | 0.0075 | Take profit % for short |
| v_input_6 | 0.015 | Stop loss % for short |
Source (PineScript)
/*backtest
start: 2022-10-20 00:00:00
end: 2023-10-26 00:00:00
period: 1d
basePeriod: 1h
exchanges: [{"eid":"Futures_Binance","currency":"BTC_USDT"}]
*/

// This source code is subject to the terms of the Mozilla Public License 2.0 at https://mozilla.org/MPL/2.0/
// © exlux99

//@version=4
strategy("Advanced OutSide Forex strategy", overlay = true, default_qty_type = strategy.percent_of_equity, default_qty_value = 100, calc_on_every_tick = true, commission_type = strategy.commission.percent, commission_value = 0.0)

sv = change(hlc3) >= 0 ? volume : -volume
kvo = ema(sv, 34) - ema(sv, 55)
sig = ema(kvo, 13)

length = input(title="Length", type=input.integer, defval=27)
src = input(close, title="Source")
lsma = hma(src, length)

if (high > high[1] and low < low[1])
	if (close > open and kvo>0 and lsma<close)
		strategy.entry("long", strategy.long, comment="long")
if (high < high[1] and low > low[1])
	if (close < open and kvo<0 and lsma>close)
		strategy.entry("short", strategy.short, comment="short")

tplong=input(0.006, step=0.001, title="Take profit % for long")
sllong=input(0.012, step=0.001, title="Stop loss % for long")
tpshort=input(0.0075, step=0.001, title="Take profit % for short")
slshort=input(0.015, step=0.001, title="Stop loss % for short")


strategy.exit("short_tp/sl", "long", profit=close * tplong / syminfo.mintick, loss=close * sllong / syminfo.mintick, comment='LONG EXIT',  alert_message = 'closeshort')
strategy.exit("short_tp/sl", "short", profit=close * tpshort / syminfo.mintick, loss=close * slshort / syminfo.mintick, comment='SHORT EXIT',  alert_message = 'closeshort')
Detail
https://www.fmz.com/strategy/430373
Last Modified
2023-10-27 16:26:33