
8.3 KiB
Name
阳光超级趋势策略Sunny-Supertrend-Strategy
Author
ChaoZhang
Strategy Description
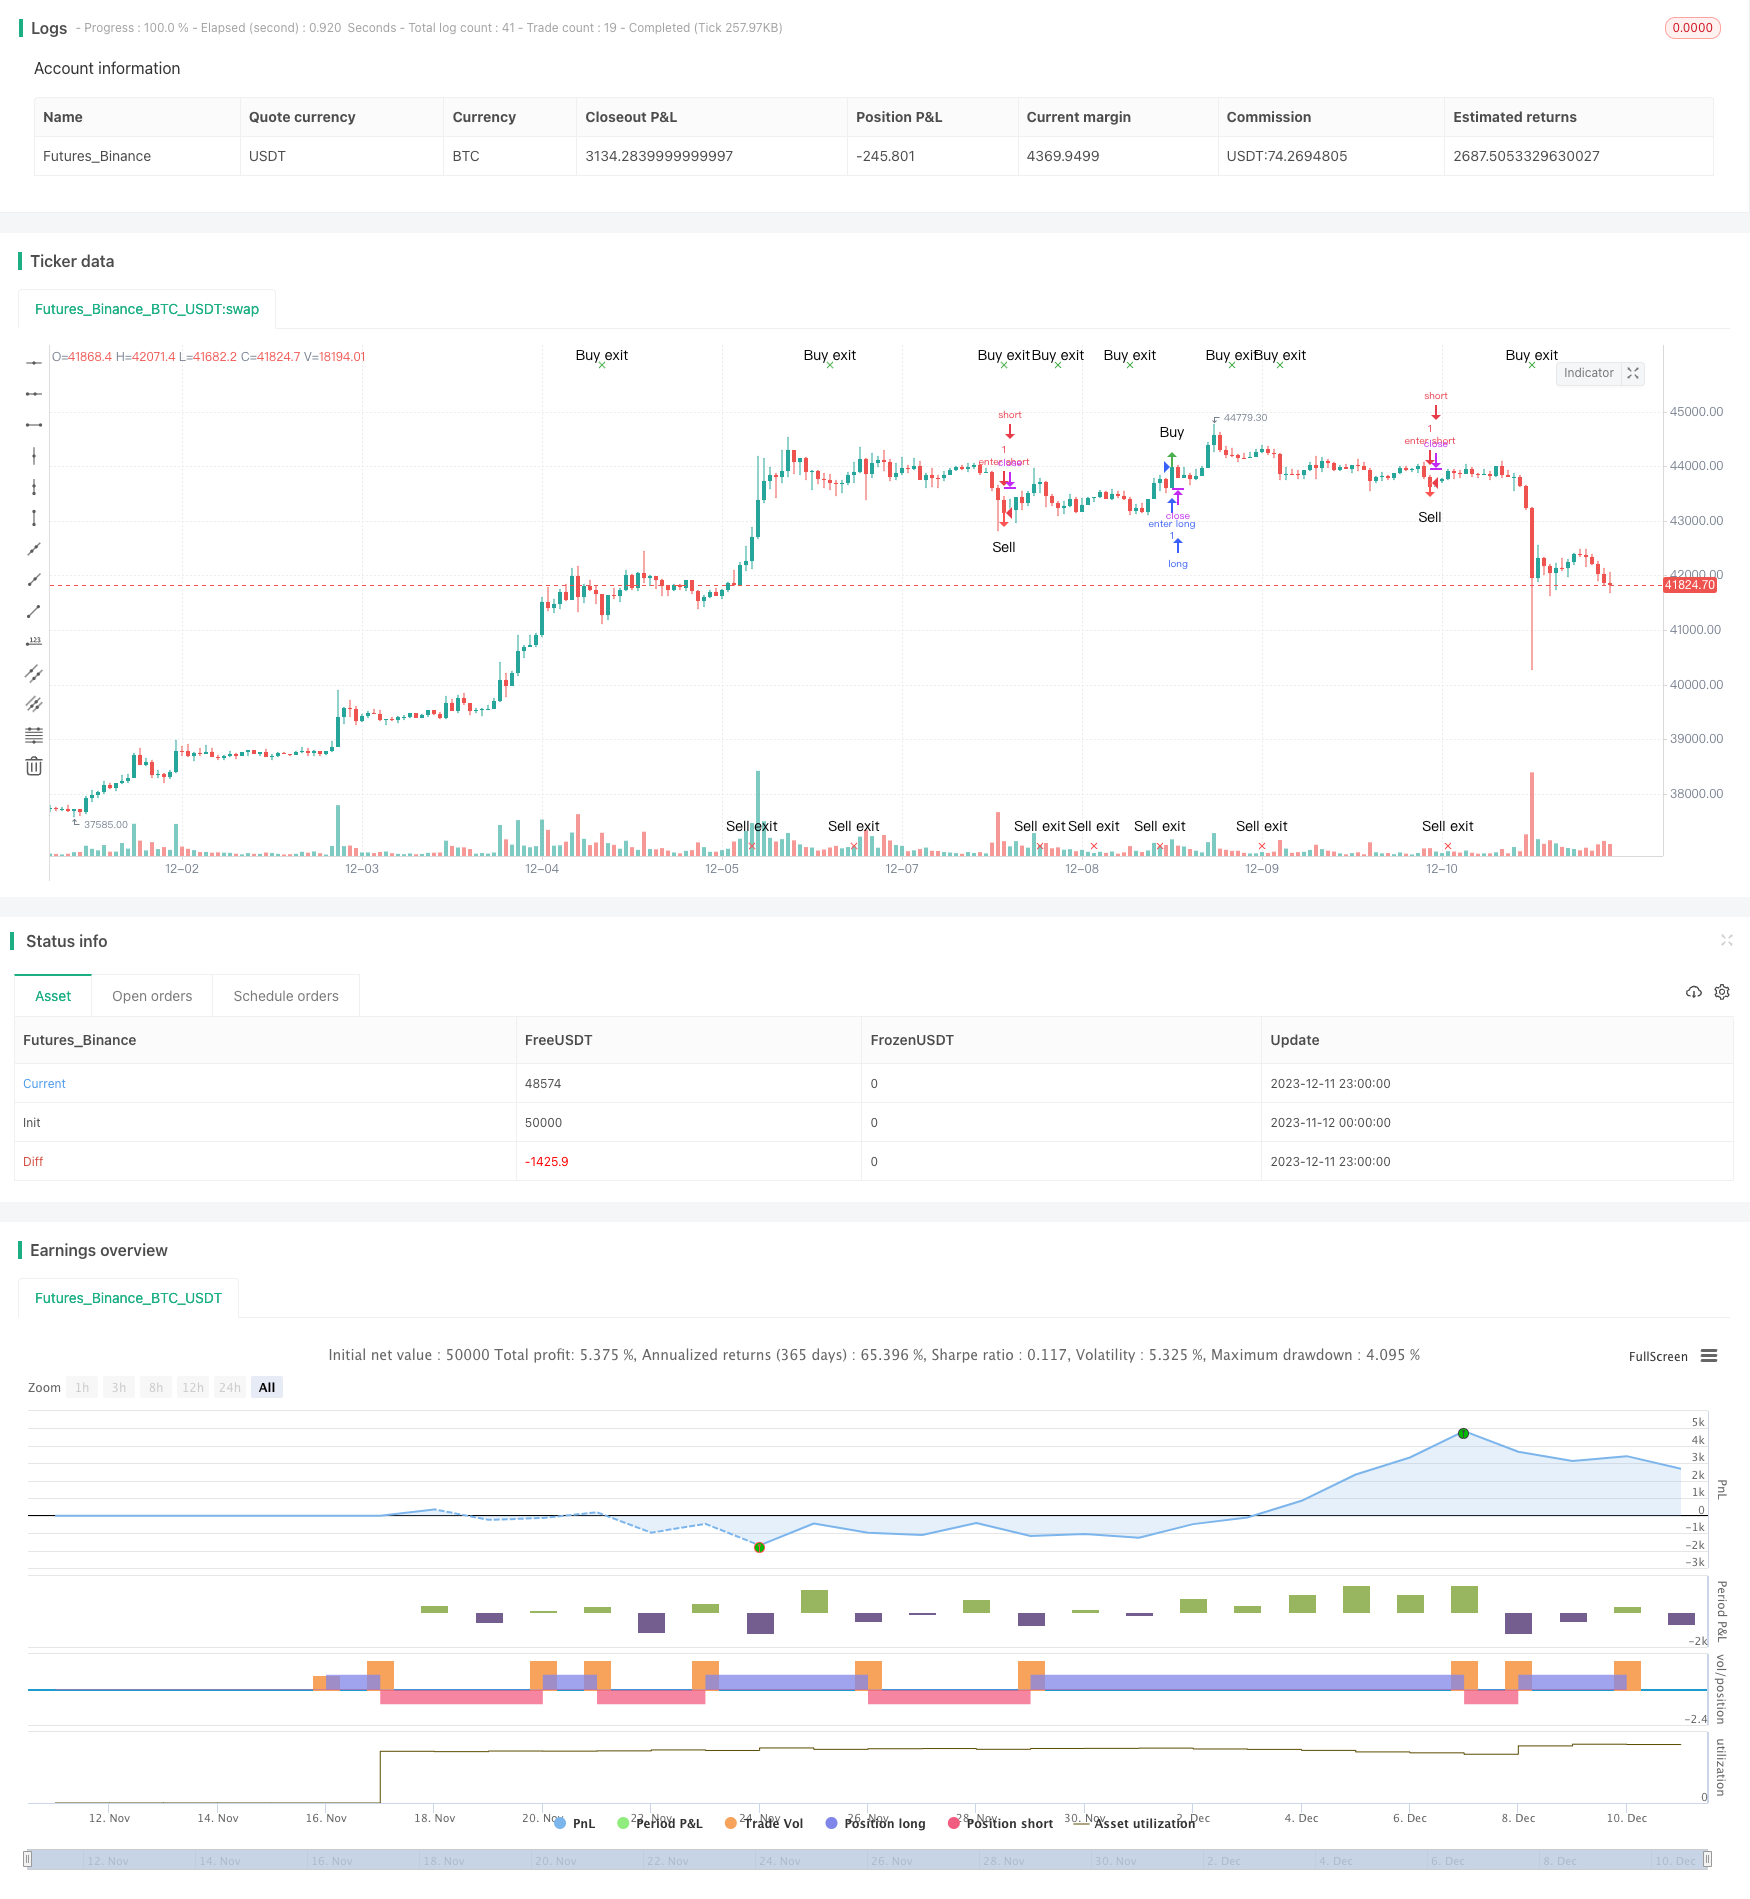 [trans]
概述
阳光超级趋势策略是一种基于ATR和SuperTrend指标的趋势跟踪策略。它可以准确预测趋势反转,非常适合作为时序指标使用。该策略可以增强投资者的耐心和定力,帮助它们在合适的时机进入和退出市场。
策略原理
该策略使用SuperTrend指标判断当前趋势方向。当SuperTrend指标发生方向变化时,我们认为可能发生了趋势反转。此外,策略还使用K线实体的方向进行辅助判断。当潜在反转信号出现而K线实体的方向与此前一致时,过滤掉无效信号。
具体来说,策略根据以下逻辑生成交易信号:
- 使用SuperTrend指标判断主要趋势方向
- 当SuperTrend指标方向发生变化时,产生潜在反转信号
- 如果此时K线实体方向与之前一致,过滤掉该反转信号
- 如果K线实体方向发生变化,确认反转信号,产生交易信号
优势分析
- 基于SuperTrend指标,能够准确判断趋势反转点
- 结合K线实体方向过滤无效信号,提高信号质量
- 适合作为时序指标,指导投资者选择合理入场和退出时间
- 可广泛应用于任何时间周期和不同品种,适应性强
风险及解决方法
- SuperTrend指标容易产生多余信号,需辅助过滤
解决方法:本策略采用K线实体方向进行辅助判断,有效过滤无效信号 - SuperTrend参数设置易过优化或过度优化
解决方法:采用默认参数,避免人为调参过度优化 - 无法处理超快行情的反转
解决方法:适当调整ATR周期参数,应对更快速行情
优化方向
- 尝试不同的ATR周期参数组合
- 增加Volume或波动率指标进行辅助过滤信号
- 结合其它指标系统进行组合,提高策略性能
- 开发止损机制,控制单笔损失
总结
阳光超级趋势策略是一种基于SuperTrend指标判断趋势反转的高效策略。它结合K线实体方向进行辅助判断,能有效过滤无效信号,提高信号质量。该策略操作简单,适应性强,可广泛应用于多个品种和时间周期。通过合理参数优化和止损机制增加,可以进一步提升策略表现。 ||
Overview
The Sunny Supertrend strategy is a trend-following strategy based on the ATR and SuperTrend indicators. It can accurately predict trend reversals and works perfectly as a timing indicator. The strategy can increase patience and help traders enter and exit the markets at the right time.
Strategy Logic
The strategy uses the SuperTrend indicator to determine the current trend direction. When the SuperTrend indicator changes direction, we think a trend reversal may occur. In addition, the strategy also uses the direction of candlestick bodies for auxiliary judgment. When a potential reversal signal appears and the candlestick body direction is consistent with the previous one, the invalid signal is filtered out.
Specifically, the strategy generates trading signals according to the following logic:
- Use the SuperTrend indicator to determine the main trend direction
- When the SuperTrend indicator direction changes, a potential reversal signal is generated
- If the candlestick body direction is consistent with the previous one at this time, the reversal signal is filtered out
- If the candlestick body direction changes, the reversal signal is confirmed and a trading signal is generated
Advantage Analysis
- Based on the Supertrend indicator, it can accurately determine trend reversal points
- Filter out invalid signals by combining candlestick body directions to improve signal quality
- Suitable as a timing indicator to guide investors to choose reasonable entry and exit time
- Widely applicable to any timeframe and different varieties with strong adaptability
Risks and Solutions
-
The Supertrend indicator tends to generate redundant signals which need to be filtered Solution: This strategy uses the candlestick body direction for auxiliary judgment to effectively filter out invalid signals
-
Supertrend parameters are prone to over-optimization
Solution: Use default parameters to avoid manual tweaking and over-optimization -
Unable to process ultra-fast trend reversals Solution: Adjust the ATR period parameter appropriately to cope with faster market movements
Optimization Directions
- Try different combinations of ATR period parameters
- Add Volume or volatility indicators to help filter signals
- Combine with other systems to improve strategy performance
- Develop stop loss mechanisms to control single loss
Conclusion
The Sunny Supertrend strategy is an efficient trend reversal strategy based on the SuperTrend indicator. It combines candlestick body directions for auxiliary judgment, which can effectively filter out invalid signals and improve signal quality. This strategy is simple to operate, highly adaptable, and can be widely used across multiple products and timeframes. By reasonably optimizing parameters and increasing stop loss mechanisms, the strategy's performance can be further enhanced.
[/trans]
Strategy Arguments
| Argument | Default | Description |
|---|---|---|
| v_input_1 | 10 | ATR Length |
| v_input_float_1 | 3 | Factor |
| v_input_int_1 | true | Start Date |
| v_input_int_2 | true | Start Month |
| v_input_int_3 | 2021 | Start Year |
| v_input_int_4 | true | End Date |
| v_input_int_5 | 2 | End Month |
| v_input_int_6 | 2021 | End Year |
Source (PineScript)
/*backtest
start: 2023-11-12 00:00:00
end: 2023-12-12 00:00:00
period: 1h
basePeriod: 15m
exchanges: [{"eid":"Futures_Binance","currency":"BTC_USDT"}]
*/

//@version=5
strategy("Sunny Supertrend Strategy", overlay=true, default_qty_type=strategy.percent_of_equity)

atrPeriod = input(10, "ATR Length")
factor = input.float(3.0, "Factor", step = 0.01)

[_, direction] = ta.supertrend(factor, atrPeriod)

shor= close > open and close[1] > open[1] and close[2] > open[2]
lon = open > close and open[1] > close[1] and  open[2] > close[2]
tt= ta.change(direction) < 0
ss= ta.change(direction) > 0
long= tt
longexit = lon or ss
short= ss
shortexit = shor or tt

longPosMem = false
longexitPosMem = false
shortPosMem = false
shortexitPosMem = false

longPosMem := long ? true : short ? false : longPosMem[1]
longexitPosMem := longexit ? true : shortexit ? false : longexitPosMem[1]
shortPosMem := short ? true : long ? false : shortPosMem[1]
shortexitPosMem := shortexit ? true : longexit ? false : shortexitPosMem[1]

longy = long and not(longPosMem[1])
longexity = longexit and not(longexitPosMem[1])
shorty = short and not(shortPosMem[1])
shortexity = shortexit and not(shortexitPosMem[1])

//Use this to customize the look of the arrows to suit your needs.
plotshape(longy, location=location.abovebar, color=color.green, style=shape.arrowup, text="Buy")
plotshape(longexity, location=location.top, color=color.green, style=shape.xcross, text="Buy exit")
plotshape(shorty, location=location.belowbar, color=color.red, style=shape.arrowdown, text="Sell")
plotshape(shortexity, location=location.bottom, color=color.red, style=shape.xcross, text="Sell exit")


//plot(strategy.equity, title="equity", color=color.red, linewidth=2, style=plot.style_areabr)
// STEP 1:
// Make input options that configure backtest date range
startDate = input.int(title="Start Date", defval=1, minval=1, maxval=31)
startMonth = input.int(title="Start Month",
     defval=1, minval=1, maxval=12)
startYear = input.int(title="Start Year",
     defval=2021, minval=1800, maxval=2100)

endDate = input.int(title="End Date",
     defval=1, minval=1, maxval=31)
endMonth = input.int(title="End Month",
     defval=2, minval=1, maxval=12)
endYear = input.int(title="End Year",
     defval=2021, minval=1800, maxval=2100)

// STEP 2:
// Look if the close time of the current bar
// falls inside the date range
inDateRange =  true


// STEP 3:
// Submit entry orders, but only when bar is inside date range
if (inDateRange and longy)
    strategy.entry("enter long",strategy.long,when= longy)
    strategy.close("long",when=longexity)


if (inDateRange and shorty)
    strategy.entry("enter short",strategy.short,when = shorty)
    strategy.close("short", when=shortexity)
Detail
https://www.fmz.com/strategy/435233
Last Modified
2023-12-13 14:40:24