
7.0 KiB
Name
金叉死叉均线交易策略Golden-Cross-Death-Cross-Moving-Average-Trading-Strategy
Author
ChaoZhang
Strategy Description
[trans]
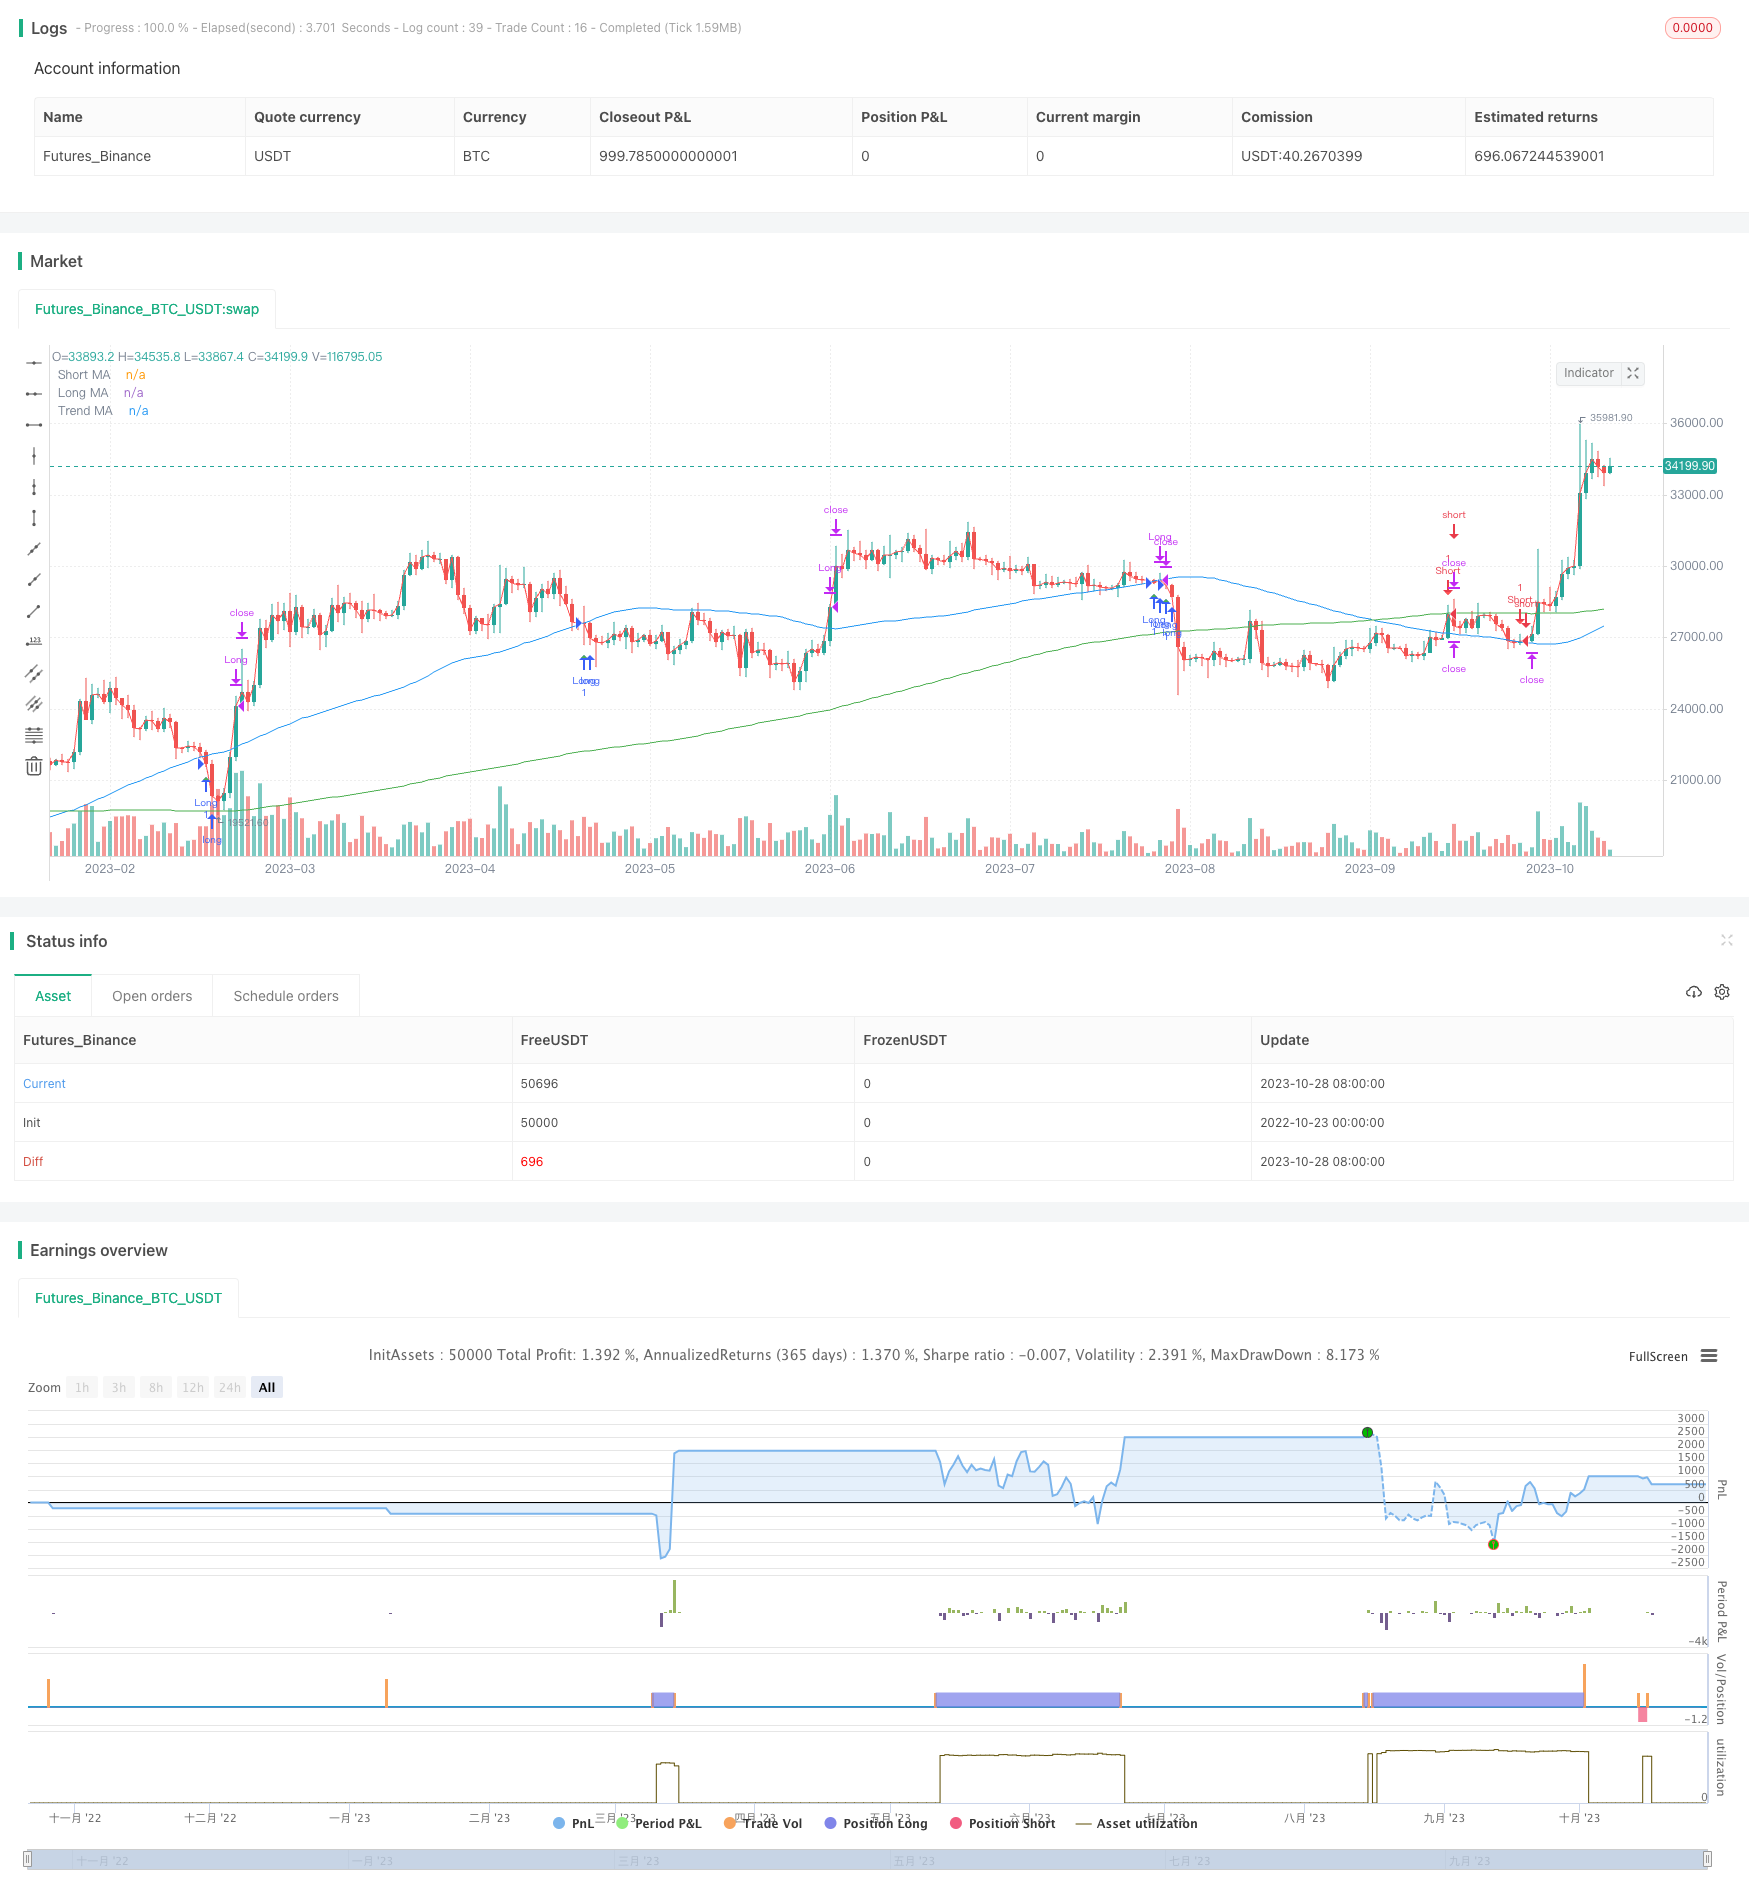
概述:该策略基于三条不同周期的移动平均线实现金叉死叉交易。当短周期均线上穿长周期均线时做多,当短周期均线下穿长周期均线时做空。同时结合长期趋势均线判断趋势方向。
策略原理:
-
定义三条移动平均线,分别是短期均线、长期均线和趋势均线。短期均线周期为20,长期均线周期为200,趋势均线周期为50。
-
当短期均线上穿长期均线时产生买入信号做多,当短期均线下穿长期均线时产生卖出信号做空。
-
同时检查短期均线和长期均线是否都在趋势均线之上,如果不满足则过滤该信号。这可以避免逆势操作。
-
止损和止盈设置为入场价的一定比例,可以根据实际情况优化参数。
-
画出均线的交叉点来辅助观察入场时机。
优势分析:
-
策略思路简单直观,容易理解和实现。
-
能够有效捕捉中短期趋势,顺势而为。
-
结合趋势均线可以进一步过滤信号,避免逆势操作。
-
通过调整三条均线的参数可以适应不同市场的特点。
-
可自定义止损止盈参数来控制风险。
风险分析:
-
若市场出现急剧震荡,可能导致止损被套。
-
趋势发生转变时,可能出现较大亏损。
-
参数设置不当可能导致交易频繁或者错过机会。
-
需要关注交易成本的影响。
优化方向:
-
可以结合波动率指标来进一步过滤信号,例如ATR。
-
可以引入机器学习算法来动态优化参数。
-
可以结合更多指标判断趋势,如MACD。
-
可以设置移动止损来锁定利润。
-
可以通过回测优化止损止盈的参数。
总结:
该策略整体思路清晰易执行,通过金叉死叉系统性捕捉趋势。配合趋势均线和止损止盈来控制风险。参数设置需要根据具体市场行情优化。可以进一步结合更多指标来提高效果。该策略适合中短期趋势交易,在回测和Demo交易中表现较好。但实盘中需要注意防止被套和趋势转变带来的风险。总体来说,该策略具有一定的实用价值。
||
Overview: This strategy implements golden cross and death cross trading based on three moving averages with different periods. It goes long when the short period MA crosses above the long period MA, and goes short when the short period MA crosses below the long period MA. The trend direction is determined by the trend MA line.
Strategy Logic:
-
Define three MAs - short period MA, long period MA and trend MA. The periods are 20, 200 and 50 respectively.
-
A buy signal is generated when the short period MA crosses above the long period MA. A sell signal is generated when the short period MA crosses below the long period MA.
-
Check if both the short and long MAs are above the trend MA. If not, the signal is filtered out to avoid trading against the trend.
-
Set stop loss and take profit as a percentage of the entry price. Optimize parameters based on backtesting.
-
Plot the MA crossover points to visualize entry signals.
Advantages:
-
Simple and intuitive strategy logic, easy to understand and implement.
-
Can effectively capture mid-term trends and trade with the momentum.
-
Filtering with trend MA avoids trading against the trend.
-
MA periods can be adjusted for different market conditions.
-
Customizable stop loss and take profit to control risks.
Risks:
-
Sharp volatile moves may trigger stop loss.
-
Larger losses when trend reverses.
-
Improper parameter tuning may lead to overtrading or missing opportunities.
-
Transaction costs need to be considered.
Enhancements:
-
Add volatility filter like ATR to avoid false signals.
-
Use machine learning to dynamically optimize parameters.
-
Add more indicators like MACD to determine trend.
-
Implement trailing stop loss to lock in profits.
-
Backtest to find optimal stop loss and take profit levels.
Conclusion:
The strategy captures trends effectively with clear logic and easy execution. Controlling risks with trend filter, stop loss and take profit. Parameter tuning requires optimization for market conditions. More indicators can improve performance. Suitable for mid-term trend trading. Performed well in backtest and demo trading. In live trading, beware of whipsaws and trend reversal risks. Has practical value overall.
[/trans]
Strategy Arguments
| Argument | Default | Description |
|---|---|---|
| v_input_int_1 | 64 | Long MA Length |
| v_input_int_2 | true | Short MA Length |
| v_input_int_3 | 200 | Trend MA Length |
| v_input_1 | true | Long Stop Loss (%) |
| v_input_2 | 3 | Long Take Profit (%) |
| v_input_3 | true | Short Stop Loss (%) |
| v_input_4 | 3 | Short Take Profit (%) |
Source (PineScript)
/*backtest
start: 2022-10-23 00:00:00
end: 2023-10-29 00:00:00
period: 1d
basePeriod: 1h
exchanges: [{"eid":"Futures_Binance","currency":"BTC_USDT"}]
*/

//@version=5
strategy("XAU M15", overlay=true)

// Define input parameters
long_length = input.int(64, title="Long MA Length")
short_length = input.int(1, title="Short MA Length")
trend_length = input.int(200, title="Trend MA Length")

// Calculate moving averages
long_ma = ta.sma(close, long_length)
short_ma = ta.sma(close, short_length)
trend_ma = ta.sma(close, trend_length)

// Plot moving averages on chart
plot(long_ma, color=color.blue, title="Long MA")
plot(short_ma, color=color.red, title="Short MA")
plot(trend_ma, color=color.green, title="Trend MA")

// Entry conditions
enterLong = ta.crossover(long_ma, short_ma) and long_ma > trend_ma and short_ma > trend_ma
enterShort = ta.crossunder(long_ma, short_ma) and long_ma < trend_ma and short_ma < trend_ma

if (enterLong)
    strategy.entry("Long", strategy.long)

if (enterShort)
    strategy.entry("Short", strategy.short)

// Exit conditions
exitLong = ta.crossunder(long_ma, short_ma)
exitShort = ta.crossover(long_ma, short_ma)

if (exitLong)
    strategy.close("Long")

if (exitShort)
    strategy.close("Short")

// Set stop loss and take profit levels
long_stop_loss_percentage = input(1, title="Long Stop Loss (%)") / 100
long_take_profit_percentage = input(3, title="Long Take Profit (%)") / 100

short_stop_loss_percentage = input(1, title="Short Stop Loss (%)") / 100
short_take_profit_percentage = input(3, title="Short Take Profit (%)") / 100

strategy.exit("Take Profit/Stop Loss", "Long", stop=close * (1 - long_stop_loss_percentage), limit=close * (1 + long_take_profit_percentage))
strategy.exit("Take Profit/Stop Loss", "Short", stop=close * (1 + short_stop_loss_percentage), limit=close * (1 - short_take_profit_percentage))

plotshape(series=enterLong, title="Buy Entry", location=location.belowbar, color=color.green, style=shape.triangleup, size=size.tiny)
plotshape(series=enterShort, title="Sell Entry", location=location.abovebar, color=color.red, style=shape.triangledown, size=size.tiny)
Detail
https://www.fmz.com/strategy/430569
Last Modified
2023-10-30 14:42:09