
9.1 KiB
Name
跨周期趋势追踪型量化策略An-Intraday-Trend-Following-Quantitative-Strategy-Based-on-Multi-indicator-Condition-Filtering
Author
ChaoZhang
Strategy Description
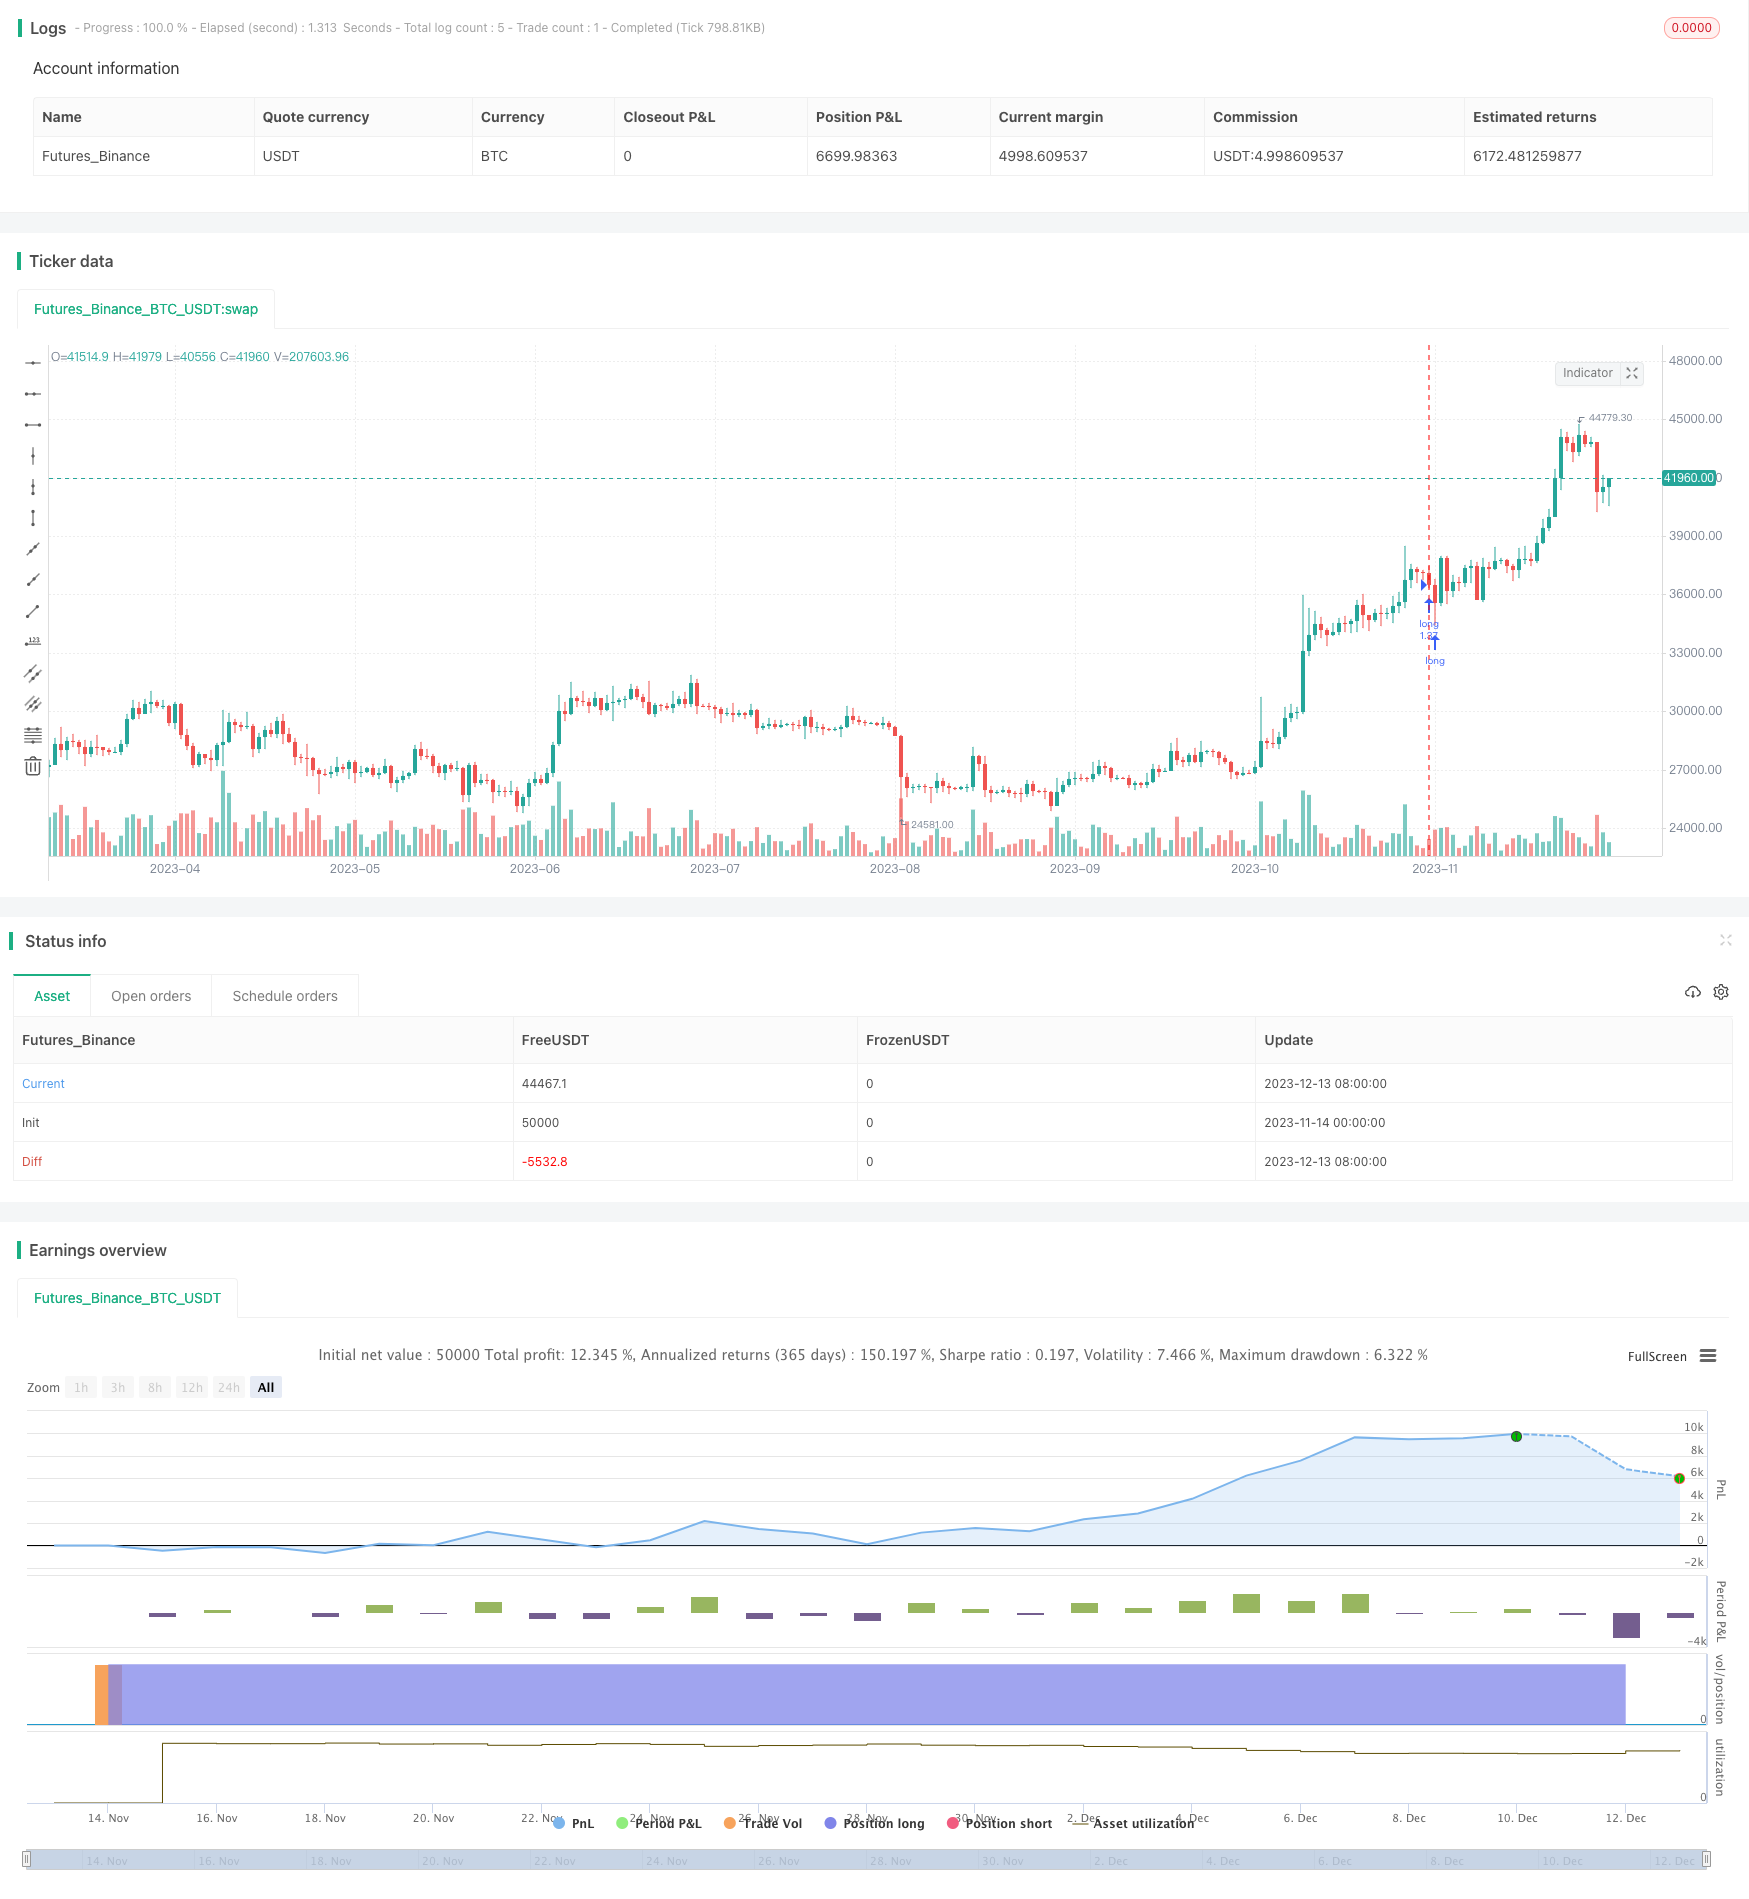
[trans]
概述
本策略综合运用PSAR指标判断价格趋势、ADX指标判断趋势强弱、RSI指标定位超买超卖区域以及CMF指标判断资金流向,构建出一个跨周期的趋势追踪型量化交易策略。该策略在判断到价格出现盘整突破形成新的趋势方向时快速定位,并在后续趋势中持续跟踪,在保证把握主要趋势收益的同时也设置了过程过滤条件降低持仓风险。
策略原理
本策略主要判断规则如下:
-
使用PSAR指标判断价格是否处于上升趋势,PSAR下穿价格视为结束上升趋势转为下降;
-
RSI指标要求高于中线50,以过滤掉超卖区域形成的假突破;
-
ADX要求高于自身的EMA均线,表示趋势分析结果存在持续信号;
-
CMF要求大于0,判断为资金流入;
满足以上四个条件时产生买入信号;满足PSAR上穿、RSI低于50、ADX低于自身EMA均线和CMF小于0时产生卖出信号。
该策略综合考量了价格趋势方向、趋势强度、超买超卖状态和资金流向多个维度设置交易规则,在判断产生交易信号时设置了严格的逻辑判断,可有效过滤假突破情况,确保捕捉到高概率可持续的趋势方向。
优势分析
本策略主要具有以下优势:
-
结合多种指标设置交易规则,可有效防范假突破,确保交易信号质量;
-
快速定位新生趋势方向并跟踪,可充分把握趋势进程收益;
-
设置过程跟踪过滤条件,可有效控制风险,确保跟踪效果;
-
结合趋势强度指标判断,可避免陷入盘整困顿。
风险分析
本策略主要存在以下风险:
-
单一策略容易堆积风险,需要适当调整仓位控制整体风险;
-
跟踪过程中需要密切关注过滤条件变化,避免条件取消后产生Loss Cut;
-
本策略以中长线为主,短期内容易受到波动影响产生止损风险。
对应风险管理措施包括:优化仓位管理规则、设置风险预警线、适当放宽止损线距离等。
优化方向
本策略存在以下优化空间:
-
优化参数设置,目前参数设置较为主观,可以引入机器学习方法自动优化;
-
增加仓位管理模块,可以根据风险状况动态调整仓位;
-
增加止损机制优化,如跟踪止损、时间止损、突破止损等。
总结
本策略综合多种指标判断规则,实现了对新生趋势的快速定位和持续跟踪,验证了量化交易结合趋势与资金等多维度分析的效果。该策略可以作为跨周期趋势跟踪的基础策略进行指数化运用,也可在参数及模块优化后构建成稳定的中长线量化策略。
||
Overview
This strategy combines PSAR to judge price trends, ADX to judge trend strength, RSI to locate overbought and oversold zones, and CMF to judge fund flows to construct an intraday trend-following quantitative trading strategy across cycles. It can quickly locate new trend directions when prices break out of consolidation and form new trends, and continues to track trends afterwards. While ensuring that main trend gains are captured, filtering conditions are also set during the process to reduce holding risks.
Principles
The main judging rules of this strategy are:
-
Use the PSAR indicator to judge whether prices are in an uptrend. PSAR’s decline below prices indicates the end of the upward trend and the start of a downward trend.
-
Require RSI to be above the midpoint of 50 to filter out false breakouts occurring in oversold zones.
-
Require ADX to be above its EMA line, indicating a sustainable signal in trend analysis.
-
Require CMF to be greater than 0, judging increased funds flowing in.
Buying signals are generated when all four conditions above are met. Selling conditions occur when PSAR rises above prices, RSI drops below 50, ADX drops below its EMA and CMF becomes less than 0.
This strategy comprehensively considers the price trend direction, trend strength, the overbought/oversold state and fund flows when setting up trading rules. By setting strict logical rules when generating trading signals, false breakouts can be effectively filtered and high probability sustainable trend directions can be captured.
Advantages
The main advantages of this strategy include:
-
Combining multiple indicators in setting up trading rules can effectively prevent false breakouts and ensures signal quality.
-
Rapidly locating budding trend directions and tracking enables capturing most trend profits.
-
Setting up process filtering conditions can effectively control risks and ensures tracking efficacy.
-
Considering trend strength helps avoiding trading range congestions.
Risk Analysis
The main risks of this strategy include:
-
A single strategy accumulation poses portfolio risks, requiring appropriate position sizing.
-
Closely monitor filtering condition changes during tracking to avoid losses when cancelled.
-
This mid/long-term strategy can be disrupted short-term by fluctuations and incurs stop loss risks.
Corresponding risk management measures include: optimizing position sizing rules, setting risk alert lines and widening stop distances etc.
Optimization Directions
Optimization spaces include:
-
Parameter optimization via machine learning given current subjective settings.
-
Add position sizing module that dynamically sizes based on risks.
-
Enhance stop mechanisms e.g. trailing stops, time stops or breakout stops.
Conclusion
This strategy combining indicators proved effective in rapidly locating and tracking nascent trends, validating quantitative trading based on multiple dimensions like trends and funds. As a base, it can be indexed across cycles. With parameter tuning and modular enhancements, it can also become a stable mid/long-term strategy.
[/trans]
Strategy Arguments
| Argument | Default | Description |
|---|---|---|
| v_input_1 | 1.02 | start |
| v_input_2 | 1.02 | increment |
| v_input_3 | 1.2 | maximum |
| v_input_4 | 50 | length |
| v_input_5 | 49 | middle_RSI |
| v_input_6 | 20 | lengthCMF |
| v_input_7 | 14 | ADX Smoothing |
| v_input_8 | 14 | DI Length |
| v_input_9 | 10 | ema_length |
Source (PineScript)
/*backtest
start: 2023-11-14 00:00:00
end: 2023-12-14 00:00:00
period: 1d
basePeriod: 1h
exchanges: [{"eid":"Futures_Binance","currency":"BTC_USDT"}]
*/

//@version=4
strategy("psar+ adx + cmf + rsi Strategy", overlay=true,initial_capital = 1000, default_qty_type=strategy.percent_of_equity, default_qty_value=100, commission_type=strategy.commission.percent , commission_value=0.1 )

start = input(1.02)
increment = input(1.02)
maximum = input(1.2)
var bool uptrend = na
var float EP = na
var float SAR = na
var float AF = start
var float nextBarSAR = na
if bar_index > 0
	firstTrendBar = false
	SAR := nextBarSAR
	if bar_index == 1
		float prevSAR = na
		float prevEP = na
		lowPrev = low[1]
		highPrev = high[1]
		closeCur = close
		closePrev = close[1]
		if closeCur > closePrev
			uptrend := true
			EP := high
			prevSAR := lowPrev
			prevEP := high
		else
			uptrend := false
			EP := low
			prevSAR := highPrev
			prevEP := low
		firstTrendBar := true
		SAR := prevSAR + start * (prevEP - prevSAR)
	if uptrend
		if SAR > low
			firstTrendBar := true
			uptrend := false
			SAR := max(EP, high)
			EP := low
			AF := start
	else
		if SAR < high
			firstTrendBar := true
			uptrend := true
			SAR := min(EP, low)
			EP := high
			AF := start
	if not firstTrendBar
		if uptrend
			if high > EP
				EP := high
				AF := min(AF + increment, maximum)
		else
			if low < EP
				EP := low
				AF := min(AF + increment, maximum)
	if uptrend
		SAR := min(SAR, low[1])
		if bar_index > 1
			SAR := min(SAR, low[2])
	else
		SAR := max(SAR, high[1])
		if bar_index > 1
			SAR := max(SAR, high[2])
	nextBarSAR := SAR + AF * (EP - SAR)

//rsi strat
length = input( 50 )
middle_RSI=input(49)
price = close
vrsi = rsi(price, length)

//cmf
lengthCMF = input(20, minval=1)
ad = close==high and close==low or high==low ? 0 : ((2*close-low-high)/(high-low))*volume
mf = sum(ad, lengthCMF) / sum(volume, lengthCMF)

//ADX
adxlen = input(14, title="ADX Smoothing")
dilen = input(14, title="DI Length")
dirmov(len) =>
	up = change(high)
	down = -change(low)
	plusDM = na(up) ? na : (up > down and up > 0 ? up : 0)
	minusDM = na(down) ? na : (down > up and down > 0 ? down : 0)
	truerange = rma(tr, len)
	plus = fixnan(100 * rma(plusDM, len) / truerange)
	minus = fixnan(100 * rma(minusDM, len) / truerange)
	[plus, minus]
adx(dilen, adxlen) =>
	[plus, minus] = dirmov(dilen)
	sum = plus + minus
	adx = 100 * rma(abs(plus - minus) / (sum == 0 ? 1 : sum), adxlen)
sig = adx(dilen, adxlen)
ema_length=input(10)
ema_sig= ema(sig,ema_length)


long = not uptrend  and vrsi > middle_RSI and sig > ema_sig   and mf>0
short= uptrend   and vrsi < middle_RSI and sig<ema_sig and mf<0

strategy.entry("long",1,when=long)
strategy.close('long',when=short)
Detail
https://www.fmz.com/strategy/435509
Last Modified
2023-12-15 15:59:37