
11 KiB
Name
趋势追踪突破策略Gold-Silver-30m-Trend-Following-Breakout-Strategy
Author
ChaoZhang
Strategy Description
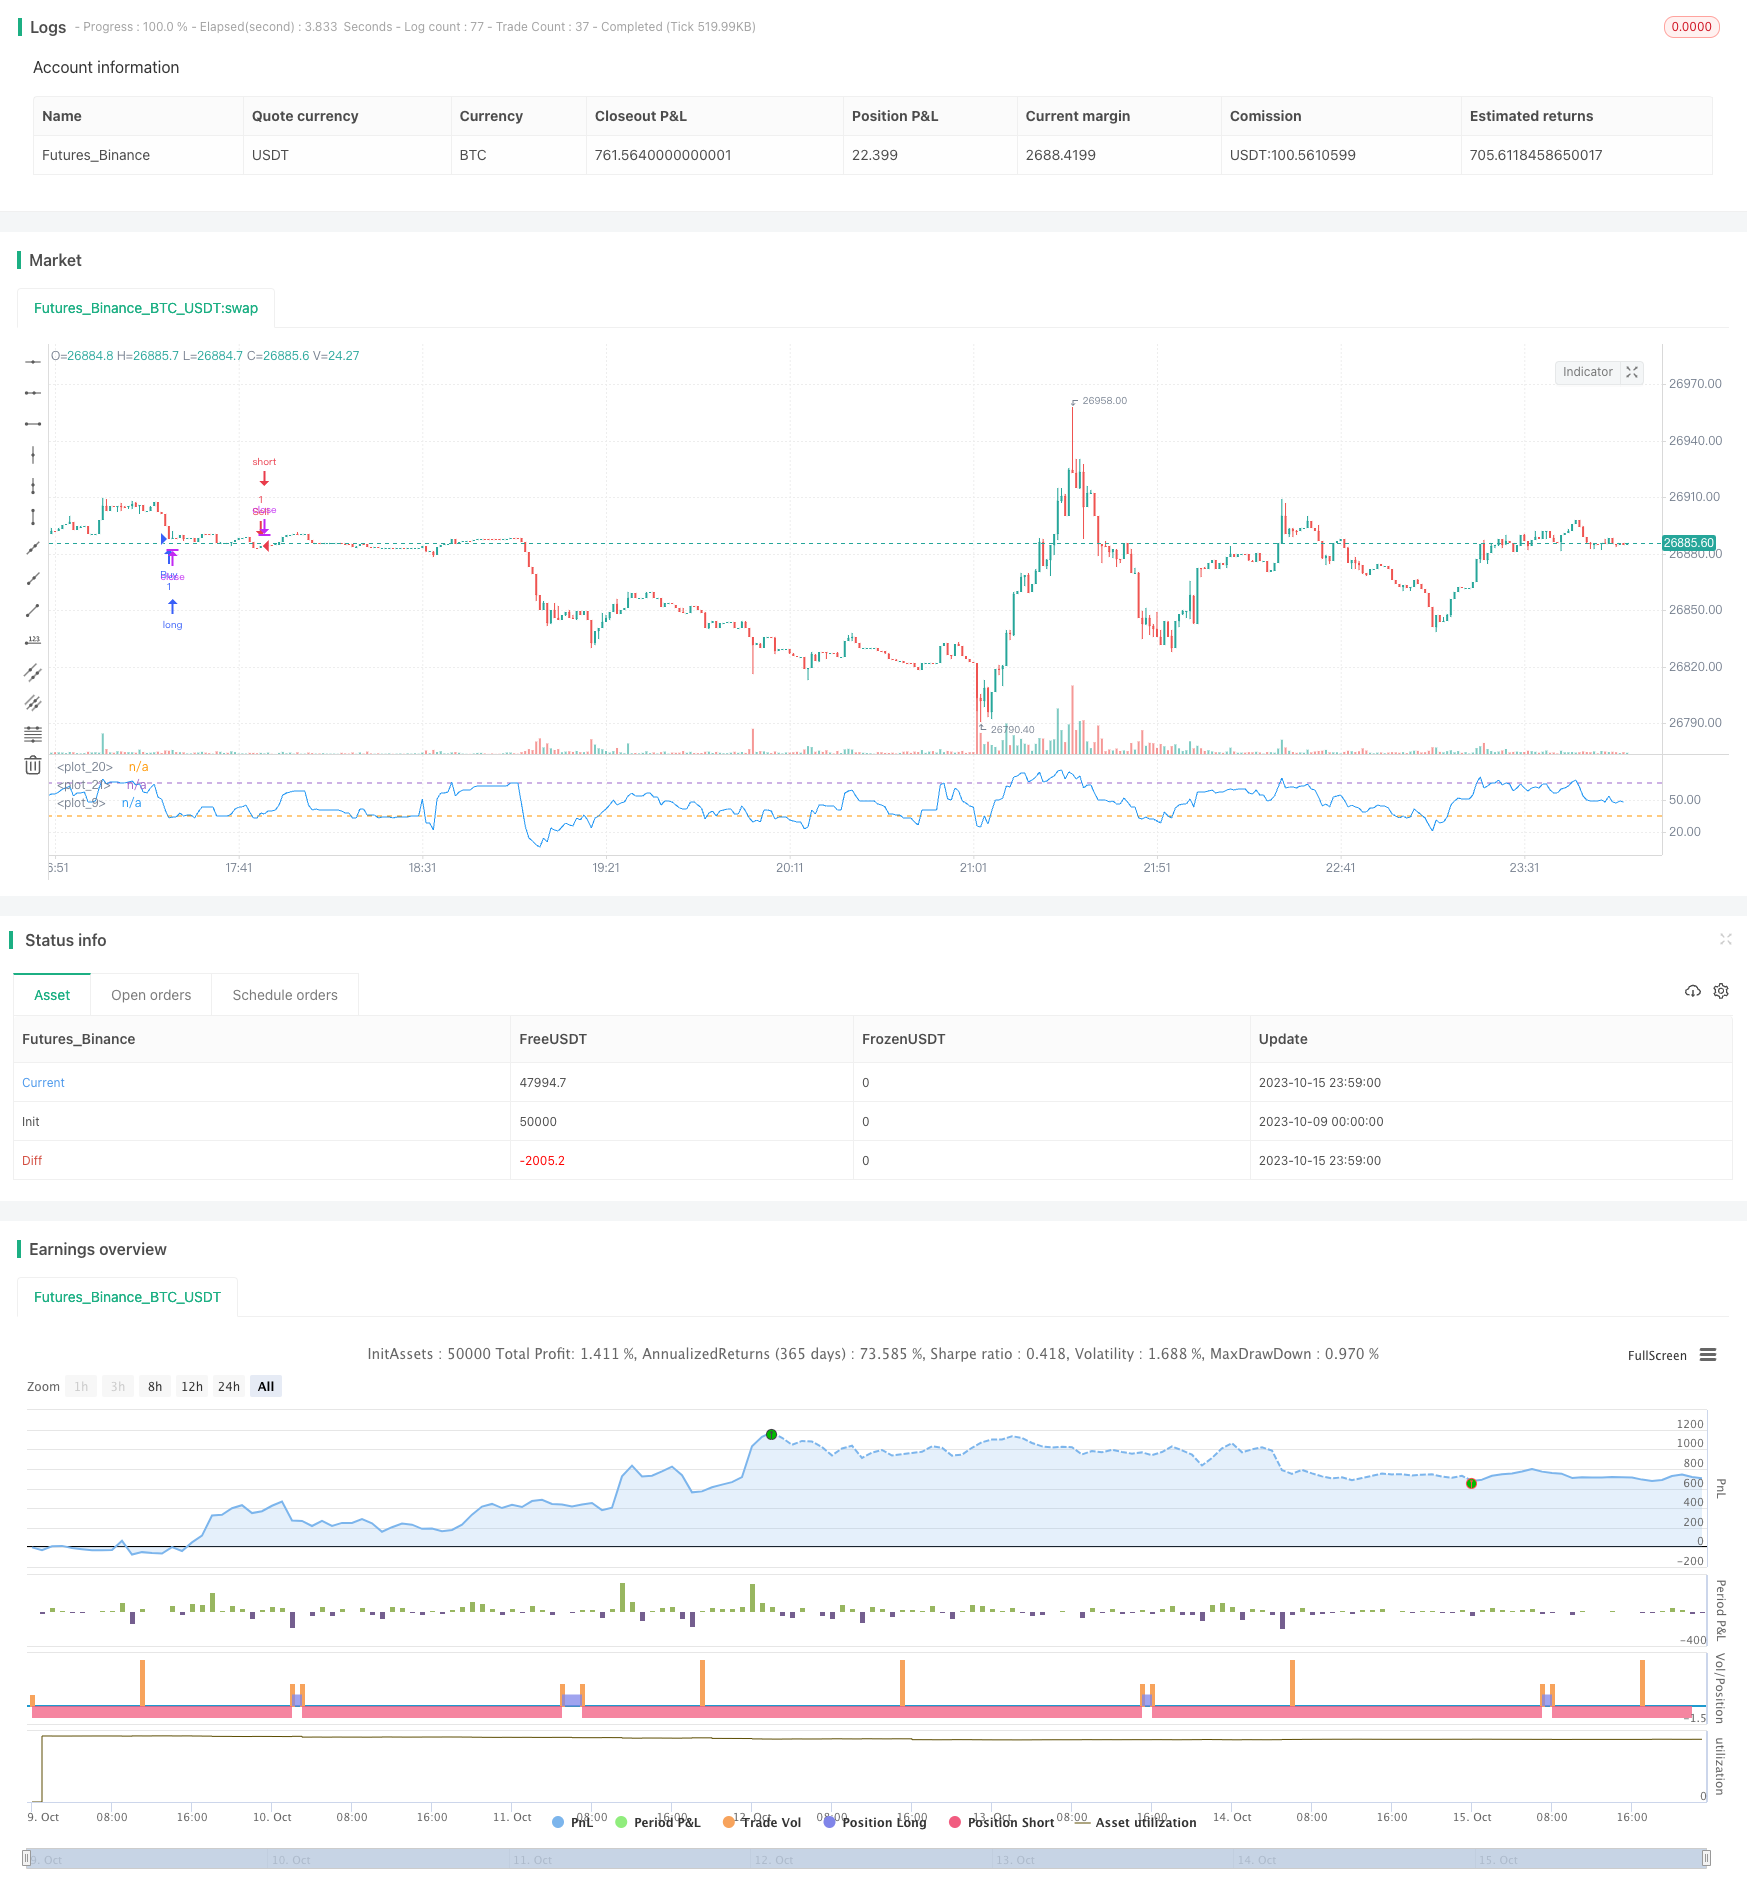
[trans]
概述
本策略采用布林线、RSI指标以及162日EMA均线,根据金银价格突破上方布林线以及RSI低位突破形成买入信号,根据金银价格突破下方布林线以及RSI高位形成卖出信号,属于典型的趋势追踪策略。
策略原理
本策略主要基于以下几点原理:
-
使用162日EMA均线判断大趋势方向。价格在均线上方为多头趋势,价格在均线下方为空头趋势。
-
使用布林线判断价格突破。价格突破上方布林带代表突破上升趋势,价格突破下方布林带代表突破下降趋势。
-
使用RSI指标判断超买超卖。RSI低于35代表超卖,高于65代表超买。
-
结合大趋势、价格突破和超买超卖信号,形成买入和卖出条件。具体为:
-
买入条件:价格上升突破布林上轨,且RSI低于35
-
卖出条件:价格下跌突破布林下轨,且RSI高于65
-
-
使用止损条件退出交易。具体为:
-
长仓止损:价格跌破162日EMA均线
-
空仓止损:价格涨破162日EMA均线
-
本策略整体属于典型的趋势追踪策略,利用布林带判断价格趋势方向,利用RSI指标过滤假突破,能够有效跟踪中长线趋势。
策略优势
本策略主要具有以下几点优势:
-
利用布林线和RSI指标进行双重过滤,可以有效过滤假突破,避免交易序号震荡市场。
-
只在趋势方向明确时才入场,可以最大程度规避非趋势性市场的冲击。
-
利用162日EMA判断大趋势方向,可以把握中长线趋势。
-
RSI指标的参数设置合理,既可以有效过滤震荡,又不会错过趋势反转机会。
-
止损方式合理,既保证了盈利,也控制了风险。
-
回测数据采用实盘数据,结果较真实可信。
整体来说,本策略回避了趋势交易的主要风险,在控制风险的同时,获得了较好的盈利回报。
策略风险
本策略主要存在以下风险:
-
布林线并不能完全避免假突破的发生,在市场震荡时,仍会出现一定的止损风险。
-
RSI指标可能会产生背离,引发错误交易。应适当缩短RSI参数,保证其灵敏度。
-
EMA均线具有滞后性,可能会过度保守,错过趋势机会。应适当缩短均线参数。
-
突破交易容易形成“追高杀跌”。应控制位置规模和止损幅度。
-
趋势可能发生转折,应适时注意调整策略方向。
-
回测数据不等于实盘结果,实盘操作中难免会产生人为因素导致的偏差。
对策:
-
适当缩短布林线周期,提高对突破的判断灵敏度。
-
优化RSI参数设置,保证其对趋势变化的敏感性。
-
酌情缩短EMA周期,在保持对大趋势判断的同时,提高对变化的响应速度。
-
加强风险管理,严格控制单笔订单规模和止损幅度。
-
建立趋势转折的监测机制,确保能及时调整策略方向。
-
在仿真交易中检验策略可行性,控制实盘操作中的人为因素。
策略优化方向
本策略可以从以下几个方面进行进一步优化:
-
增加其他指标判断,形成多种过滤条件,提高策略准确性。例如KDJ、MACD等指标的组合运用。
-
优化参数设置,找到最佳的参数组合,提高策略盈利效果。例如调整RSI参数、布林线参数等。
-
加入趋势强弱判断,在趋势强劲时加大仓位,在趋势转弱时减小仓位。
-
增加算法交易元素,形成自动止损、追踪止损、移动止盈等风险控制机制。
-
增加机器学习元素,利用算法自动优化参数,甚至可以实现策略的自动生成。
-
尝试在更高时间周期运行策略,进行长线操作。也可以在更低周期进行策略迭代,进行盘中操作。
-
引入量化交易与组合管理理念,实现多策略综合运用,降低单一策略风险,提高稳定性。
综上,本策略可以从指标运用、参数优化、风险控制、自动化运用等多个层面进行升级,以获得更好的绩效表现。
总结
本策略是一种典型的趋势追踪策略,通过布林线、RSI指标判断价格趋势方向,并利用EMA滤波来识别中长线趋势,在回避震荡的同时保持对趋势的捕捉。策略具有判断准确、风险可控的特点,回测效果较好。但也存在一定的优化空间,如果从多方面入手进行迭代升级,可以获得更出色的实盘效果。总体来说,本策略为量化交易提供了一个可靠、简单、有效的趋势策略思路,奠定了良好的技术基础。
||
Overview
This strategy uses Bollinger Bands, RSI indicator and 162-day EMA to generate buy signals when gold/silver prices break above Bollinger upper band and RSI is oversold, and sell signals when prices break below Bollinger lower band and RSI is overbought. It is a typical trend following strategy.
Strategy Logic
The strategy is based on the following principles:
-
Use 162-day EMA to determine the major trend direction. Price above EMA suggests an uptrend while price below EMA suggests a downtrend.
-
Use Bollinger Bands to identify price breakouts. Price breaking above Bollinger upper band signals an upside breakout, and price breaking below Bollinger lower band signals a downside breakout.
-
Use RSI indicator to identify overbought/oversold levels. RSI below 35 is oversold and RSI above 65 is overbought.
-
Combine major trend, price breakout and overbought/oversold signals to generate entry and exit signals:
-
Buy when price breaks above Bollinger upper band and RSI is below 35.
-
Sell when price breaks below Bollinger lower band and RSI is above 65.
-
-
Use stop loss to control risk:
-
For long trade, exit when price drops below 162-day EMA.
-
For short trade, exit when price rises above 162-day EMA.
-
In summary, this is a typical trend following strategy that uses Bollinger Bands to determine trend direction and RSI to avoid false breakouts. It can effectively track medium-to-long term trends.
Advantages
The main advantages of this strategy are:
-
The double confirmation from Bollinger Bands and RSI avoids false breakouts and reduces whipsaws in volatile markets.
-
Only taking positions in confirmed trend directions minimizes the impact of non-trending markets.
-
The 162-day EMA identifies the major trend direction for medium-to-long term trends.
-
The RSI settings are reasonable to avoid whipsaws while capturing trend reversals.
-
The stop loss mechanism locks in profits while controlling risks.
-
The backtest uses real market data thus the results are more realistic and reliable.
Overall, the strategy minimizes the main risks of trend trading while generating good reward-to-risk returns.
Risks
The main risks of this strategy are:
-
Bollinger Bands cannot fully avoid false breakouts. Whipsaw risk still exists in choppy markets.
-
RSI divergence may generate incorrect signals. The RSI period could be shortened to increase sensitivity.
-
EMA has lagging effect and may be too conservative, missing trend opportunities. The EMA period could be shortened.
-
Breakout trading tends to "chase highs and sell lows". Position sizing and stop loss range should be controlled.
-
Trends may reverse. Pay attention to adjust strategy direction accordingly.
-
Backtest ≠ live results. Human errors in real trading may cause deviations.
Solutions:
-
Shorten Bollinger Bands period to increase breakout sensitivity.
-
Optimize RSI parameters to ensure responsiveness to trend changes.
-
Optionally shorten EMA period to improve trend change response while maintaining major trend identification ability.
-
Strengthen risk management by capping position sizes and stop loss ranges.
-
Monitor trend reversal and adjust strategy direction timely.
-
Verify strategy viability in paper trading and control human influence in live trading.
Improvement Areas
The strategy can be further improved from the following aspects:
-
Add other indicators like KDJ, MACD for more confirmation to increase accuracy.
-
Optimize parameters like RSI and Bollinger Bands to improve profitability.
-
Incorporate trend strength to increase position size in strong trends and decrease size in weak trends.
-
Add algorithmic elements like automated stop loss, trailing stops, moving profit targets for better risk control.
-
Introduce machine learning to auto optimize parameters or even auto generate strategies.
-
Test strategy viability on higher timeframes for long-term trading or lower timeframes for scalping.
-
Adopt quantitative trading and portfolio management concepts to combine multiple strategies, reducing single-strategy risks and improve stability.
In conclusion, the strategy can be upgraded in multiple dimensions like indicator applications, parameter tuning, risk control, automation to achieve better performance.
Conclusion
This is a typical trend following strategy that identifies trend direction via Bollinger Bands and RSI, and uses EMA to filter out short-term noise. It avoids whipsaws while capturing trends. The strategy demonstrates accuracy and controllable risks with positive backtest results. But there are still rooms for improvement, and upgrading it from multiple aspects can lead to superior live performance. Overall, it provides a reliable, simple and effective trend trading approach for quantified trading and establishes a solid technical foundation.
[/trans]
Strategy Arguments
| Argument | Default | Description |
|---|---|---|
| v_input_1 | 14 | lookback length of RSI |
| v_input_2 | 65 | OB |
| v_input_3 | 35 | OS |
| v_input_4 | 40 | Bollinger Period Length |
Source (PineScript)
/*backtest
start: 2023-10-09 00:00:00
end: 2023-10-16 00:00:00
period: 1m
basePeriod: 1m
exchanges: [{"eid":"Futures_Binance","currency":"BTC_USDT"}]
*/

//@version=2
strategy("My Strategy", overlay = false, commission_value = 0.01, pyramiding = 1)
// Custom RSI
RSIlength = input( 14, minval=1 , title="lookback length of RSI")
RSIOverBought = input(65, title="OB")
RSIOverSold = input(35, title="OS")
RSIprice = close
vrsi = rsi(RSIprice, RSIlength)
plot(vrsi)

//Bollinger Bands
BBlength = input(40, minval=1,title="Bollinger Period Length")
BBmult = 2 // input(2.0, minval=0.001, maxval=50,title="Bollinger Bands Standard Deviation")
BBbasis = sma(close, BBlength)
BBdev = BBmult * stdev(close, BBlength)
BBupper = BBbasis + BBdev
BBlower = BBbasis - BBdev
source = close
//RSI Levels
x=hline(RSIOverSold)
z=hline(RSIOverBought)


strategy.entry("Buy", strategy.long, 1, when = close > ema(close, 162) and vrsi < RSIOverSold)
strategy.exit("Buy", when = vrsi > RSIOverBought and close < ema(close, 162))

strategy.entry("Sell", strategy.short, 1, when = close < ema(close, 162) and vrsi > RSIOverSold)
strategy.exit("Sell", when = vrsi > RSIOverBought and close > ema(close, 162))
Detail
https://www.fmz.com/strategy/429468
Last Modified
2023-10-17 14:11:47