
9.3 KiB
Name
趋势追踪型RafaelZioni动量策略RafaelZioni-Momentum-Trend-Following-Strategy
Author
ChaoZhang
Strategy Description
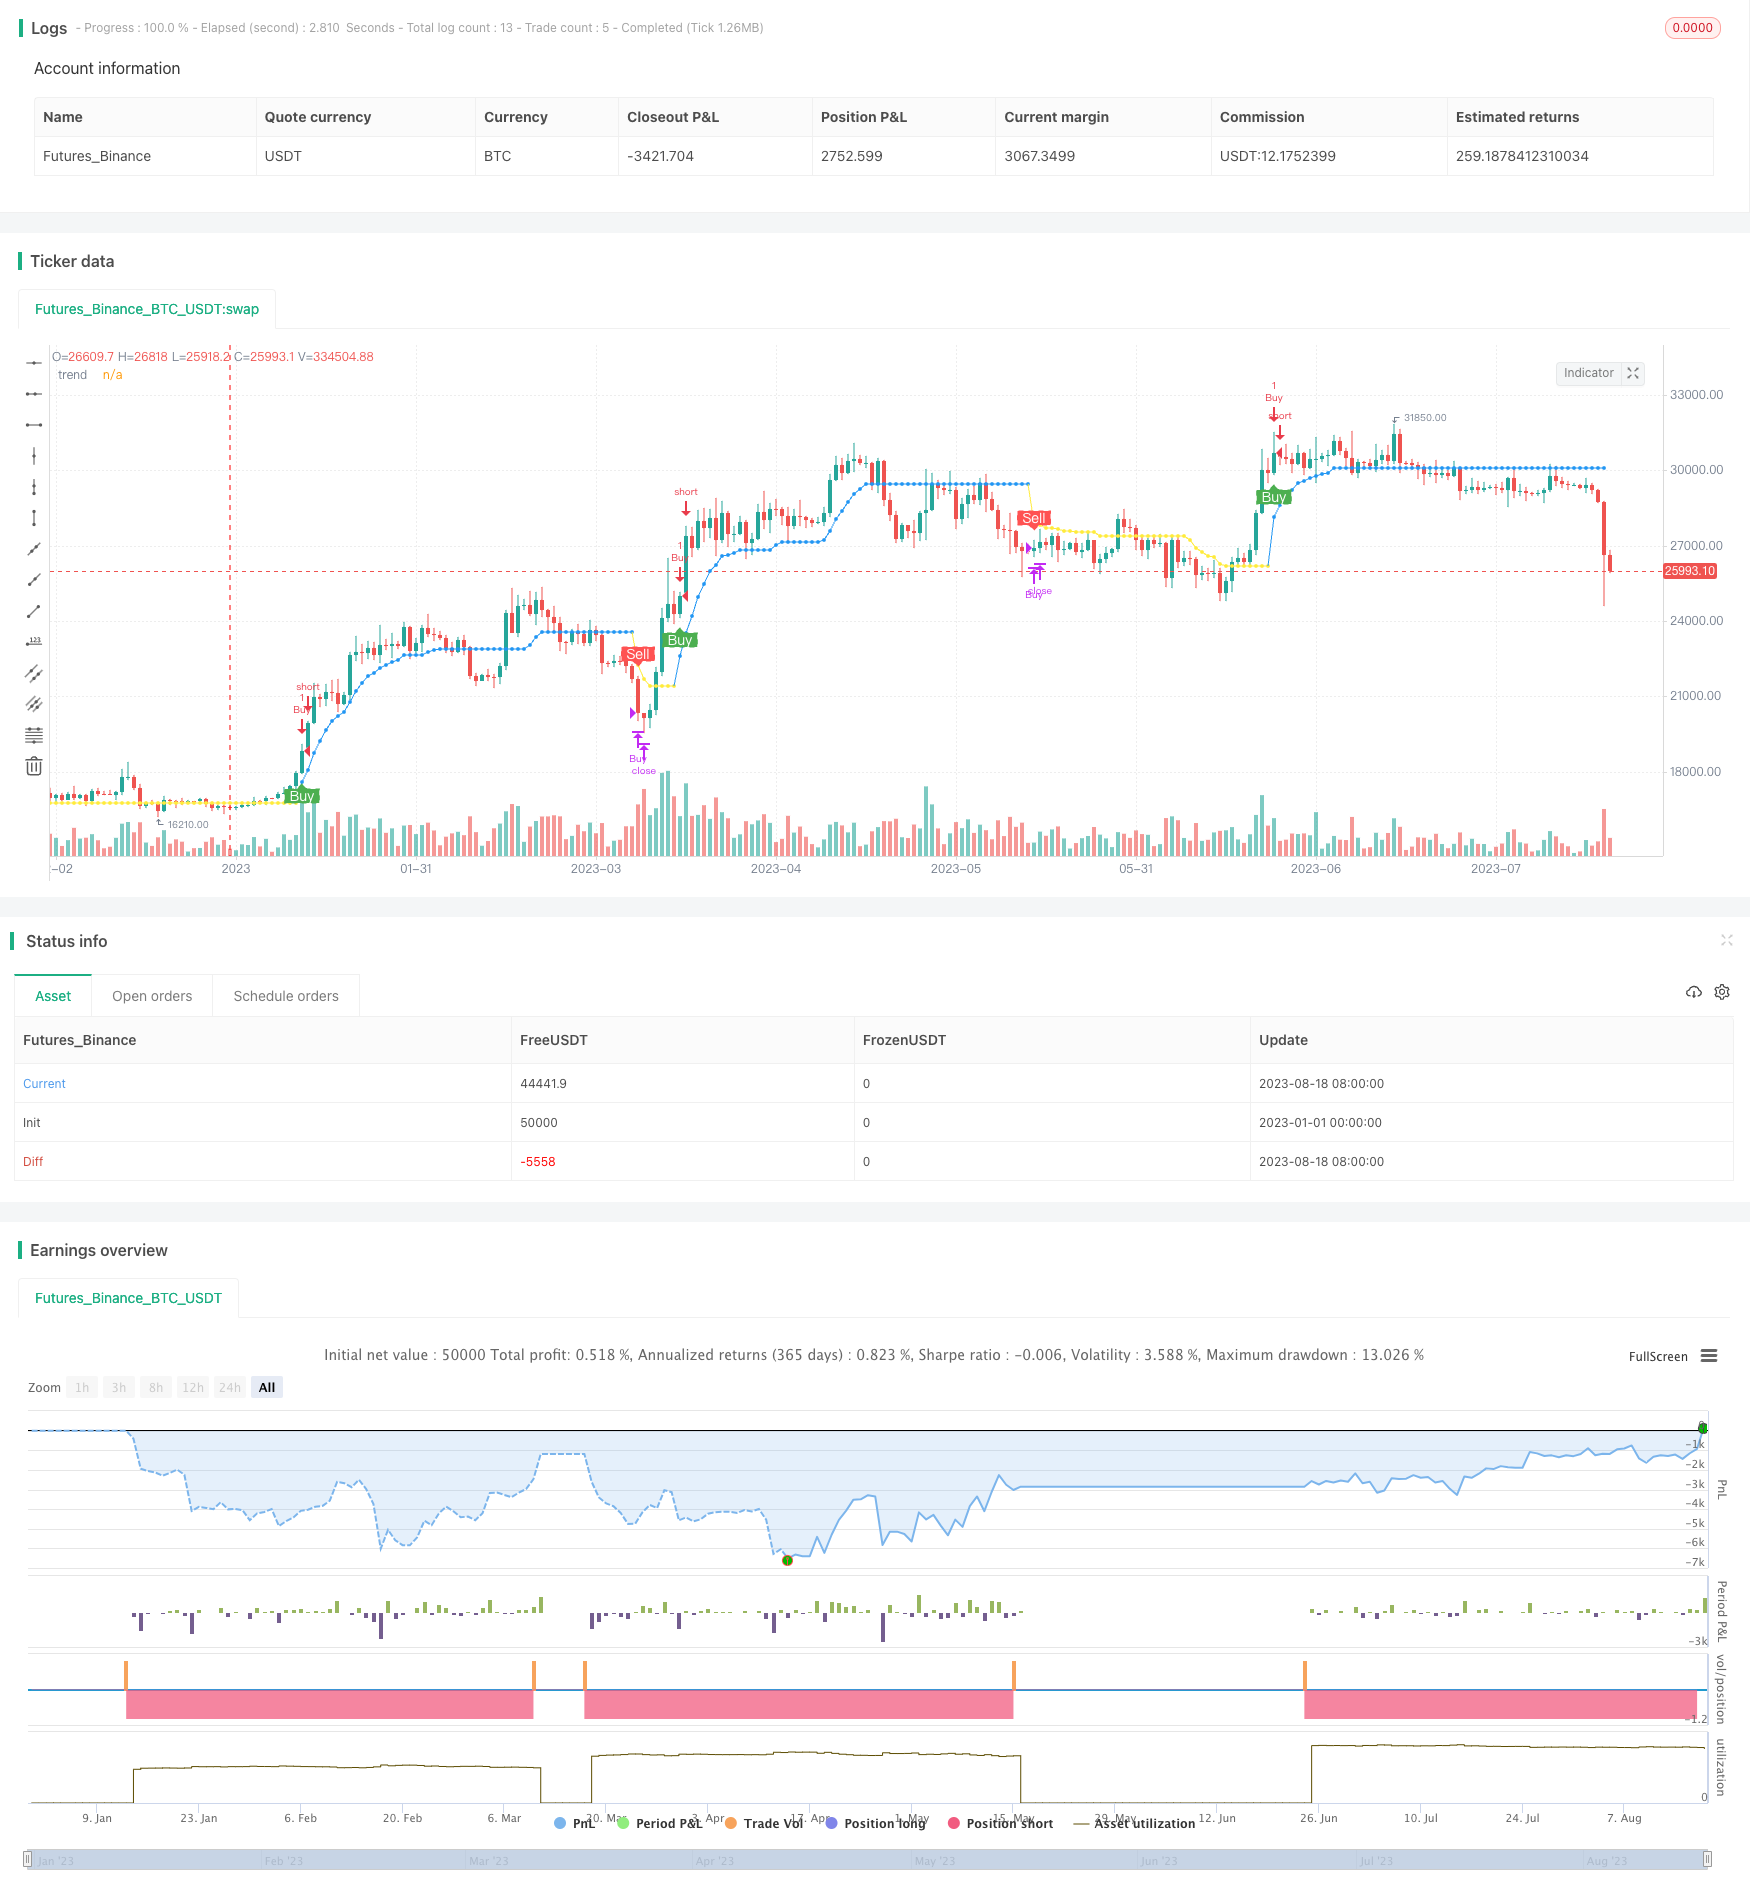 [trans]
概述
该策略基于RafaelZioni的SuperB指标,通过动量指标识别趋势,实现对上升趋势和下降趋势的自动跟踪,属于趋势追踪型策略。
策略原理
该策略使用RafaelZioni的SuperB指标识别价格趋势。SuperB指标基于价格波动范围、成交量和开盘价与收盘价之间的价差计算得到的SpreadVol指标。SpreadVol指标反映价格的动量特征。该策略使用SpreadVol指标的移动平均线和标准差确定阈值,当SpreadVol高于上轨时为上升趋势,低于下轨时为下降趋势。
该策略通过追踪最高价最低价实时判断趋势转折。在上升趋势中,最高价一直创新高,判断为持续上升;当价格跌破最高价一定比例时,转为下降趋势。在下降趋势中,判断方法类似。这样可以对趋势转折点进行及时判断。
优势
该策略结合动量指标判断趋势方向,再通过最高价最低价实时跟踪,可以快速识别新的趋势方向,实现对上升和下降趋势的自动跟踪,避免漏买点和超买点的风险。
RafaelZioni的SuperB指标反映价格变动的力度和速度,可以准确判断真正的趋势,有效过滤假突破。判断规则简单清晰,容易理解和验证。
只做多头仓位,降低操作频繁带来的交易成本和滑点损失。
风险
该策略对突破前的盘整区域容易产生多次误交易。可以通过优化参数,降低对盘整区域的敏感度。
在趋势震荡时,止损线容易被触发。可以适当放宽止损范围,以便持仓时间更长。
多空转换时,需要及时切换仓位。如果切换不够及时,可能带来较大亏损。
优化建议
优化SuperB指标的参数,寻找更好的参数组合,提高指标的稳定性。
优化最高价最低价跟踪的比例因子,降低对盘整区域的反应灵敏度。
增加持仓时间标准,避免趋势震荡期间被止损。
总结
该策略利用RafaelZioni的SuperB指标判断价格趋势方向,并通过追踪最高价和最低价实时判断趋势转折,实现对上升和下降趋势的自动跟踪,避免漏买超买的风险,属于趋势追踪型的动量策略。该策略结合动量指标判断真趋势,判断规则简单清晰,可根据优化建议进一步改进和优化,值得研究和应用。
||
Overview
This strategy is based on the SuperB indicator created by RafaelZioni. It identifies trends through momentum indicators and automatically tracks upward and downward trends, belonging to the trend following strategy.
Strategy Logic
The strategy uses the SuperB indicator created by RafaelZioni to identify price trends. The SuperB indicator is based on price fluctuation range, trading volume and the price difference between the open and close prices to calculate the SpreadVol indicator. The SpreadVol indicator reflects the momentum characteristics of prices. This strategy uses the moving average and standard deviation of the SpreadVol indicator to determine thresholds. When SpreadVol is above the upper rail, it is an upward trend. When below the lower rail, it is a downward trend.
The strategy judges trend reversals in real time by tracking high and low prices. In an upward trend, new highs continue to be made, indicating a sustained rise. When the price breaks below the maximum price by a certain percentage, it turns to a downward trend. The judgment method is similar in a downward trend. This allows timely judgments of trend reversal points.
Advantages
The strategy combines momentum indicators to determine the trend direction, and then tracks the highest and lowest prices in real time, which can quickly identify new trend directions and automatically track upward and downward trends, avoiding the risks of missing buying points and overbuying points.
RafaelZioni's SuperB indicator reflects the strength and speed of price changes and can accurately determine true trends, effectively filtering false breakouts. The judgment rules are simple and clear, easy to understand and verify.
It only does long positions to reduce trading costs and slippage losses caused by frequent operations.
Risks
The strategy is prone to multiple false trades in the consolidation area before the breakout. Parameters can be optimized to reduce sensitivity to consolidation areas.
The stop loss line is prone to be triggered during trend shocks. The stop loss range can be appropriately relaxed for longer holding periods.
When switching between long and short, positions need to be switched in a timely manner. If the switch is not timely enough, it may lead to greater losses.
Optimization Suggestions
Optimize the parameters of the SuperB indicator to find better parameter combinations and improve the stability of the indicator.
Optimize the tracking ratio factor of highest and lowest prices to reduce sensitivity to consolidation areas.
Increase the holding time criteria to avoid being stopped out during trend shocks.
Summary
This strategy utilizes the SuperB indicator developed by RafaelZioni to determine the price trend direction, and judges trend reversals by tracking high and low prices in real time, realizing automatic tracking of upward and downward trends, avoiding missing buying points and overbuying risks. It belongs to a momentum strategy with trend following characteristics. This strategy combines momentum indicators to determine true trends with simple and clear rules. It can be further improved and optimized according to the optimization suggestions and is worth researching and applying.
[/trans]
Strategy Arguments
| Argument | Default | Description |
|---|---|---|
| v_input_1 | true | Only Long? |
| v_input_2 | 10 | len |
| v_input_3 | true | Multiplier |
| v_input_4 | 10 | Period |
| v_input_5 | 0.05 | Factor |
Source (PineScript)
/*backtest
start: 2023-01-01 00:00:00
end: 2023-08-19 00:00:00
period: 1d
basePeriod: 1h
exchanges: [{"eid":"Futures_Binance","currency":"BTC_USDT"}]
*/

//@version=4

strategy(shorttitle='SuperB', title='SuperB By RafaelZioni', overlay=true)
long_only = input(title="Only Long?", defval=true)

hilow = ((high - low)*100)
openclose = ((close - open)*100)
vol = (volume / hilow)
spreadvol = (openclose * vol)
VPT = spreadvol + cum(spreadvol)
window_len = 28

v_len = 14
price_spread = stdev(high-low, window_len)

vp =  spreadvol + cum(spreadvol)
smooth = sma(vp, v_len)
v_spread = stdev(vp - smooth, window_len)
shadow = (vp - smooth) / v_spread * price_spread

out = shadow > 0 ? high + shadow : low + shadow
//

len = input(10)


vpt=ema(out,len)

// INPUTS //
st_mult   = input(1,   title = ' Multiplier', minval = 0, maxval = 100, step = 0.01)
st_period = input(10, title = ' Period',     minval = 1)

// CALCULATIONS //
up= vpt - (st_mult * atr(st_period))
dn = vpt + (st_mult * atr(st_period))
c5=close
//

factor = input(title="Factor", defval=0.05, minval=0.01, maxval=5, step=0.01, type=input.float)

hb = 0.00 ,hb := nz(hb[1])
hl = 0.000, hl := nz(hl[1])

lb = 0.00 ,lb := nz(lb[1])
l1 = 0.000,l1 := nz(l1[1])

c = 0
c := nz(c[1]) + 1

trend = 0,trend := nz(trend[1]),n = dn,x =up


if barstate.isfirst
    c := 0
    lb := n
    hb := x
    l1 := c5
    hl := c5
    hl
if c == 1
    if x >= hb[1]
        hb := x
        hl := c5
        trend := 1
        trend
    else
        lb := n
        l1 := c5
        trend := -1
        trend

if c > 1

    if trend[1] > 0
        hl := max(hl[1], c5)
        if x >= hb[1]
            hb := x
            hb
        else


            if n < hb[1] - hb[1] * factor
                lb := n
                l1 := c5

                trend := -1
                trend
    else


        l1 := min(l1[1], c5 )

        if n <= lb[1]
            lb := n
            lb
        else


            if x > lb[1] + lb[1] * factor
                hb := x
                hl := c5

                trend := 1
                trend


v = trend == 1 ? hb : trend == -1 ? lb : na
plot(v, color=trend == 1 ? color.blue : color.yellow, style=plot.style_circles, linewidth=1, title="trend", transp=0, join=true)

//

long = trend == 1 and trend[1] == -1
short = trend == -1 and trend[1] == 1
//
last_long = 0.0
last_short = 0.0
last_long := long ? time : nz(last_long[1])
last_short := short ? time : nz(last_short[1])

buy = crossover(last_long, last_short)
sell = crossover(last_short, last_long)

/////////////// Positions //////////////
if long
    strategy.entry("Buy", long=true)
    if long_only == false
        strategy.close("Sell")

if short
    if long_only == false
        strategy.entry("Sell", long=false)
    strategy.close("Buy")

/////////////// Plotting ///////////////
plotshape(buy, title="buy", text="Buy", color=color.green, style=shape.labelup, location=location.belowbar, size=size.small, textcolor=color.white, transp=0)  //plot for buy icon
plotshape(sell, title="sell", text="Sell", color=color.red, style=shape.labeldown, location=location.abovebar, size=size.small, textcolor=color.white, transp=0)


/////////////// Alerts ///////////////
alertcondition(buy, title='buy', message='Buy')
alertcondition(sell, title='sell', message='Sell')
Detail
https://www.fmz.com/strategy/435238
Last Modified
2023-12-13 14:59:34