
8.7 KiB
Name
超越指标动量系统交易策略SMI-Ergodic-Oscillator-Momentum-Trading-Strategy
Author
ChaoZhang
Strategy Description
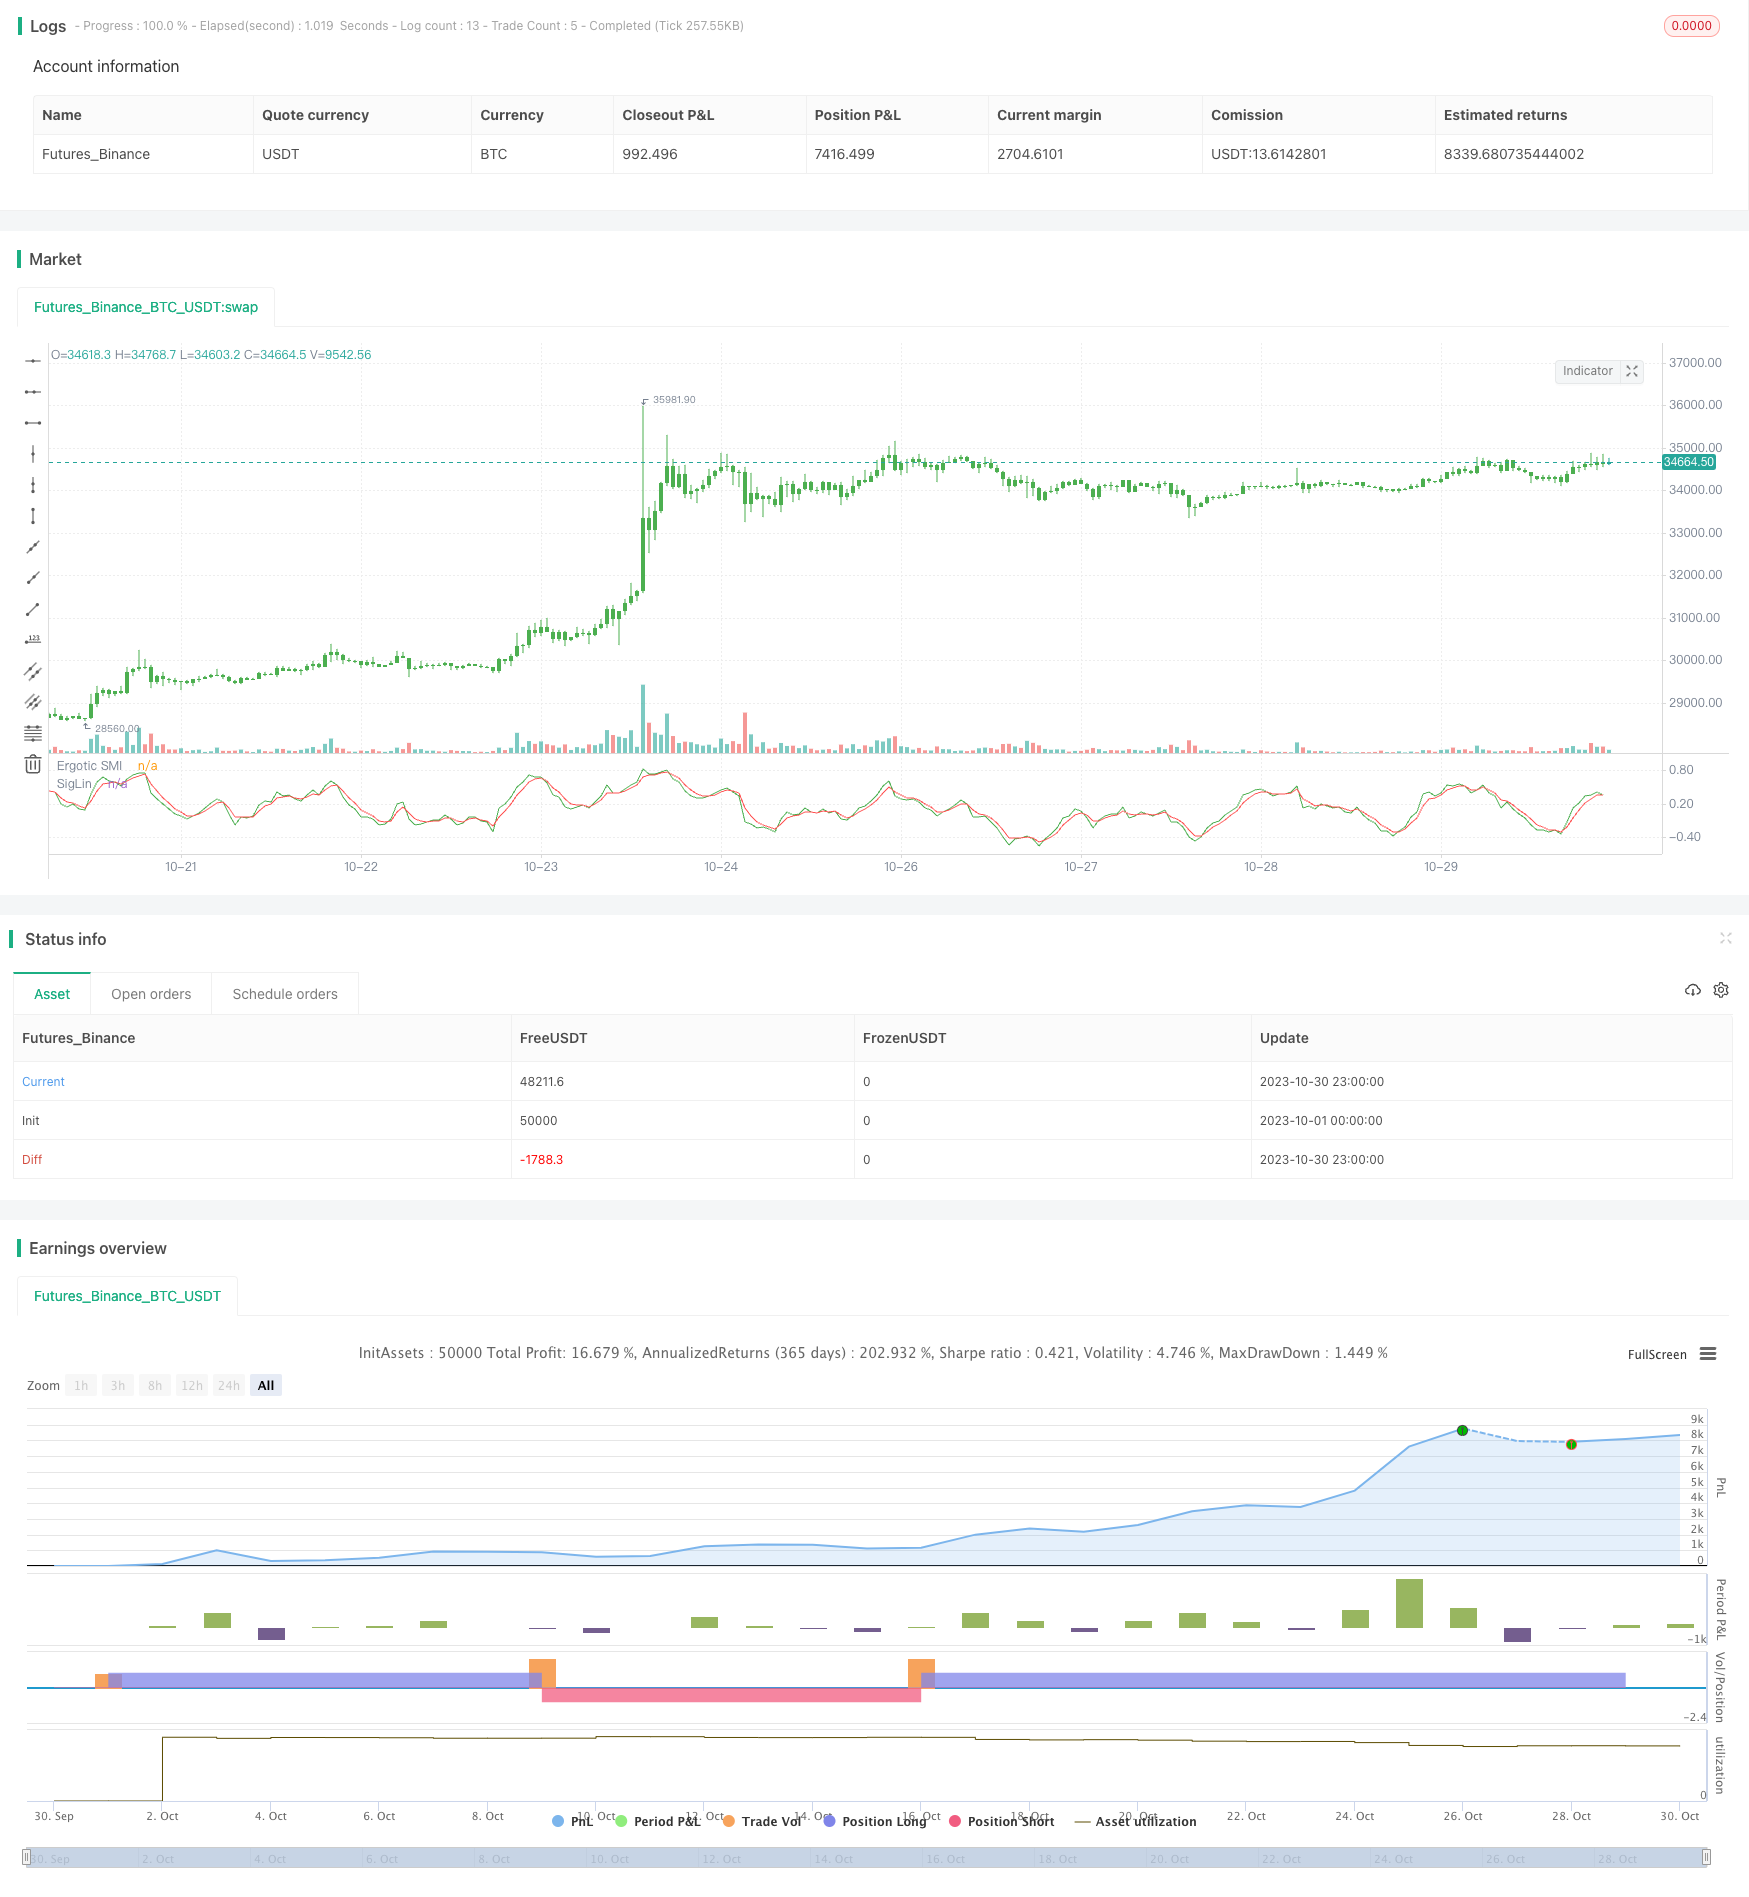
[trans]
概述
该策略基于超越指标(SMI)和悟道线(Ergotic Line)构建了一个趋势跟踪系统,结合快速移动均线和慢速移动均线形成买卖信号,属于频繁交易的动量系统策略。
策略原理
该策略主要是基于超越指标(SMI)和悟道线(Ergotic Line)来构建交易信号。
超越指标(SMI)是根据价格的变动速度进行计算,通过两个不同周期的指数移动平均线之差除以绝对差值来计算。其计算公式为:
SMI = (Fast EMA - Slow EMA) / Abs(Fast EMA - Slow EMA)
其中,Fast EMA是短周期的指数移动平均线,Slow EMA是长周期的指数移动平均线。
通过计算价格变动的速度快慢,SMI可以判断市场趋势的变化。当SMI上穿0时为看涨信号,反之为看跌信号。
悟道线(Ergotic Line)是SMI的指数移动平均线,可以用来产生交易信号。当SMI上穿悟道线时为买入信号,SMI下穿悟道线时为卖出信号。
该策略通过SMI和悟道线的组合,形成了一个无滞后的趋势跟踪系统,属于频繁交易的动量系统策略。
策略优势
-
基于价格变动速度的趋势判断,对趋势变化敏感;
-
悟道线过滤SMI指标的假信号,形成较为可靠的交易信号;
-
采用双轨道结构,买卖信号明确;
-
交易频繁,能捕捉趋势内的较快价格变动。
-
无滞后,能及时捕捉转折点。
策略风险
-
作为动量系统,在震荡行情中存在大量止损的风险;
-
双轨道设置不当可能导致信号频繁,造成过度交易;
-
短周期参数设置不当,可能产生大量假信号;
-
没有考虑大级别趋势方向,可能逆势操作。
-
需严格遵守止损规则,否则亏损可能加剧。
针对风险,可以考虑优化如下方面:
-
优化双轨道参数,降低假信号概率;
-
结合趋势过滤,避免逆势;
-
加入止损策略,控制单笔亏损。
策略优化方向
该策略可以从以下几个方面进行优化:
-
优化快慢均线参数,寻找最优参数组合;
-
测试不同的价格输入,如开盘价,最高价,最低价等;
-
加入机器学习算法,对参数进行自动优化;
-
结合趋势指标进行过滤,避免逆势交易;
-
增加止损策略,严格控制单笔亏损;
-
考虑交易次数或盈亏比等因素,避免过度交易;
-
测试不同品种的适用性,寻找最佳品种。
-
探索与其他指标的组合,形成更完善的交易系统。
总结
该策略基于超越指标和悟道线构建了一个无滞后的趋势跟踪系统,通过双轨道形成清晰的交易信号,属于频繁交易的动量策略。优点是捕捉趋势变化迅速,缺点是容易造成过度交易和逆势交易。我们可以通过参数优化、止损策略、趋势过滤等方式进行改进,将其打造成一个更完善的量化交易系统。
||
Overview
This strategy builds a trend following system based on the Superior Momentum Index (SMI) and Ergodic Line, generating trading signals through the combination of fast and slow moving averages. It belongs to a high-frequency momentum trading system.
Strategy Logic
The strategy mainly utilizes the Superior Momentum Index (SMI) and Ergodic Line to construct trading signals.
The SMI measures the speed of price changes by calculating the difference between two exponential moving averages of different periods divided by the absolute difference. Its formula is:
SMI = (Fast EMA - Slow EMA) / Abs(Fast EMA - Slow EMA)
Where Fast EMA is the short-period EMA and Slow EMA is the long-period EMA.
By gauging the speed of price movements, SMI can determine the trend changes in the market. A cross above 0 suggests an uptrend while a cross below 0 signals a downtrend.
The Ergodic Line is an EMA of SMI, which generates trade signals. A cross above the Ergodic Line is a buy signal while a cross below is a sell signal.
By combining SMI and the Ergodic Line, the strategy forms a lag-free trend following system, making it a high-frequency momentum trading strategy.
Advantages
-
Sensitive to trend changes based on price velocity.
-
Ergodic Line filters fake signals from SMI, forming reliable trade signals.
-
Clear buy/sell signals generated by the double rail structure.
-
High trading frequency to capture fast price movements within trends.
-
No lagging, able to capture turning points in a timely manner.
Risks
-
Prone to frequent stop loss in ranging markets as a momentum system.
-
Improper double rail settings may cause excessive trading due to frequent signals.
-
Bad short-term parameter tuning can lead to excessive false signals.
-
No consideration of major trend direction may lead to counter-trend trades.
-
Strict stop loss rules must be followed, otherwise losses could mount.
To address the risks, the following aspects can be considered for optimization:
-
Optimize double rail parameters to reduce false signals.
-
Add trend filter to avoid counter-trend trades.
-
Implement stop loss strategies to control single trade loss.
Optimization Directions
The strategy can be improved in the following aspects:
-
Optimize fast and slow EMA parameters to find the optimal parameter combination.
-
Test different price inputs like open, high, low prices etc.
-
Incorporate machine learning algorithms to auto-optimize parameters.
-
Add trend filters to avoid counter-trend trades.
-
Implement stop loss strategies to strictly control single trade loss.
-
Consider trading frequency and profit factor to prevent over-trading.
-
Test applicability across different products to find the optimal asset.
-
Explore combinations with other indicators to build a more comprehensive system.
Conclusion
The strategy constructs a lag-free trend following system using SMI and Ergodic Line, generating clear trade signals through the double rail structure. It belongs to a high-frequency momentum trading strategy. The advantage is quickly capturing trend changes while the disadvantages include over-trading and counter-trend trades. Improvements can be made through parameter optimization, stop loss, trend filters etc. to build a more robust quantitative trading system.
[/trans]
Strategy Arguments
| Argument | Default | Description |
|---|---|---|
| v_input_1 | 4 | fastPeriod |
| v_input_2 | 8 | slowPeriod |
| v_input_3 | 3 | SmthLen |
| v_input_4 | 0.5 | TopBand |
| v_input_5 | -0.5 | LowBand |
| v_input_6 | false | Trade reverse |
Source (PineScript)
/*backtest
start: 2023-10-01 00:00:00
end: 2023-10-31 00:00:00
period: 1h
basePeriod: 15m
exchanges: [{"eid":"Futures_Binance","currency":"BTC_USDT"}]
*/

//@version=2
////////////////////////////////////////////////////////////
//  Copyright by HPotter v1.0 03/11/2017
// The SMI Ergodic Indicator is the same as the True Strength Index (TSI) developed by
// William Blau, except the SMI includes a signal line. The SMI uses double moving averages
// of price minus previous price over 2 time frames. The signal line, which is an EMA of the
// SMI, is plotted to help trigger trading signals. Adjustable guides are also given to fine
// tune these signals. The user may change the input (close), method (EMA), period lengths
// and guide values.
// You can use in the xPrice any series: Open, High, Low, Close, HL2, HLC3, OHLC4 and ect...
//
// You can change long to short in the Input Settings
// WARNING:
// - For purpose educate only
// - This script to change bars colors.
////////////////////////////////////////////////////////////
strategy(title="SMI Ergodic Oscillator")
fastPeriod = input(4, minval=1)
slowPeriod = input(8, minval=1)
SmthLen = input(3, minval=1)
TopBand = input(0.5, step=0.1)
LowBand = input(-0.5, step=0.1)
reverse = input(false, title="Trade reverse")
// hline(0, color=gray, linestyle=dashed)
// hline(TopBand, color=red, linestyle=line)
// hline(LowBand, color=green, linestyle=line)
xPrice = close
xPrice1 = xPrice - xPrice[1]
xPrice2 = abs(xPrice - xPrice[1])
xSMA_R = ema(ema(xPrice1,fastPeriod),slowPeriod)
xSMA_aR = ema(ema(xPrice2, fastPeriod),slowPeriod)
xSMI = xSMA_R / xSMA_aR
xEMA_SMI = ema(xSMI, SmthLen)
pos = iff(xEMA_SMI < LowBand, -1,
	   iff(xEMA_SMI > TopBand, 1, nz(pos[1], 0)))
possig = iff(reverse and pos == 1, -1,
          iff(reverse and pos == -1, 1, pos))
if (possig == 1)
    strategy.entry("Long", strategy.long)
if (possig == -1)
    strategy.entry("Short", strategy.short)
barcolor(possig == -1 ? red: possig == 1 ? green : blue )
plot(xSMI, color=green, title="Ergotic SMI")
plot(xEMA_SMI, color=red, title="SigLin")
Detail
https://www.fmz.com/strategy/430740
Last Modified
2023-11-01 11:19:18