
12 KiB
Name
超级动量策略Super-Momentum-Strategy
Author
ChaoZhang
Strategy Description
 [trans]
概述
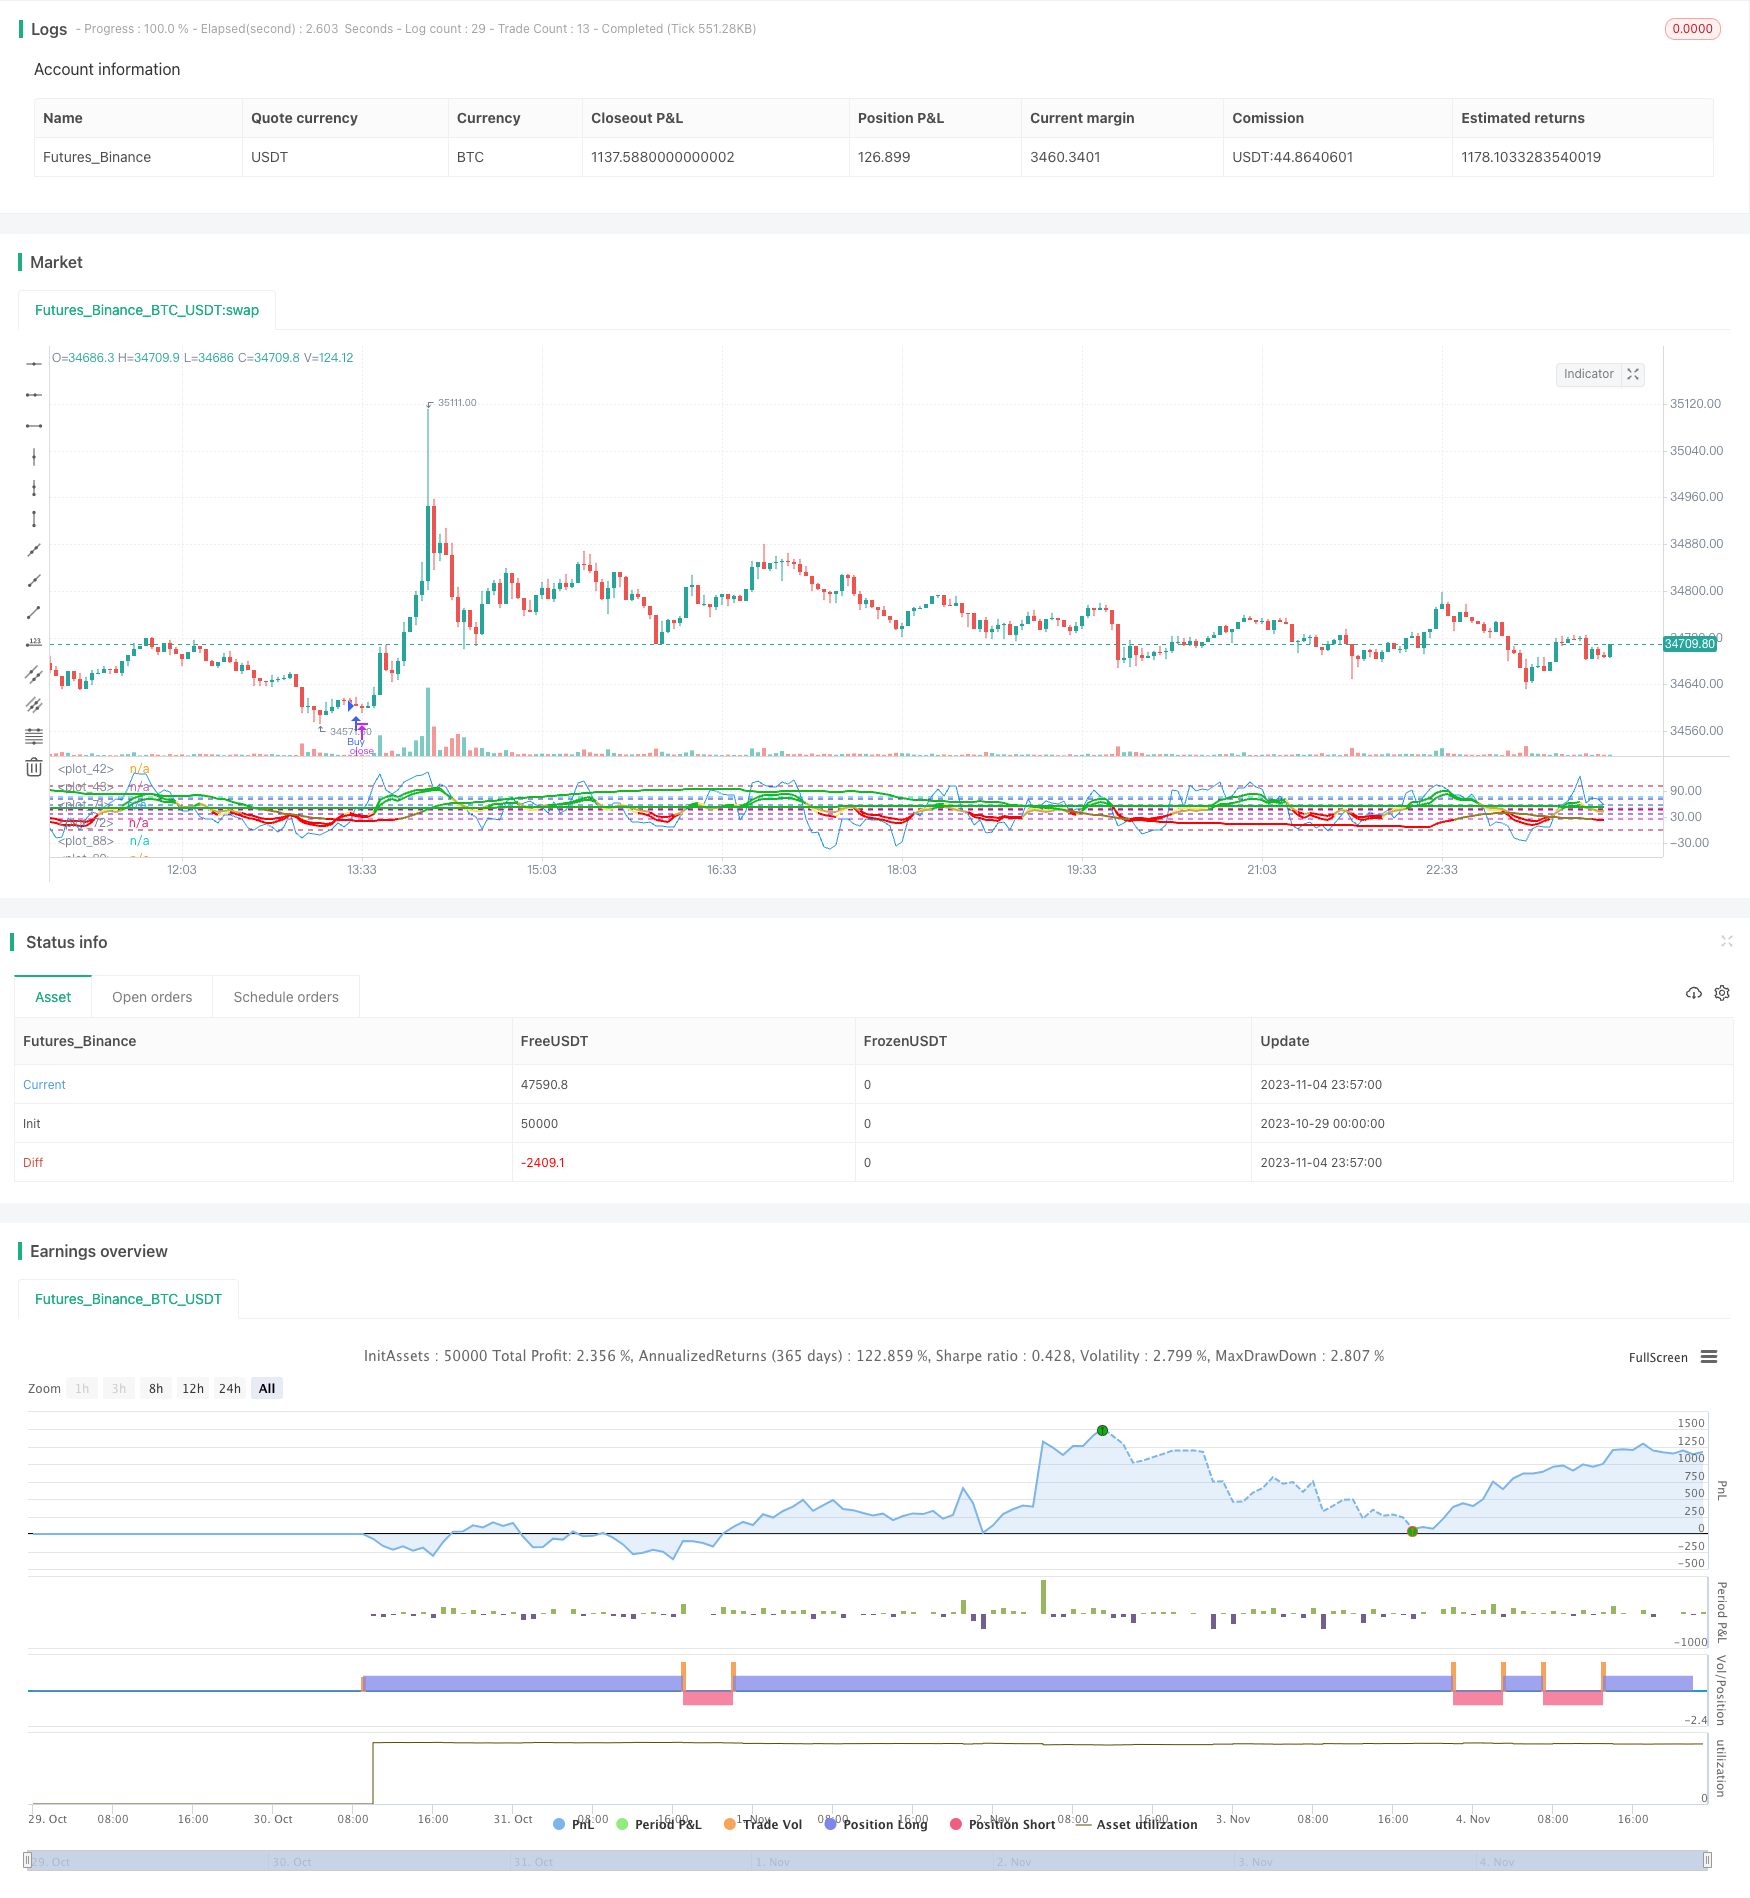
超级动量策略综合运用了多种动量指标,在多个动量指标同时看多或看空时,进行买入或卖出操作。该策略通过组合多个动量指标,可以更准确地捕捉价格趋势,避免单一指标造成的错误信号。
策略原理
该策略同时使用了4个Everget的RMI指标和1个Chande动量摆动指标。RMI指标基于价格动量计算得出,可以判断价格上涨和下跌力度。Chande MO则通过计算价格变化,来判断市场的超买超卖情况。
当RMI5上穿其买入线,RMI4下穿其买入线,RMI3下穿其买入线,RMI2下穿其买入线,RMI1下穿其买入线,且Chande MO上穿其买入线时,进行买入操作。
当RMI5下穿其卖出线,RMI4上穿其卖出线,RMI3上穿其卖出线,RMI2上穿其卖出线,RMI1上穿其卖出线,且Chande MO下穿其卖出线时,进行卖出操作。
RMI5设置为与其他RMI指标相反的方向,这可以更好地识别趋势,进行金字塔操作。
优势分析
-
综合多个指标,可以更准确判断趋势,避免单一指标错误信号
-
包含多时间周期指标,能识别更大级别的趋势
-
反向RMI指标可以辅助进行趋势识别和金字塔操作
-
Chande MO有助于避免超买超卖情况下的错误交易
风险分析
-
过多指标组合,参数设置复杂,需要仔细测试优化
-
多指标同时变化时,可能会产生错误信号
-
综合多个指标,交易频率可能会比较低
-
需要关注指标参数是否适合不同品种和市场环境
优化方向
-
测试指标参数设置,优化参数以提高策略稳定性
-
尝试增加或减少一些指标,评估对信号质量的影响
-
可以引入一些过滤条件,避免在特定市场情况下的错误信号
-
调整指标的买卖线位置,找到最优参数组合
-
考虑加入止损机制来控制风险
总结
本策略通过综合运用多种动量指标,提高了对市场趋势的判断能力。但参数设置较复杂,需要仔细测试优化,不断改进和调整。如果使用得当,有望获取较优的交易信号,在追踪市场趋势方面具有一定优势。但交易者仍需关注风险,寻找最佳参数组合,并加入风险控制机制,以进行稳定交易。
||
Overview
The Super Momentum strategy combines multiple momentum indicators. It buys when multiple momentum indicators are bullish concurrently, and sells when they are bearish concurrently. By integrating multiple momentum indicators, it aims to capture price trends more accurately and avoid false signals from individual indicators.
Strategy Logic
The strategy uses 4 RMI indicators by Everget and 1 Chande Momentum Oscillator. RMI measures price momentum to gauge bullish and bearish strength. Chande MO calculates price change to identify overbought and oversold conditions.
It goes long when RMI5 crosses above its buy line, RMI4 crosses below its buy line, RMI3 crosses below its buy line, RMI2 crosses below its buy line, RMI1 crosses below its buy line, and Chande MO crosses above its buy line.
It goes short when RMI5 crosses below its sell line, RMI4 crosses above its sell line, RMI3 crosses above its sell line, RMI2 crosses above its sell line, RMI1 crosses above its sell line, and Chande MO crosses below its sell line.
RMI5 is set opposite to other RMI to better identify trends for pyramid trading.
Advantage Analysis
-
Combining multiple indicators improves trend accuracy and avoids false signals
-
Indicators across timeframes catch larger trends
-
Reverse RMI aids in trend identification and pyramiding
-
Chande MO prevents bad trades in overbought/oversold conditions
Risk Analysis
-
Complex parameters with multiple indicators need thorough optimization
-
Concurrent indicator moves may generate false signals
-
Lower trade frequency with multiple filters
-
Parameters may not suit different products and market regimes
Optimization Directions
-
Test and optimize parameters for strategy robustness
-
Add/remove indicators to evaluate signal quality impact
-
Introduce filters to avoid false signals in certain markets
-
Adjust indicator buy/sell lines to find optimal combinations
-
Consider adding stop loss for risk control
Conclusion
This strategy improves trend judgment by integrating momentum indicators. But parameter optimization is crucial due to complexity. If well-tuned, it can generate quality signals and has an edge in trend following. But traders should watch for risks, find optimal parameters, and incorporate risk controls for steady trading.
[/trans]
Strategy Arguments
| Argument | Default | Description |
|---|---|---|
| v_input_1 | 2021 | Backtest Start Year |
| v_input_2 | true | Backtest Start Month |
| v_input_3 | true | Backtest Start Day |
| v_input_4 | 999999 | Backtest Stop Year |
| v_input_5 | 9 | Backtest Stop Month |
| v_input_6 | 26 | Backtest Stop Day |
| v_input_7_close | 0 | Price: close |
| v_input_8 | true | Highlight Overbought/Oversold Breakouts ? |
| v_input_9 | 9 | Alpha Chande Momentum Length |
| v_input_10 | 75 | Chande Sellline |
| v_input_11 | 25 | Chande Buyline |
| v_input_12 | 8 | RMI1 Length |
| v_input_13 | 3 | RMI1 Momentum |
| v_input_14 | 57 | RMI1 Sellline |
| v_input_15 | 37 | RMI1 Buyline |
| v_input_16 | 12 | RMI2 Length |
| v_input_17 | 3 | RMI2 Momentum |
| v_input_18 | 72 | RMI2 Sellline |
| v_input_19 | 37 | RMI2 Buyline |
| v_input_20 | 30 | RMI3 Length |
| v_input_21 | 53 | RMI3 Momentum |
| v_input_22 | 46 | RMI3 Sellline |
| v_input_23 | 24 | RMI3 Buyline |
| v_input_24 | 520 | RMI4 Length |
| v_input_25 | 137 | RMI4 Momentum |
| v_input_26 | false | RMI4 Sellline |
| v_input_27 | 100 | RMI4 Buyline |
| v_input_28 | 520 | RMI5 Length |
| v_input_29 | 137 | RMI5 Momentum |
| v_input_30 | false | RMI5 Buy Above |
| v_input_31 | 47 | RMI5 Sell Below |
Source (PineScript)
/*backtest
start: 2023-10-29 00:00:00
end: 2023-11-05 00:00:00
period: 3m
basePeriod: 1m
exchanges: [{"eid":"Futures_Binance","currency":"BTC_USDT"}]
*/

//@version=4
strategy(title="Super Momentum Strat", shorttitle="SMS", format=format.price, precision=2)

//* Backtesting Period Selector | Component *//
//* https://www.tradingview.com/script/eCC1cvxQ-Backtesting-Period-Selector-Component *//
//* https://www.tradingview.com/u/pbergden/ *//
//* Modifications made *//
testStartYear = input(2021, "Backtest Start Year")
testStartMonth = input(1, "Backtest Start Month")
testStartDay = input(1, "Backtest Start Day")
testPeriodStart = timestamp(testStartYear,testStartMonth,testStartDay,0,0)

testStopYear = input(999999, "Backtest Stop Year")
testStopMonth = input(9, "Backtest Stop Month")
testStopDay = input(26, "Backtest Stop Day")
testPeriodStop = timestamp(testStopYear,testStopMonth,testStopDay,0,0)

testPeriod() => true
/////////////// END - Backtesting Period Selector | Component ///////////////


src = input(close, "Price", type = input.source)
highlightBreakouts = input(title="Highlight Overbought/Oversold Breakouts ?", type=input.bool, defval=true)

CMOlength = input(9, minval=1, title="Alpha Chande Momentum Length")


//CMO
momm = change(src)
f1(m) => m >= 0.0 ? m : 0.0
f2(m) => m >= 0.0 ? 0.0 : -m
m1 = f1(momm)
m2 = f2(momm)
sm1 = sum(m1, CMOlength)
sm2 = sum(m2, CMOlength)
percent(nom, div) => 100 * nom / div
chandeMO = percent(sm1-sm2, sm1+sm2)+50
plot(chandeMO, "Chande MO", color=color.blue)

obLevel = input(75, title="Chande Sellline")
osLevel = input(25, title="Chande Buyline")
hline(obLevel, color=#0bc4d9)
hline(osLevel, color=#0bc4d9)


///
///RMIS
//
// Copyright (c) 2018-present, Alex Orekhov (everget)
// Relative Momentum Index script may be freely distributed under the MIT license.
//
///
///


//RMI1
length1 = input(title="RMI1 Length", type=input.integer, minval=1, defval=8)
momentumLength1 = input(title="RMI1 Momentum ", type=input.integer, minval=1, defval=3)
up1 = rma(max(change(src, momentumLength1), 0), length1)
down1 = rma(-min(change(src, momentumLength1), 0), length1)

rmi1 = down1 == 0 ? 100 : up1 == 0 ? 0 : 100 - (100 / (1 + up1 / down1))

obLevel1 = input(57, title="RMI1 Sellline")
osLevel1 = input(37, title="RMI1 Buyline")

rmiColor1 = rmi1 > obLevel1 ? #0ebb23 : rmi1 < osLevel1 ? #ff0000 : #ffe173
plot(rmi1, title="RMI 1", linewidth=2, color=rmiColor1, transp=0)
hline(obLevel1, color=#0b57d9)
hline(osLevel1, color=#0b57d9)


//RMI2
length2 = input(title="RMI2 Length", type=input.integer, minval=1, defval=12)
momentumLength2 = input(title="RMI2 Momentum ", type=input.integer, minval=1, defval=3)
up2 = rma(max(change(src, momentumLength1), 0), length2)
down2 = rma(-min(change(src, momentumLength1), 0), length2)

rmi2 = down2 == 0 ? 100 : up1 == 0 ? 0 : 100 - (100 / (1 + up2 / down2))

obLevel2 = input(72, title="RMI2 Sellline")
osLevel2 = input(37, title="RMI2 Buyline")

rmiColor2 = rmi1 > obLevel1 ? #0ebb23 : rmi2 < osLevel2 ? #ff0000 : #c9ad47
plot(rmi2, title="RMI 2", linewidth=2, color=rmiColor2, transp=0)
hline(obLevel2, color=#5a0bd9)
hline(osLevel2, color=#5a0bd9)

//RMI3
length3 = input(title="RMI3 Length", type=input.integer, minval=1, defval=30)
momentumLength3 = input(title="RMI3 Momentum ", type=input.integer, minval=1, defval=53)
up3 = rma(max(change(src, momentumLength3), 0), length3)
down3 = rma(-min(change(src, momentumLength3), 0), length3)

rmi3 = down3 == 0 ? 100 : up3 == 0 ? 0 : 100 - (100 / (1 + up3 / down3))

obLevel3 = input(46, title="RMI3 Sellline")
osLevel3 = input(24, title="RMI3 Buyline")

rmiColor3 = rmi3 > obLevel3 ? #0ebb23 : rmi3 < osLevel3 ? #ff0000 : #967d20
plot(rmi3, title="RMI 3", linewidth=2, color=rmiColor3, transp=0)
hline(obLevel3, color=#cf0bd9)
hline(osLevel3, color=#cf0bd9)
//RMI4
length4 = input(title="RMI4 Length", type=input.integer, minval=1, defval=520)
momentumLength4 = input(title="RMI4 Momentum ", type=input.integer, minval=1, defval=137)
up4 = rma(max(change(src, momentumLength4), 0), length4)
down4 = rma(-min(change(src, momentumLength4), 0), length4)

rmi4 = down4 == 0 ? 100 : up4 == 0 ? 0 : 100 - (100 / (1 + up4 / down4))

obLevel4 = input(0, title="RMI4 Sellline")
osLevel4 = input(100, title="RMI4 Buyline")

rmiColor4 = rmi4 > obLevel4 ? #0ebb23 : rmi4 < osLevel4 ? #ff0000 : #7a630b
plot(rmi4, title="RMI 4", linewidth=2, color=rmiColor4, transp=0)
hline(obLevel4, color=#bd1150)
hline(osLevel4, color=#bd1150)


//RMI5
length5 = input(title="RMI5 Length", type=input.integer, minval=1, defval=520)
momentumLength5 = input(title="RMI5 Momentum ", type=input.integer, minval=1, defval=137)
up5 = rma(max(change(src, momentumLength5), 0), length5)
down5 = rma(-min(change(src, momentumLength5), 0), length5)

rmi5 = down5 == 0 ? 100 : up4 == 0 ? 0 : 100 - (100 / (1 + up5 / down5))

buy5 = input(0, title="RMI5 Buy Above")
sell5 = input(47, title="RMI5 Sell Below")

rmiColor5 = rmi5 > buy5 ? #0ebb23 : rmi5 < sell5 ? #ff0000 : #7a630b
plot(rmi5, title="RMI 5", linewidth=2, color=rmiColor5, transp=0)
hline(buy5, color=#bd1150)
hline(sell5, color=#bd1150)
///
///END RMIS
//
//
// Relative Momentum Index script may be freely distributed under the MIT license.
//
///
///

hline(50, color=#C0C0C0, linestyle=hline.style_dashed, title="Zero Line")

//alerts


longcondition1 = crossover(chandeMO, osLevel)
shortcondition1 = crossunder(chandeMO, obLevel)
longcondition2 = rmi5>buy5 and rmi4<osLevel4 and rmi3<osLevel3 and rmi2<osLevel2 and rmi1<osLevel1 and longcondition1
shortcondition2 =  rmi5<sell5 and rmi4>obLevel4 and rmi3>obLevel3 and rmi2>obLevel2 and rmi1>obLevel1 and shortcondition1

if testPeriod()
    if longcondition2
        strategy.entry("Buy", strategy.long)
    if shortcondition2
        strategy.entry("Sell", strategy.short)
Detail
https://www.fmz.com/strategy/431210
Last Modified
2023-11-06 09:24:02