
8.3 KiB
Name
融合反转与未来推移均线的量化交易策略Quantitative-Trading-Strategy-Integrating-Reversal-and-Future-Lines-of-Demarcation
Author
ChaoZhang
Strategy Description
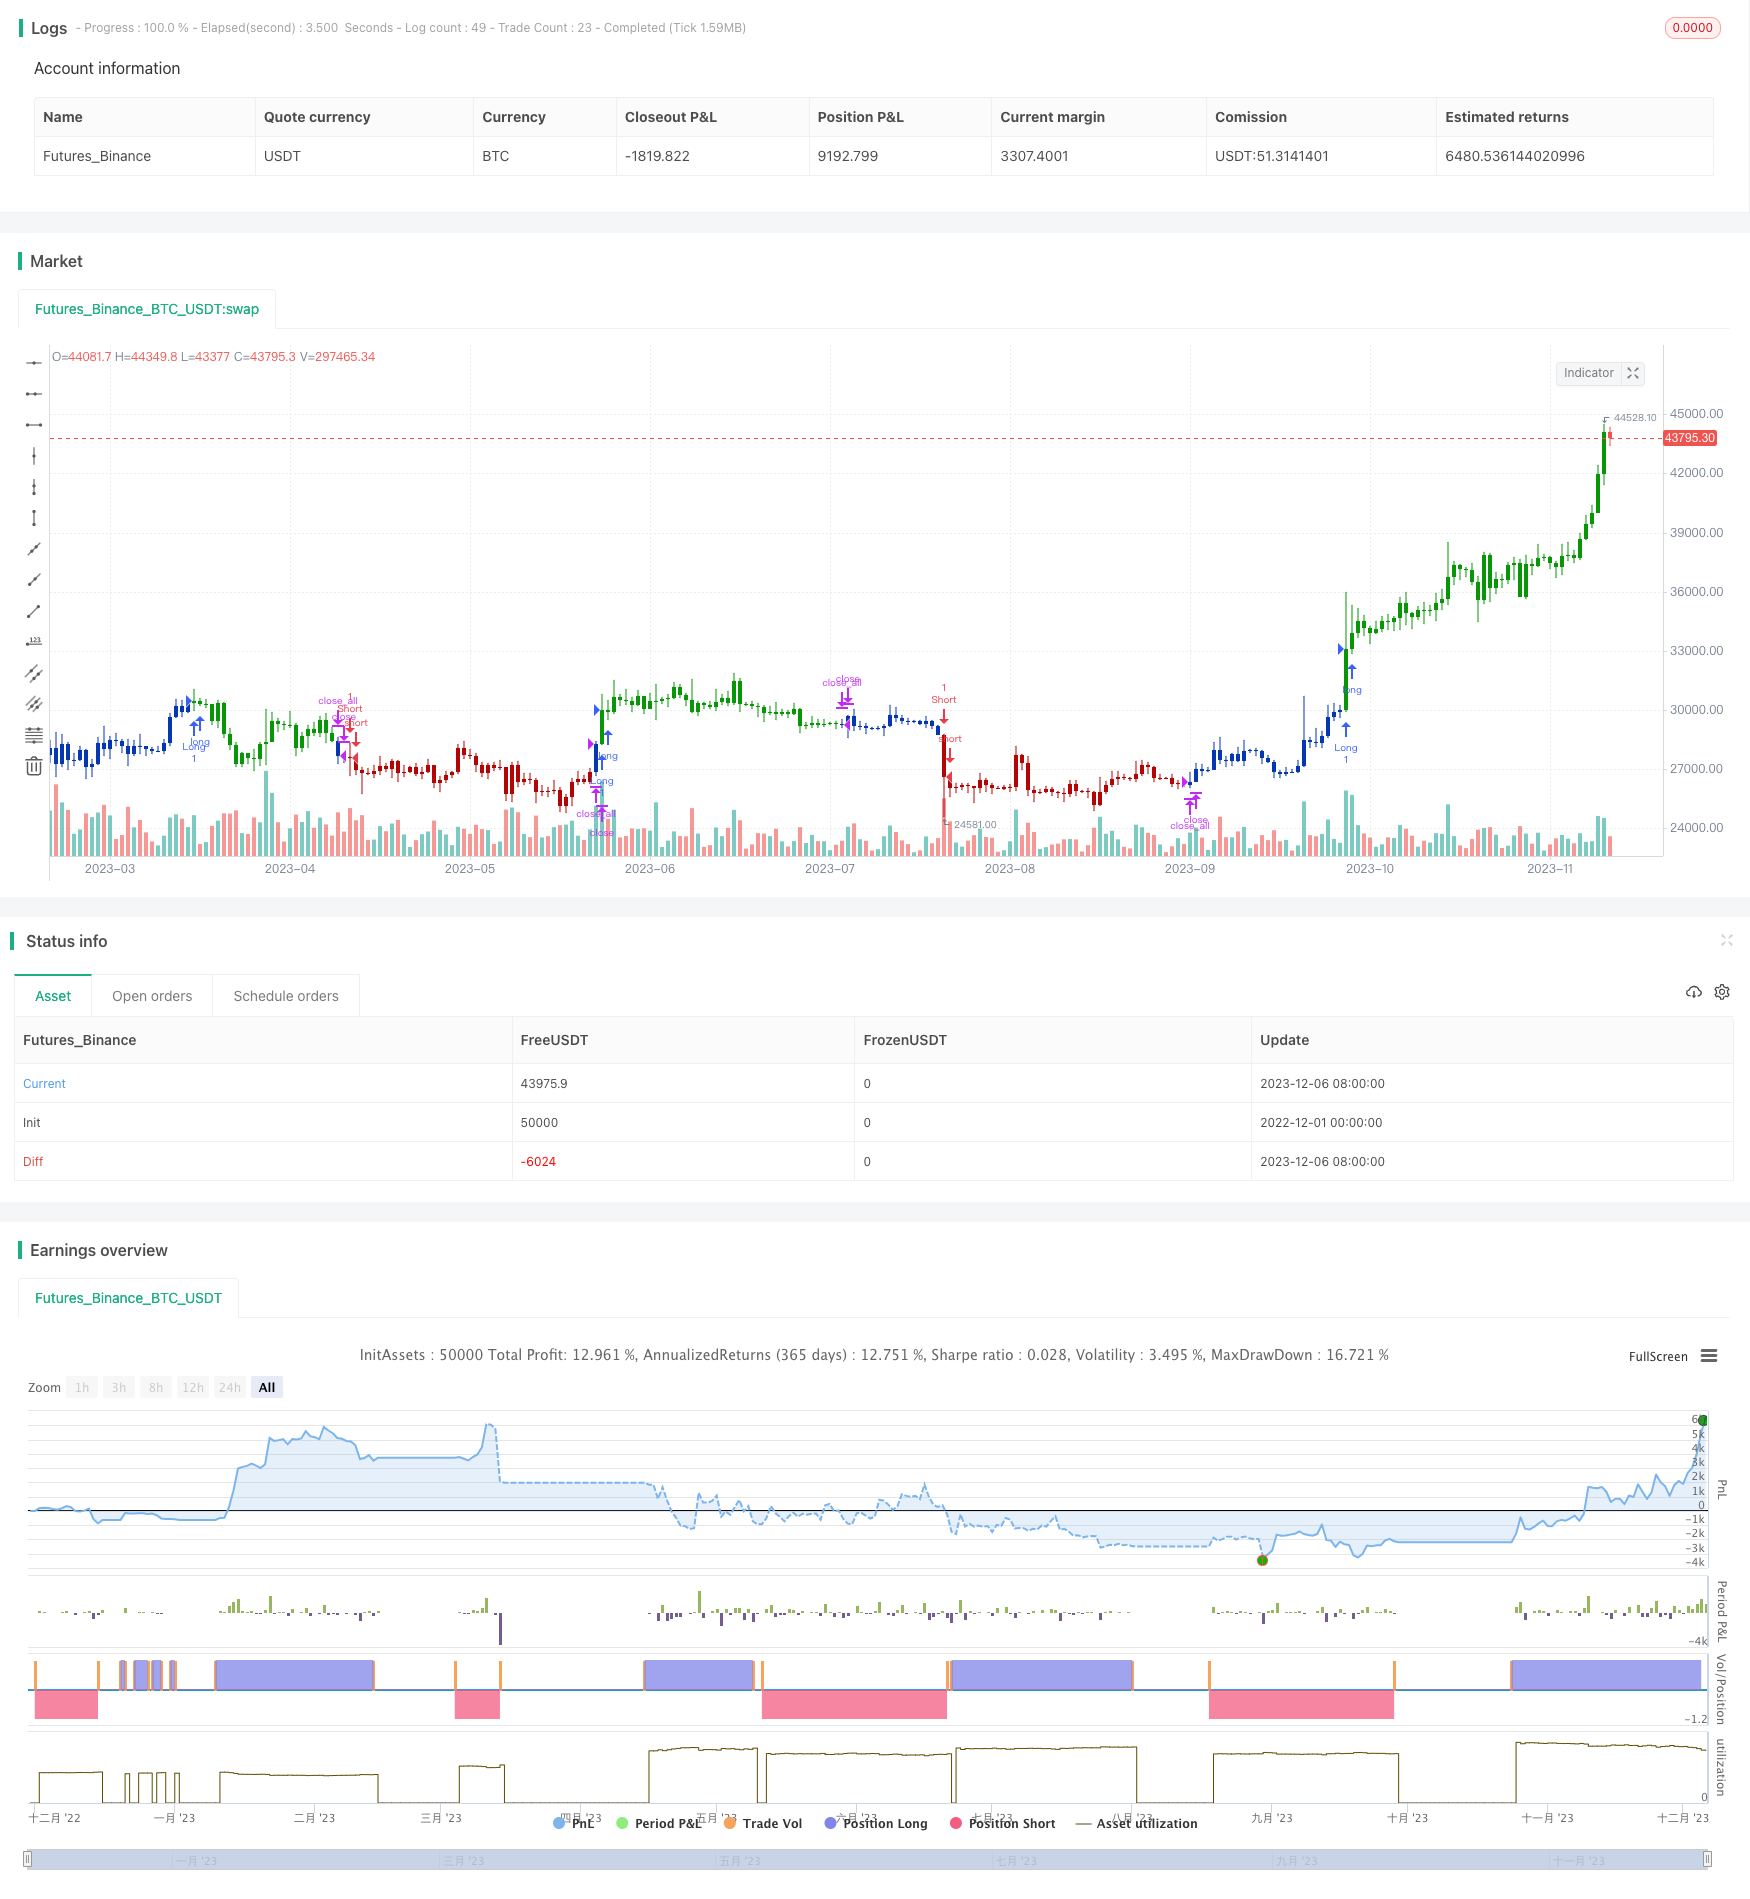 [trans]
概述
该策略融合了123反转策略和未来推移均线策略,实现了当两个策略同时发出信号时进行 entrada 或 salida 的量化交易策略。该策略主要应用于股指期货市场,通过捕捉短期反转信号和中长期趋势信号的组合,实现了中短期持仓交易。
策略原理
123反转策略
123反转策略源自《我如何在期货市场上将资金翻三番》一书。该策略在连续两天收盘价出现反转时并且9日慢速K线低于50时做多;在连续两天收盘价出现反转时并且9日快速K线高于50时做空。
未来推移均线策略
未来推移均线策略(Future Lines of Demarcation,FLD)是一种基于价格波动周期性规律的趋势跟踪策略。FLD线基于价格的中值、高值或低值向未来平移约半个周期绘制,当价格线穿过FLD线时产生交易信号。
优势分析
该策略结合反转策略和趋势跟踪策略,能同时捕捉短期市场反转机会与中长期趋势走向,实现了多时间尺度的量化交易。反转策略提供了短期获利机会,趋势跟踪部分能确保整体交易方向与趋势一致,有效控制了交易风险。此外,未来推移均线的自适应特性也增强了策略的稳定性。
风险分析
该策略主要面临反转信号假突破的风险以及FLD线判断出现错误的风险。对于前者,可以通过调整参数确认反转信号,或增加其他辅助判定指标来提高判断准确率。对于后者,则需要优化参数,确保其能更准确描述市场的波段规律。此外,也需要警惕大周期趋势反转时FLD线出错的可能性。
优化方向
- 改进反转策略,增加其他指标过滤确认信号,降低假突破概率
- 对比不同FLD线参数看是否能更准确描述周期规律
- 添加止损逻辑,以控制单笔损失风险
- 测试不同品种参数效果
总结
该策略结合反转与趋势的交易理念,在中短期时间框架实现稳定盈利。未来可从确认信号准确性、描述趋势准确性、控制风险等方面进行优化,使策略参数范围更广、稳定性更强。
||
Overview
This strategy integrates the 123 reversal strategy and future lines of demarcation (FLD) strategy to implement a quantitative trading strategy that enters or exits positions when both strategies generate signals simultaneously. It is mainly applied to index futures markets, capturing opportunities from combinations of short-term reversal signals and medium-long term trend signals for medium-short term holding trades.
Principles
123 Reversal Strategy
The 123 reversal strategy originates from the book "How I Tripled My Money in the Futures Market". It goes long when the closing price shows reversal patterns for two continuous days and the 9-day slow stochastics is below 50; It goes short when the closing price shows reversal patterns for two continuous days and the 9-day fast stochastics is above 50.
Future Lines of Demarcation Strategy
The future lines of demarcation (FLD) strategy is a trend-following strategy based on the periodicity of price fluctuations. FLD lines are plotted by shifting the median, high or low prices approximately half a cycle into the future. Trading signals are generated when prices cross the FLD lines.
Advantage Analysis
This strategy combines reversal and trend-following strategies, capturing both short-term reversal opportunities and medium-long term trend directions on multiple time frames for quantitative trading. The reversal element provides short-term profit-taking chances while the trend-following part ensures the overall trading aligns with the trend, effectively controlling trading risks. Moreover, the adaptive nature of FLD also enhances the stability of the strategy.
Risk Analysis
The main risks of this strategy come from false breakouts of reversal signals and errors in FLD line judgments. For the former, parameters can be adjusted to confirm reversal signals or add other auxiliary indicators to improve accuracy. For the latter, parameters need to be optimized to ensure FLD describes market cycles more precisely. Additionally, mistakes of FLD when major trend reversals occur should also be watched out for.
Optimization Directions
- Improve reversal strategy by adding other indicators to filter signals and decrease false breakout possibilities
- Compare different FLD parameters to better describe cyclical patterns
- Add stop loss logic to control single loss risks
- Test parameter effectiveness across different products
Conclusion
This strategy combines reversal and trend-following concepts for stable profits over medium-short term time frames. Future optimizations in aspects of signal accuracy, trend description capability and risk control will expand its parameter universe and improve stability.
[/trans]
Strategy Arguments
| Argument | Default | Description |
|---|---|---|
| v_input_1 | 15 | Length |
| v_input_2 | true | KSmoothing |
| v_input_3 | 3 | DLength |
| v_input_4 | 50 | Level |
| v_input_5 | 40 | Period |
| v_input_6_close | 0 | Source: close |
| v_input_7 | false | Trade reverse |
Source (PineScript)
/*backtest
start: 2022-12-01 00:00:00
end: 2023-12-07 00:00:00
period: 1d
basePeriod: 1h
exchanges: [{"eid":"Futures_Binance","currency":"BTC_USDT"}]
*/

//@version=4
////////////////////////////////////////////////////////////
//  Copyright by HPotter v1.0 28/08/2020
// This is combo strategies for get a cumulative signal.
//
// First strategy
// This System was created from the Book "How I Tripled My Money In The
// Futures Market" by Ulf Jensen, Page 183. This is reverse type of strategies.
// The strategy buys at market, if close price is higher than the previous close
// during 2 days and the meaning of 9-days Stochastic Slow Oscillator is lower than 50.
// The strategy sells at market, if close price is lower than the previous close price
// during 2 days and the meaning of 9-days Stochastic Fast Oscillator is higher than 50.
//
// Second strategy
//  An FLD is a line that is plotted on the same scale as the price and is in fact the
//  price itself displaced to the right (into the future) by (approximately) half the
//  wavelength of the cycle for which the FLD is plotted. There are three FLD's that can be
//  plotted for each cycle:
//    An FLD based on the median price.
//    An FLD based on the high price.
//    An FLD based on the low price.
//
// WARNING:
// - For purpose educate only
// - This script to change bars colors.
////////////////////////////////////////////////////////////
Reversal123(Length, KSmoothing, DLength, Level) =>
    vFast = sma(stoch(close, high, low, Length), KSmoothing)
    vSlow = sma(vFast, DLength)
    pos = 0.0
    pos := iff(close[2] < close[1] and close > close[1] and vFast < vSlow and vFast > Level, 1,
	         iff(close[2] > close[1] and close < close[1] and vFast > vSlow and vFast < Level, -1, nz(pos[1], 0)))
	pos


FLD(Period,src) =>
    pos = 0
    pos := iff(src[Period] < close , 1,
             iff(src[Period] > close, -1, nz(pos[1], 0)))
    pos

strategy(title="Combo Backtest 123 Reversal & FLD's - Future Lines of Demarcation", shorttitle="Combo", overlay = true)
Length = input(15, minval=1)
KSmoothing = input(1, minval=1)
DLength = input(3, minval=1)
Level = input(50, minval=1)
//-------------------------
Period = input(title="Period", defval=40)
src = input(title="Source", type=input.source, defval=close)
reverse = input(false, title="Trade reverse")
posReversal123 = Reversal123(Length, KSmoothing, DLength, Level)
posFLD = FLD(Period,src)
pos = iff(posReversal123 == 1 and posFLD == 1 , 1,
	   iff(posReversal123 == -1 and posFLD == -1, -1, 0))
possig = iff(reverse and pos == 1, -1,
          iff(reverse and pos == -1 , 1, pos))
if (possig == 1)
    strategy.entry("Long", strategy.long)
if (possig == -1)
    strategy.entry("Short", strategy.short)
if (possig == 0)
    strategy.close_all()
barcolor(possig == -1 ? #b50404: possig == 1 ? #079605 : #0536b3 )
Detail
https://www.fmz.com/strategy/434682
Last Modified
2023-12-08 12:00:35