
8.9 KiB
Name
自适应ATR-ADX趋势策略V2An-Adaptive-ATR-ADX-Trend-Strategy-V2
Author
ChaoZhang
Strategy Description
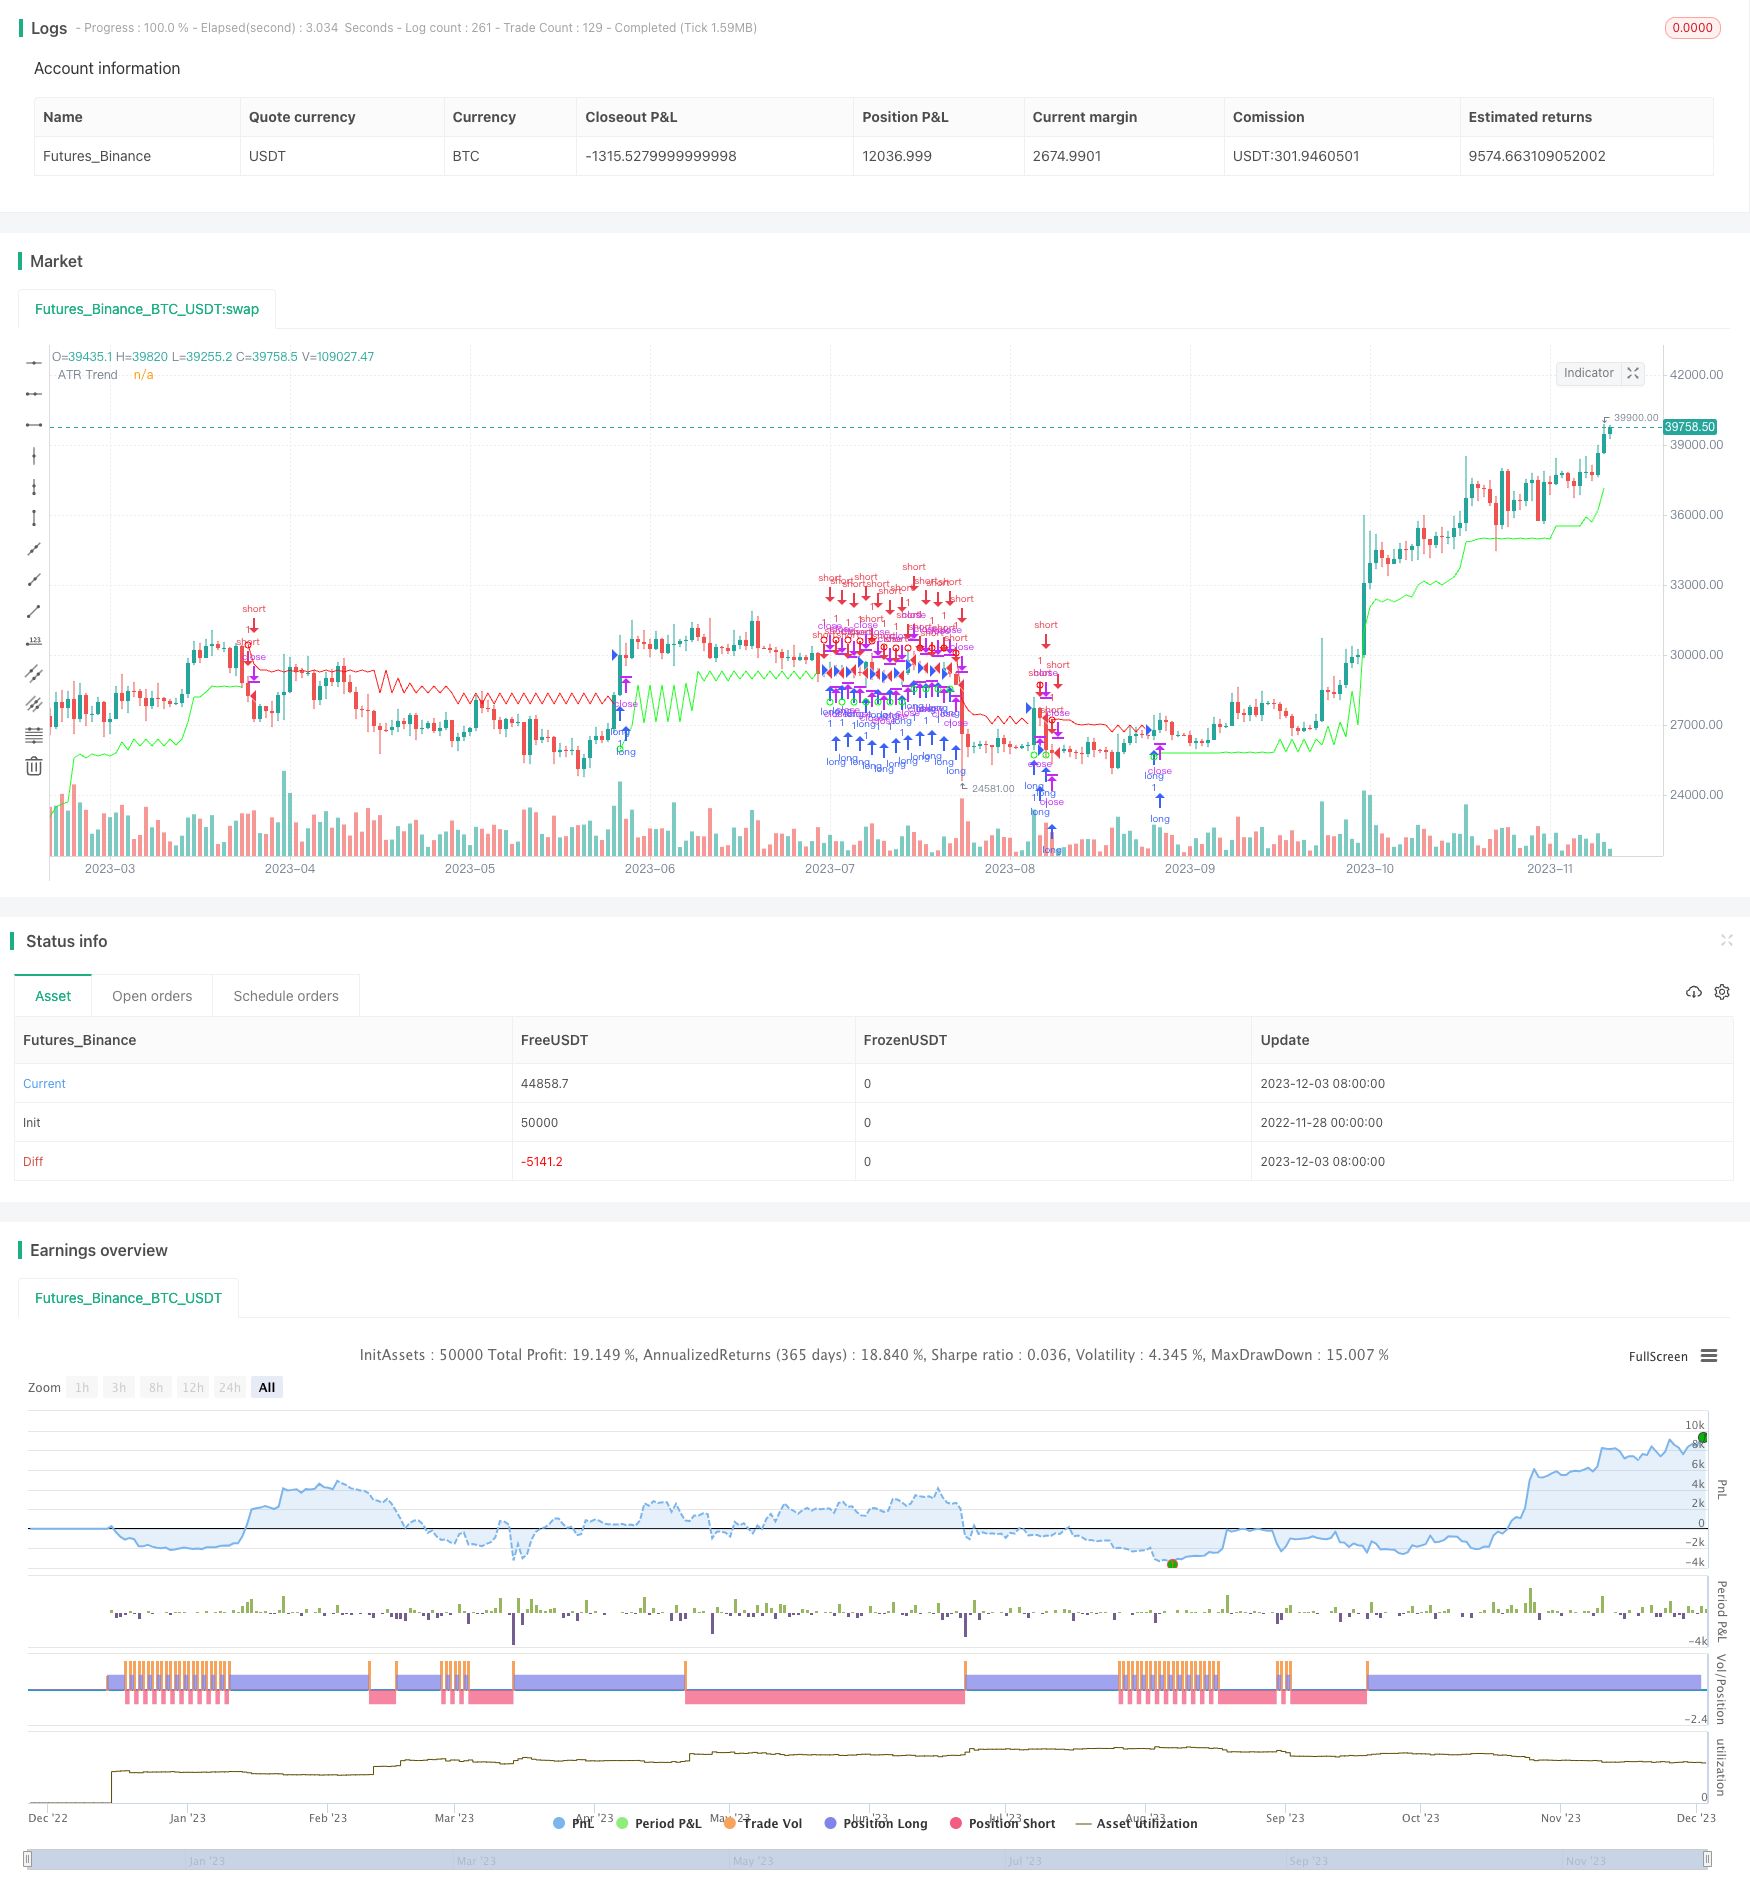 [trans]
概述
该策略是一个结合ATR指标和ADX指标的趋势跟踪策略。它会根据市场的趋势状态,动态调整ATR的倍数,从而实现更好的趋势跟踪。
策略原理
该策略主要基于ATR指标和ADX指标。
首先,计算真实波动范围(ATR)和ADX。ATR反映市场波动程度,ADX判断趋势力度。
然后,根据ADX的多空向指标DX的差值,判断目前走势的多空状态。如果DI+高于DI-,则为多头趋势,如果DI-高于DI+,则为空头趋势。
接着,当ADX上升时,使用一个较大的ATR倍数(m1),当ADX下降时,使用一个较小的ATR倍数(m2),从而实现动态调整。这是该策略的核心所在。
最后,结合ATR和价格的中值,计算上下轨,进而判断趋势方向。当价格突破上轨时看多,当价格突破下轨时看空。
所以,该策略融合ATR指标和ADX指标,通过动态调整ATR参数,能够更好地捕捉趋势进行交易。
优势分析
该策略有几个明显的优势:
- 能够动态调整参数,更好地捕捉趋势
- 结合ATR和ADX两个指标,判断更为全面
- 回撤有望控制在一定范围内
- 实现过程较为简单,容易理解
所以,这是一个非常实用的趋势跟踪策略,回撤控制能力出色,值得推荐。
风险分析
该策略也存在一些风险:
- ADX指标存在滞后,可能错过趋势转折点
- ATR大小选择不当,可能导致获利不足或止损过大
- 突发事件导致快速打破上下轨,造成损失
所以,需要注意的参数优化和风险控制。此外,黑天鹅事件也会对策略造成较大冲击。
优化方向
该策略可以从以下几个方向进行优化:
- 优化ATR和ADX的参数,使其更好地捕捉趋势
- 添加其他指标确认,避免ADX滞后问题
- 构建动态止损机制,控制单笔损失
- 调整仓位管理,不同市场环境下采取不同策略
所以,该策略仍有很大的优化空间,针对问题进行参数和机制调整非常必要。
总结
该自适应ATR-ADX趋势策略V2整体来说非常出色,通过动态调整ATR参数,能够很好地捕捉趋势;同时结合ATR和ADX两个指标判断,容错性较强。但我们也要注意风险控制和策略优化,防止滞后和亏损扩大。总的来说,该策略值得学习和应用。
||
Overview
This is a trend following strategy that combines the ATR indicator and the ADX indicator. It dynamically adjusts the ATR multiplier according to market trend conditions to achieve better trend tracking.
Strategy Logic
The strategy is mainly based on the ATR indicator and the ADX indicator.
Firstly, it calculates the True Range (ATR) and ADX. ATR reflects the volatility of the market while ADX judges the trend strength.
Secondly, it determines the current trend direction according to the difference between DI+ and DI- in the ADX indicator. If DI+ is higher than DI-, it is an uptrend. If DI- is higher than DI+, it is a downtrend.
Then, when ADX is rising, it uses a larger ATR multiplier (m1). When ADX is falling, it uses a smaller ATR multiplier (m2) to achieve dynamic adjustment. This is the core of the strategy.
Finally, combined with ATR and the midpoint of price, it calculates the upper and lower bands to determine the trend direction. When price breaks through the upper band, it goes long. When price breaks through the lower band, it goes short.
So the strategy incorporates ATR and ADX, and by dynamically adjusting ATR parameters, it can better capture trends for trading.
Advantage Analysis
The strategy has several obvious advantages:
- Able to dynamically adjust parameters for better trend capturing
- Combines ATR and ADX for more comprehensive judgment
- Expects controlled drawdowns
- Simple implementation and easy to understand
Therefore, this is a very practical trend following strategy with good drawdown control. Worth recommending.
Risk Analysis
The strategy also has some risks:
- ADX has lagging issues, may miss trend reversal points
- Improper ATR size selection can lead to insufficient profit or oversized stop loss
- Rapid breakout against bands caused by black swan events can lead to losses
So parameter optimization and risk control need attention. Also, black swan events can have greater impact.
Optimization Directions
The strategy can be optimized in the following aspects:
- Optimize parameters of ATR and ADX for better trend capturing
- Add other indicators for confirmation to avoid ADX lagging issues
- Build dynamic stop loss mechanisms to control single trade loss
- Adjust position sizing for different market environments
So there is still much room for optimization by adjusting parameters and mechanisms according to the problems.
Conclusion
In general, this Adaptive ATR-ADX Trend Strategy V2 performs very well. By dynamically adjusting ATR parameters, it captures trends nicely. Also, combining two indicators in ATR and ADX makes it more robust. But we still need to pay attention to risk control and optimization to prevent lagging and oversized losses. Overall, the strategy is well worth learning and applying.
[/trans]
Strategy Arguments
| Argument | Default | Description |
|---|---|---|
| v_input_1_hlc3 | 0 | Source: hlc3 |
| v_input_2 | 21 | ATR |
| v_input_3 | 3.5 | ATR Multiplier - ADX Rising |
| v_input_4 | 1.75 | ATR Multiplier - ADX Falling |
| v_input_5 | 14 | ADX |
| v_input_6 | 30 | ADX Threshold |
| v_input_7 | true | ADX Above Threshold uses ATR Falling Multiplier Even if Rising? |
| v_input_8 | false | Use Heiken-Ashi Bars (Source will be ohlc4) |
Source (PineScript)
/*backtest
start: 2022-11-28 00:00:00
end: 2023-12-04 00:00:00
period: 1d
basePeriod: 1h
exchanges: [{"eid":"Futures_Binance","currency":"BTC_USDT"}]
*/

//@version=2
// From mortdiggiddy's indicator to strategy
// See also: https://www.tradingview.com/u/mortdiggiddy/

strategy(title = "Adaptive ATR-ADX Trend V2", shorttitle = "Adaptive ATR V2 Strategy", overlay = true)

//Mode
src = input(title = "Source",  defval = hlc3)
atrLen = input(title = "ATR",  defval = 21, minval = 1, maxval = 100)
m1 = input(title = "ATR Multiplier - ADX Rising", type = float, defval = 3.5, minval = 1, step = 0.1, maxval = 100)
m2 = input(title = "ATR Multiplier - ADX Falling", type = float, defval = 1.75, minval = 1, step = 0.1, maxval = 100)

adxLen = input(title = "ADX",  defval = 14, minval = 1, maxval = 100)
adxThresh = input(title = "ADX Threshold",  defval = 30, minval = 1)
aboveThresh = input(true, title = "ADX Above Threshold uses ATR Falling Multiplier Even if Rising?")
useHeiken = input(false, title = "Use Heiken-Ashi Bars (Source will be ohlc4)")

// DI-Pos, DI-Neg, ADX

hR = change(high)
lR = -change(low)

dmPos = hR > lR ? max(hR, 0) : 0
dmNeg = lR > hR ? max(lR, 0) : 0

sTR = nz(sTR[1]) - nz(sTR[1]) / adxLen + tr
sDMPos = nz(sDMPos[1]) - nz(sDMPos[1]) / adxLen + dmPos
sDMNeg = nz(sDMNeg[1]) - nz(sDMNeg[1]) / adxLen + dmNeg

DIP = sDMPos / sTR * 100
DIN = sDMNeg / sTR * 100
DX = abs(DIP - DIN) / (DIP + DIN) * 100
adx = sma(DX, adxLen)

// Heiken-Ashi

xClose = ohlc4
xOpen = (nz(xOpen[1]) + nz(close[1])) / 2
xHigh = max(high, max(xOpen, xClose))
xLow = min(low, min(xOpen, xClose))

// Trailing ATR

v1 = abs(xHigh - xClose[1])
v2 = abs(xLow - xClose[1])
v3 = xHigh - xLow

trueRange = max(v1, max(v2, v3))
atr = useHeiken ? rma(trueRange, atrLen) : atr(atrLen)

m = rising(adx, 1) and (adx < adxThresh or not aboveThresh) ? m1 : falling(adx, 1) or (adx > adxThresh and aboveThresh) ? m2 : nz(m[1])
mUp = DIP >= DIN ? m : m2
mDn = DIN >= DIP ? m : m2

src_ = useHeiken ? xClose : src
c = useHeiken ? xClose : close
t = useHeiken ? (xHigh + xLow) / 2 : hl2

up = t - mUp * atr
dn = t + mDn * atr

TUp = max(src_[1], c[1]) > TUp[1] ? max(up, TUp[1]) : up
TDown = min(src_[1], c[1]) < TDown[1] ? min(dn, TDown[1]) : dn

trend = min(src_, min(c, close)) > TDown[1] ? 1 : max(src_, max(c, close)) < TUp[1]? -1 : nz(trend[1], 1)
stop = trend == 1 ? TUp : TDown
trendChange = change(trend)

longCondition = (trendChange > 0)
if (longCondition)
    strategy.entry("long", strategy.long)
shortCondition = (trendChange < 0)
if (shortCondition)
    strategy.entry("short", strategy.short)

// Plot

lineColor = not(trendChange) ? trend > 0 ? #00FF00DD : #FF0000DD : #00000000
shapeColor = trendChange ? trendChange > 0 ? #00FF00F8 : #FF0000F8 : #00000000

plot(stop, color = lineColor, style = line, linewidth = 1, title = "ATR Trend")
plotshape(trendChange ? stop : na, style = shape.circle, size = size.tiny, location = location.absolute, color = shapeColor, title = "Change")

alertcondition(trendChange > 0, title = "ATR-ADX Change Up", message = "ATR-ADX Change Up")
alertcondition(trendChange < 0, title = "ATR-ADX Change Down", message = "ATR-ADX Change Down")

// end
Detail
https://www.fmz.com/strategy/434345
Last Modified
2023-12-05 18:08:14