
7.3 KiB
Name
自动支撑-阻力策略Auto-S-R-Breakout-Strategy
Author
ChaoZhang
Strategy Description
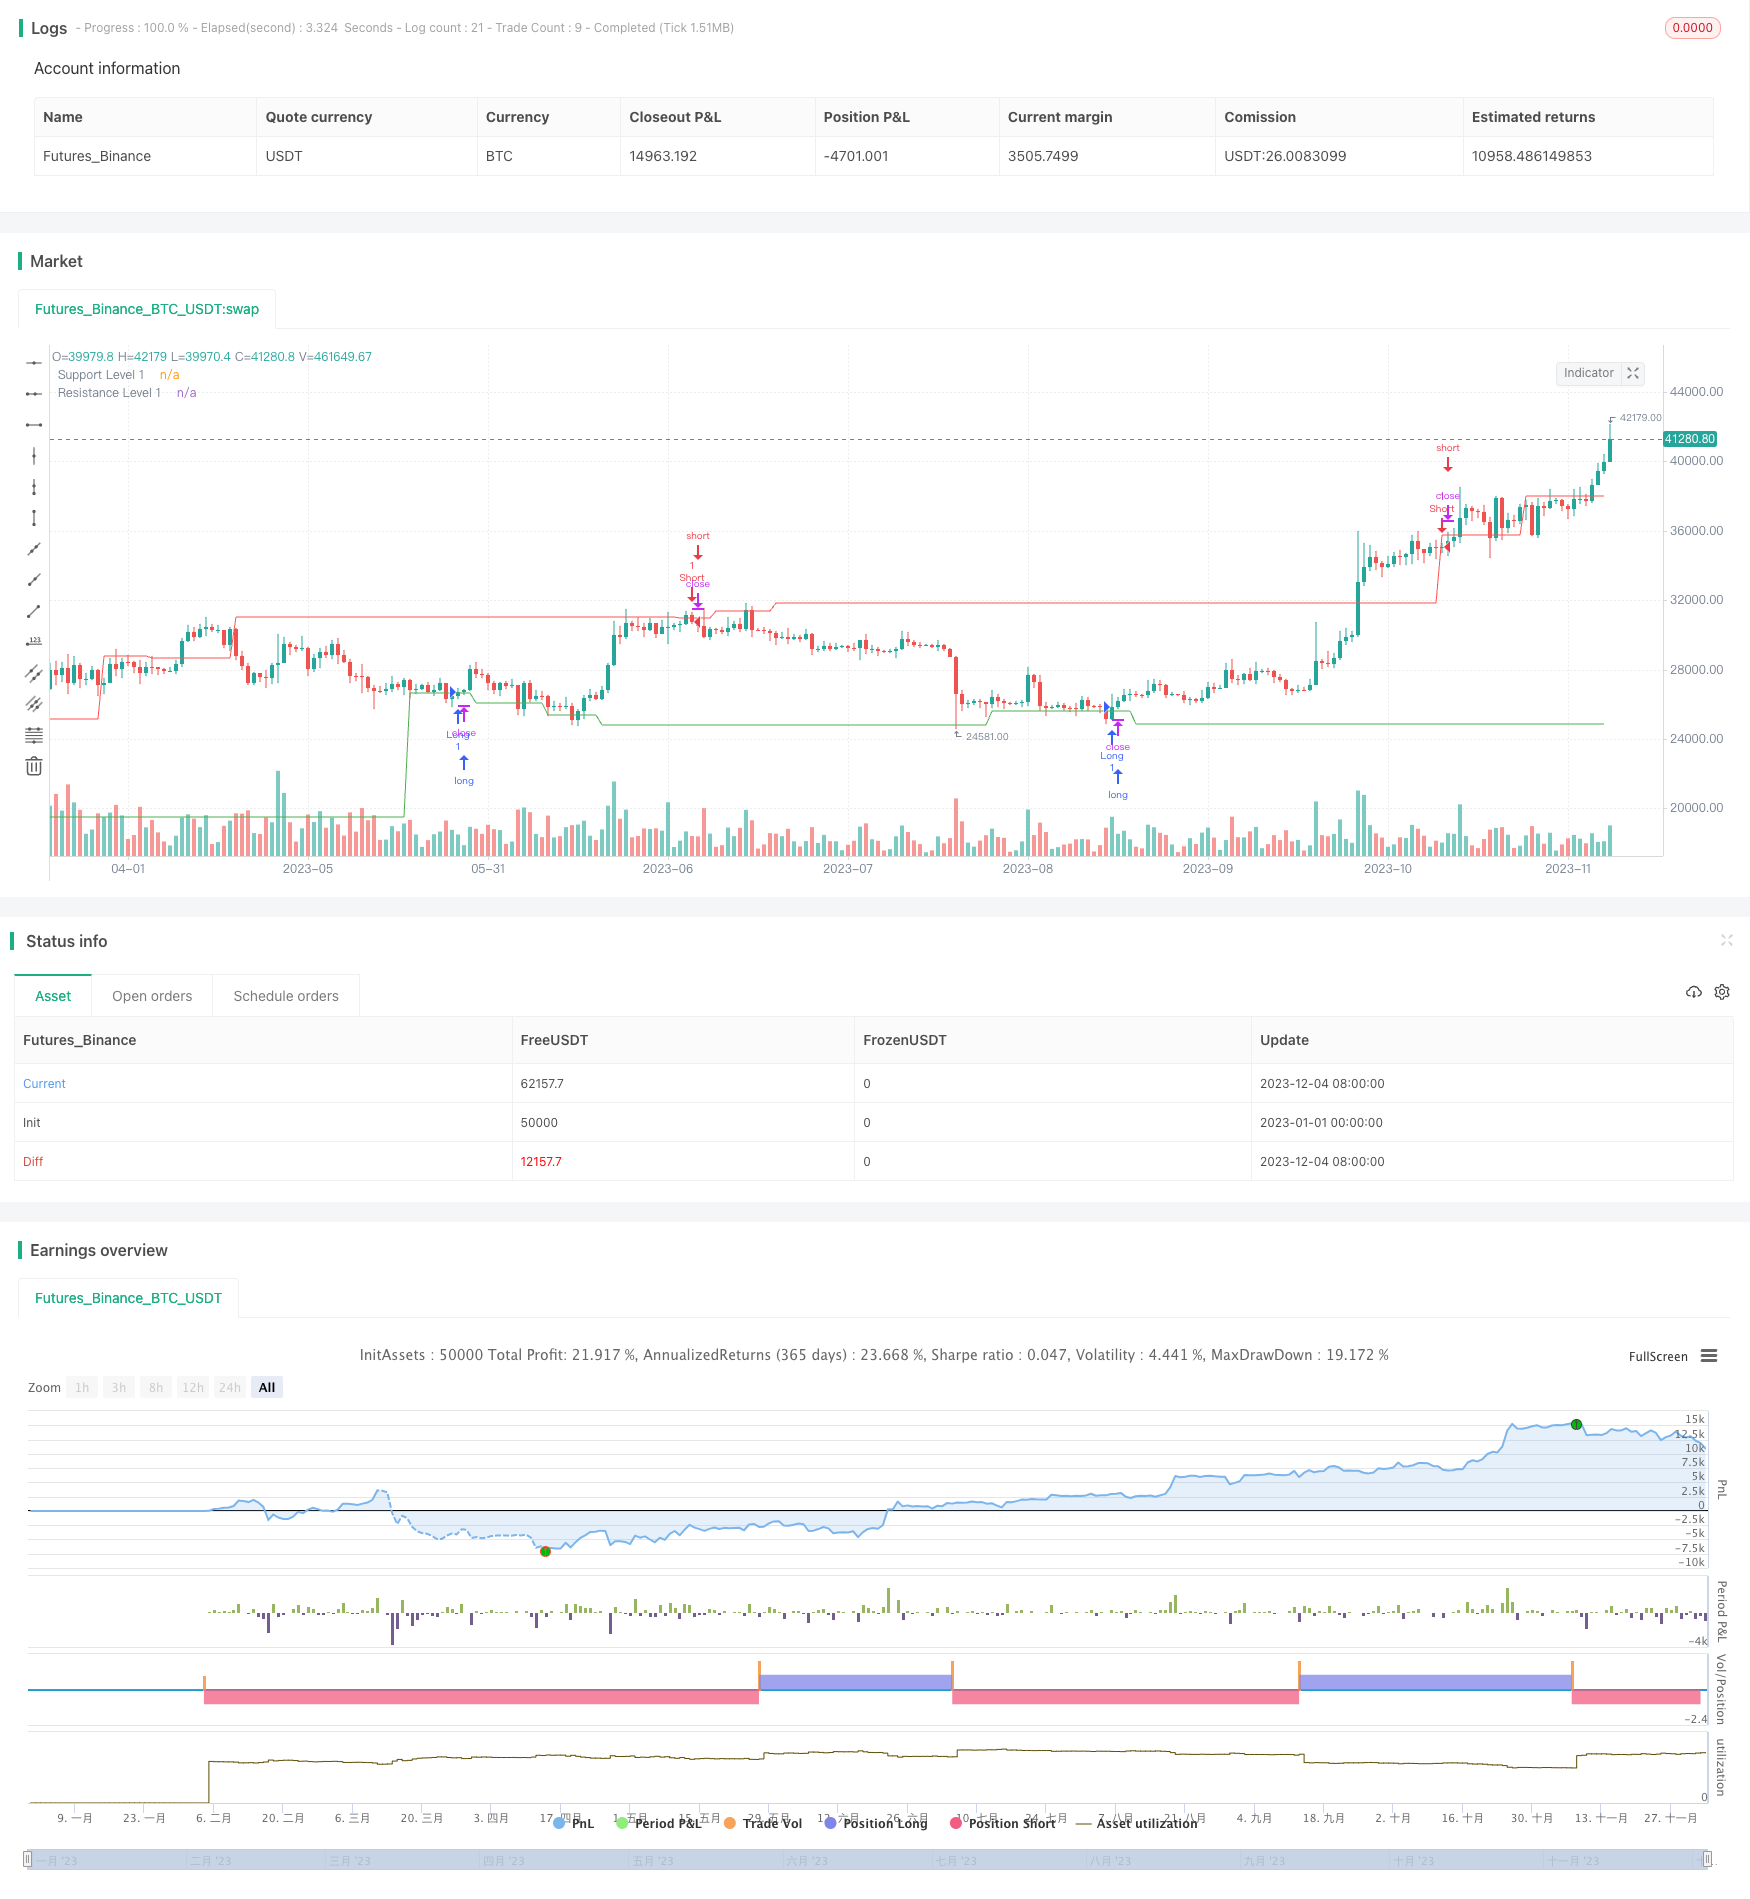
[trans]
概述
自动支撑/阻力策略是一种趋势跟踪策略。它通过计算一定周期内的最高价和最低价,来确定关键的支撑和阻力位。当价格突破这些关键位时,进行买入或者卖出操作。
策略原理
该策略首先计算左侧和右侧某个周期数内的最高价和最低价,确定主要的支撑和阻力位。然后再在更短周期内计算最高价和最低价,确定快速的支撑和阻力位。当价格突破快速支撑位时,进行买入操作;当价格突破快速阻力位时,进行卖出操作。
策略的关键逻辑是,左右两侧价格形成支撑或阻力后,如果价格突破这些位,那么很可能开始新的趋势,这时进行操作可以捕捉趋势的方向。该策略同时结合不同周期判断趋势,从而避免被短期动量影响判断。
优势分析
该策略最大的优势在于,可以自动确定关键的支撑和阻力位。不需要人工判断支撑和阻力的位置。同时结合不同周期判断趋势,可以有效过滤假突破的情况,避免交易被套。
另外,策略买入条件和卖出条件都简单清晰,只需要价格突破快速支撑或阻力位即可。容易实施,也容易回测优化参数。
风险分析
该策略最大的风险在于,自动计算的支撑和阻力位不一定可靠,价格可能直接突破这些位形成新的趋势。这时会造成损失。
另外,如果快速支撑和阻力位设置的周期太短,可能导致产生过多假突破信号。从而增大实际交易的亏损。
为降低风险,可以考虑结合其他指标进行过滤,例如成交量、移动平均线等指标的方向判断。或者人工检查自动计算的支撑和阻力位的合理性。
优化方向
该策略主要可以从两方面进行优化:
-
优化键入的周期参数,寻找最佳参数组合。可以尝试不同左右周期的组合,找到突破成功率最高的参数。
-
增加指标过滤条件,例如量能指标、移动平均线等,避免假突破。也可以结合人工判断关键位的方式,提升策略效果。
总结
本策略整体是一个较好的自动判断支撑和阻力位的策略框架。由于自动判断支撑阻力位,实施难度不高,适合用于捕捉趋势的方向。同时结合参数优化和条件过滤,可以进一步提升策略收益。
||
Overview
The Auto S/R strategy is a trend following strategy. It calculates the highest and lowest prices over certain periods to determine key support and resistance levels. When the price breaks through these key levels, buy or sell orders are executed.
Strategy Logic
The strategy first computes the highest high and lowest low prices over a number of bars on left and right sides to identify major support and resistance levels. Then it calculates highest high and lowest low prices over a smaller number of bars to determine near-term support and resistance levels. When the price breaks above the near-term support level, a buy order is triggered. When the price breaks below the near-term resistance level, a sell order is triggered.
The key logic behind the strategy is that if the price breaks supporter or resistance levels formed on both sides over certain periods, it likely signals the start of a new trend. Entering positions in the direction of the breakout allows capturing the emerging trend. The strategy combines different timeframes to confirm the trend, avoiding being misled by short-term price swings.
Advantage Analysis
The biggest advantage of this strategy is it can automatically identify key support and resistance levels, eliminating the need for manual price level identification. By combining different timeframes, it can effectively filter out false breakouts, avoiding being trapped in losing positions.
In addition, the entry and exit rules are simple and straight-forward - just requiring a break of the near-term S/R levels. This makes the strategy easy to implement and optimize by tuning parameters.
Risk Analysis
The biggest risk is that automatically calculated S/R levels may not be reliable, and the price could break through without beginning a trend. This could cause losses.
Also, if the period for near-term S/R is too short, it may generate excessive false signals, leading to high losses in live trading.
To reduce risks, consider adding filter conditions using other indicators like volume and moving averages to confirm trend directionality before entries. Traders could also manually inspect and confirm the reasonableness of automatically calculated S/R levels.
Optimization Directions
There are two main aspects this strategy can be optimized:
-
Optimize the input parameters to find the optimal period combinations for highest breakout success rate. Different left and right period mixes could be tested.
-
Add additional filters like volume/momentum indicators and moving averages to avoid false breakouts. Combining with manual inspection of S/R levels could also improve performance.
Summary
Overall this is a solid framework for automatically identifying support and resistance levels. Implementation is straightforward thanks to automated S/R detection, making it suitable for trend following strategies. Further optimizations on parameters and filters can enhance profitability.
[/trans]
Strategy Arguments
| Argument | Default | Description |
|---|---|---|
| v_input_int_1 | 50 | Left Bars |
| v_input_int_2 | 25 | Right Bars |
| v_input_int_3 | 5 | Quick Right Bars |
| v_input_1_close | 0 | Source: close |
Source (PineScript)
/*backtest
start: 2023-01-01 00:00:00
end: 2023-12-05 00:00:00
period: 1d
basePeriod: 1h
exchanges: [{"eid":"Futures_Binance","currency":"BTC_USDT"}]
*/

// This source code is subject to the terms of the Mozilla Public License 2.0 at https://mozilla.org/MPL/2.0/
// © lukaRT

//@version=5
strategy("Auto S/R Strategy", shorttitle="Auto S/R", overlay=true)

// Ваши входные параметры
leftBars = input.int(50, title="Left Bars")
rightBars = input.int(25, title="Right Bars")
quickRightBars = input.int(5, title="Quick Right Bars")
src = input(close, title="Source")

pivotHigh = ta.pivothigh(src, leftBars, rightBars)
pivotLow = ta.pivotlow(src, leftBars, rightBars)

quickPivotHigh = ta.pivothigh(src, leftBars, quickRightBars)
quickPivotLow = ta.pivotlow(src, leftBars, quickRightBars)

// Ваши уровни сопротивления и поддержки
resistanceLevel1 = ta.valuewhen(quickPivotHigh, high[quickRightBars], 0)
supportLevel1 = ta.valuewhen(quickPivotLow, low[quickRightBars], 0)

// Пересечение ценой уровней
longCondition = ta.crossover(close, supportLevel1)
shortCondition = ta.crossunder(close, resistanceLevel1)

strategy.entry("Long", strategy.long, when=longCondition)
strategy.entry("Short", strategy.short, when=shortCondition)

// Отображение линий сопротивления и поддержки на графике
plot(resistanceLevel1, color=color.red, title="Resistance Level 1")
plot(supportLevel1, color=color.green, title="Support Level 1")
Detail
https://www.fmz.com/strategy/434470
Last Modified
2023-12-06 16:51:30