
7.5 KiB
Name
突破新低回归均线策略Mean-Reversion-Breakout-Low-Strategy
Author
ChaoZhang
Strategy Description
 [trans]
概述
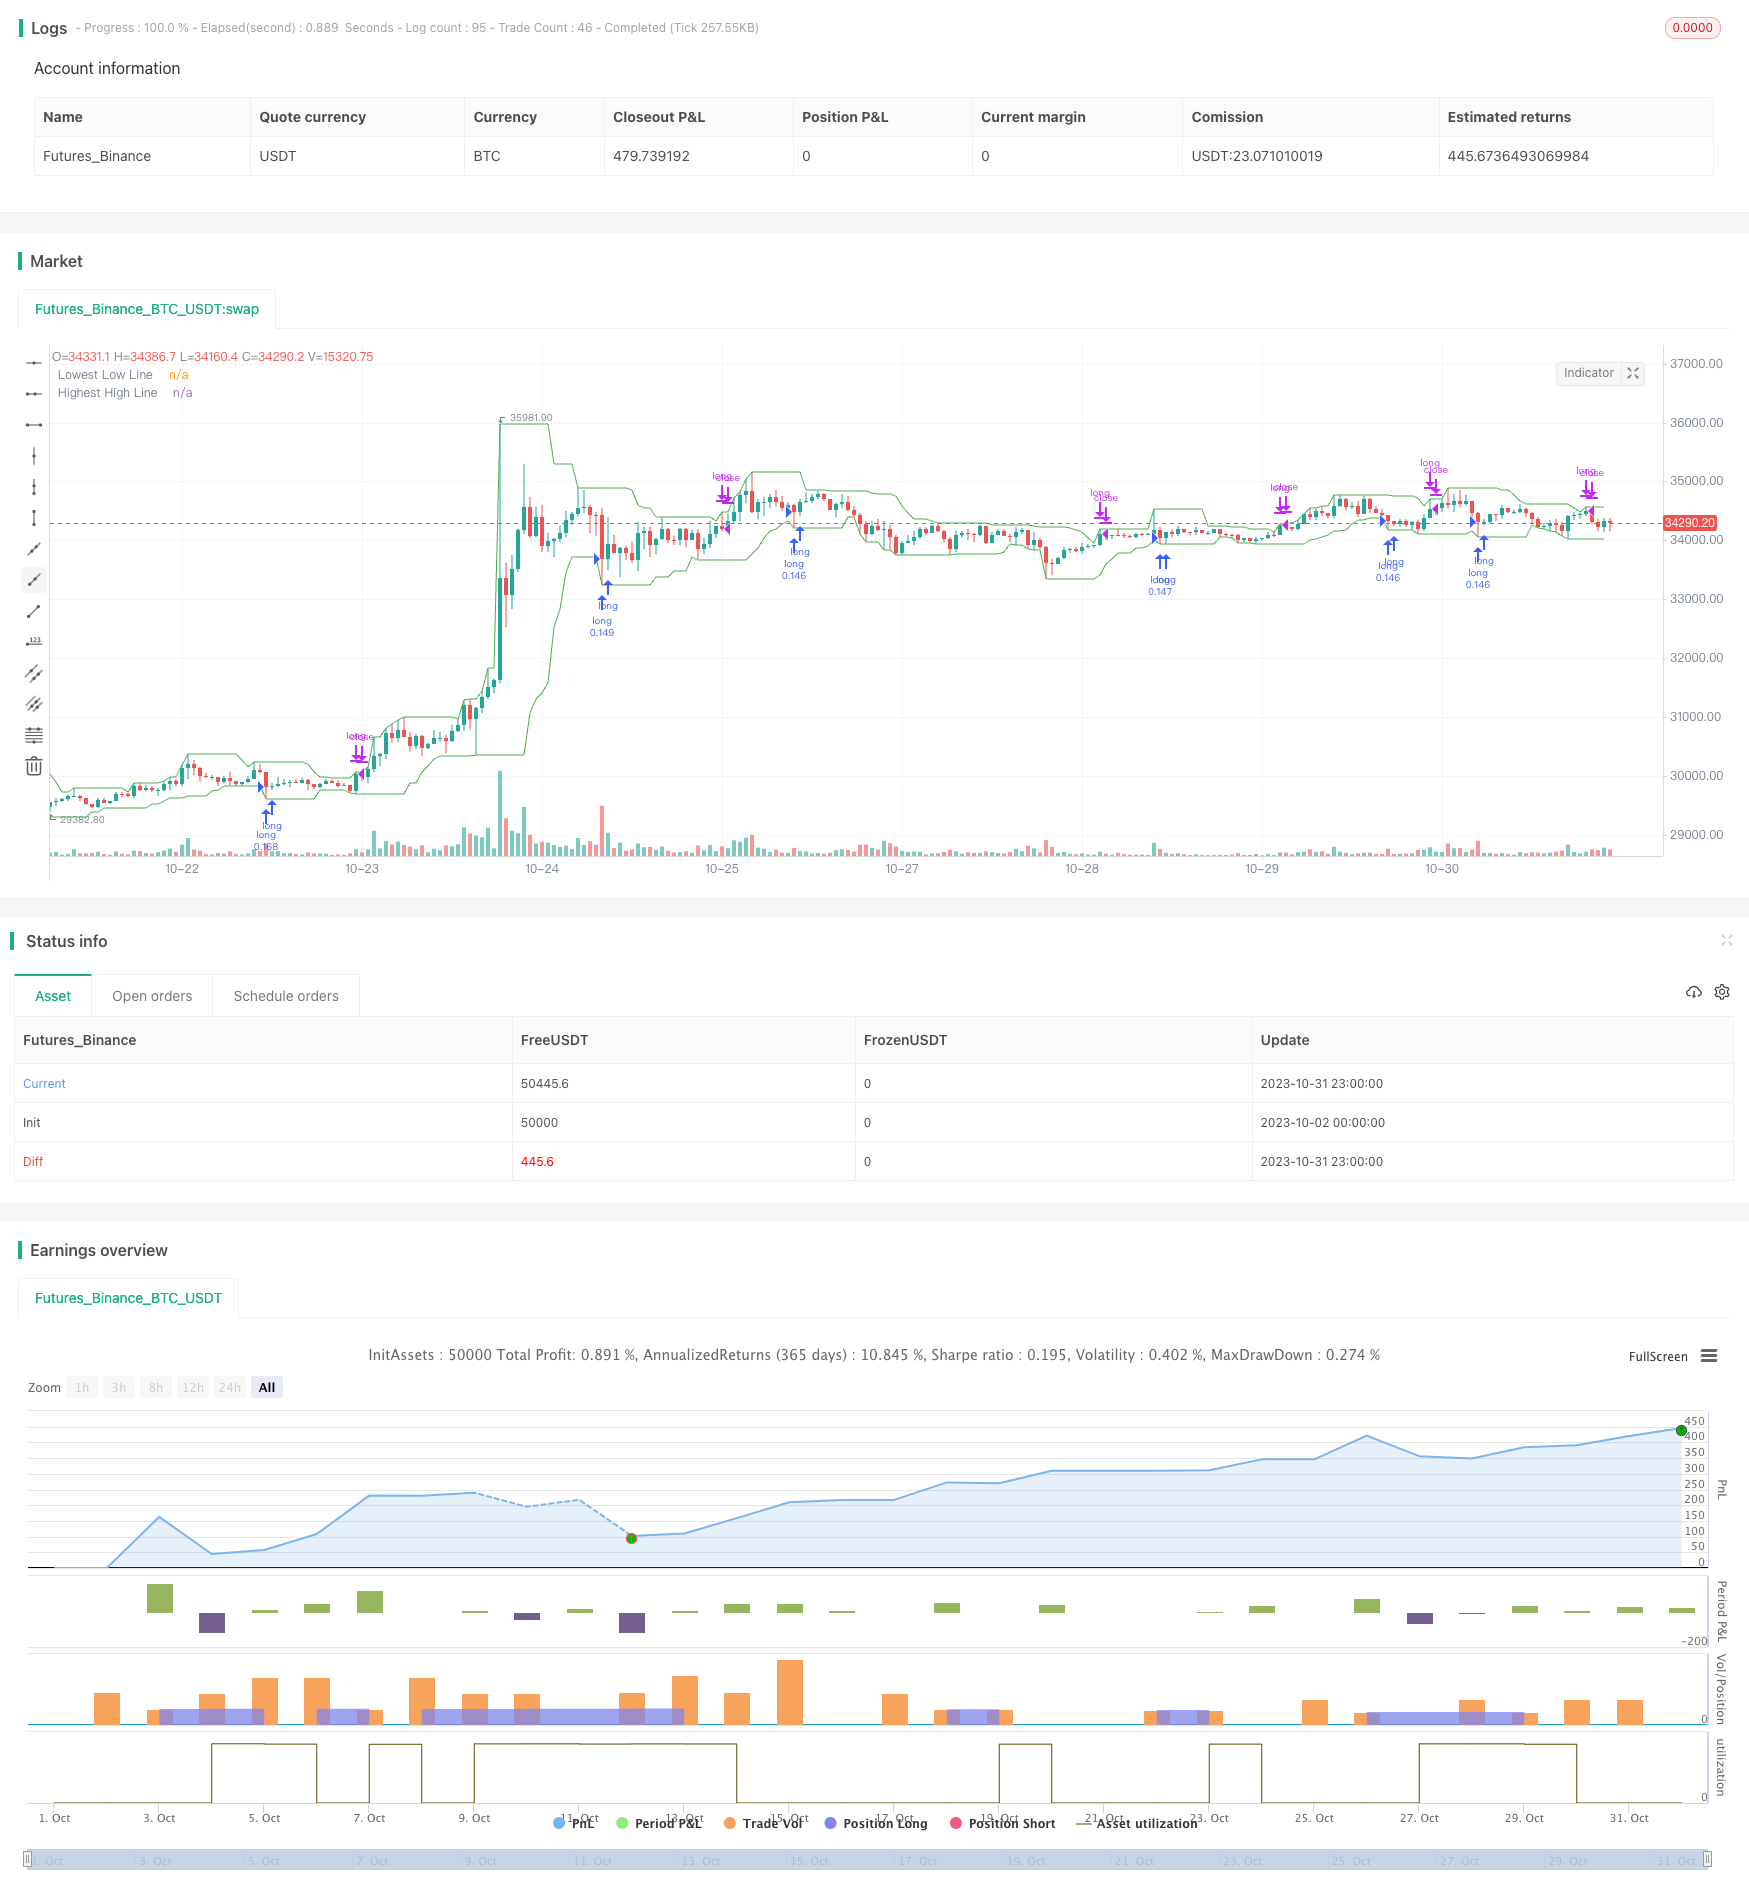
这个策略的主要思想是检测价格是否突破指定周期内的最低价,如果突破就做多,等待价格回归均线。它属于趋势跟踪类策略。
策略原理
该策略通过调用Pine脚本的ta.lowest方法获取指定周期内的最低价lowestLow,并与上一周期的最低价prevLow进行比较。
如果最新周期的最低价lowestLow低于上一周期的最低价prevLow,则发出做多信号。做多之后,通过与指定周期内的最高价highestHigh进行比较,如果最新周期的最高价大于此前周期的最高价,则平仓。
该策略允许选择触发条件,即最低价需要连续突破1个、2个、3个或4个之前的最低价,从而控制交易频率。
此外,该策略还在图表上绘制了最低价均线lowestLow和最高价均线highestHigh,以直观显示趋势的变化。
优势分析
-
该策略捕捉突破新低后的反转趋势,具有较高的胜率。
-
允许选择突破最低价的数量,可以控制交易频率。
-
绘制均线有助于直观判断趋势变化点。
-
策略逻辑简单清晰,容易理解实现。
-
可配置不同股票及时间周期进行优化测试。
风险分析
-
突破假突破无法确定趋势反转点,可能引发亏损。
-
需要测试不同参数组合优化配置,否则交易频率可能过高或过低。
-
针对不同股票需要调整参数,不宜机械应用。
-
回测时间周期不足可能导致策略过拟合。
-
突破后价格可能再创新低,需要设置止损来控制风险。
优化方向
-
增加止损机制,如移动止损、跟踪止损等,控制单笔损失。
-
优化突破的数量,平衡交易频率与信号质量。
-
测试不同股票和时间周期的参数优化。
-
增加过滤条件,避免在震荡市中频繁交易。
-
考虑加入趋势指标,避免逆势交易。
-
测试不同出场 Exit 信号。
总结
该策略通过监测最低价突破来捕捉反转机会,属于典型的突破回归策略。优点是简单易懂,交易频率可控,可在多种股票中应用。但也存在一定的假突破风险,需要加入辅助条件进行过滤优化,同时控制风险非常必要。通过全面测试与优化,该策略可以成为稳定可靠的量化交易系统。
||
Overview
The main idea of this strategy is to detect if the price breaks through the lowest price in a specified period and go long, waiting for the price to revert to the mean. It belongs to trend following strategies.
Strategy Logic
The strategy gets the lowest price in a specified period lowestLow using Pine Script's ta.lowest method and compares it with the lowest price of the previous period prevLow.
If the latest period's lowest price lowestLow is lower than the previous period's lowest price prevLow, a long signal is triggered. After going long, it compares with the highest price in the specified period highestHigh. If the latest period's highest price is greater than the previous highest price, it closes the position.
The strategy allows choosing the trigger condition, i.e. the lowest price needs to break through 1, 2, 3 or 4 previous lowest prices consecutively, to control the trading frequency.
It also plots the lowest price line lowestLow and highest price line highestHigh on the chart to visually display the trend change.
Advantage Analysis
-
The strategy catches the reversal trend after breaking new lows with relatively high win rate.
-
Allows choosing the number of broken lowest prices to control trading frequency.
-
Drawing the lines helps visually determine trend change points.
-
Simple and clear strategy logic, easy to understand and implement.
-
Can be configured and optimized on different stocks and time periods.
Risk Analysis
-
Breaking false bottom cannot determine trend reversal points, may lead to losses.
-
Needs to test different parameter combinations to optimize configurations, otherwise trading frequency may be too high or too low.
-
Parameters need to be adjusted for different stocks, should not mechanically apply.
-
Insufficient backtest period may cause overfitting.
-
Price may make new lows after breaking out, need to set stop loss to control risks.
Optimization Directions
-
Add stop loss mechanisms like moving stop loss, trailing stop loss, to limit per trade loss.
-
Optimize the number of breakouts to balance trading frequency and signal quality.
-
Test parameters on different stocks and time periods.
-
Add filters to avoid frequent trading in ranging markets.
-
Consider adding trend indicators to avoid counter trend trading.
-
Test different exit signals.
Conclusion
The strategy catches reversal opportunities by monitoring lowest price breakouts, a typical mean reversion breakout strategy. The advantages are simplicity, controllable frequency, and applicability to various stocks. But it also has some false breakout risks. Adding filters and optimizing is necessary, as well as controlling risks. With comprehensive testing and optimization, it can become a stable and reliable trading system.
[/trans]
Strategy Arguments
| Argument | Default | Description |
|---|---|---|
| v_input_1 | 9 | Minimum number of bars |
| v_input_string_1 | 0 | Number of broken lows: One |
Source (PineScript)
/*backtest
start: 2023-10-02 00:00:00
end: 2023-11-01 00:00:00
period: 1h
basePeriod: 15m
exchanges: [{"eid":"Futures_Binance","currency":"BTC_USDT"}]
*/

// This source code is subject to the terms of the Mozilla Public License 2.0 at https://mozilla.org/MPL/2.0/
// © merovinh

//@version=5
strategy(title="Merovinh - Mean Reversion Lowest low",
     overlay = true,
     default_qty_type = strategy.percent_of_equity,
     initial_capital = 10000,
     default_qty_value = 10,
     commission_type = strategy.commission.percent,
     slippage = 1,
     commission_value = 0.04)

GR_TIME = 'Time Period'

bars = input(9, title = "Minimum number of bars", tooltip = "The minimum number of bars before updating lowest low / highest high")

numberOfLows  = input.string(defval='One', title='Number of broken lows', options=['One', 'Two', 'Three', 'Four'])

//Period

var prevLow = .0
var prevHigh = .0
var prevLow2 = .0
var prevLow3 = .0
var prevLow4 = .0

truetime = true


highestHigh = ta.highest(high, bars)
lowestLow = ta.lowest(low, bars)

if numberOfLows == 'One'
    if truetime and prevLow > 0 and lowestLow < prevLow
        strategy.entry('long', strategy.long)
if numberOfLows == 'Two'
    if truetime and prevLow > 0 and lowestLow < prevLow and prevLow < prevLow2
        strategy.entry('long', strategy.long)
if numberOfLows == 'Three'
    if truetime and prevLow > 0 and lowestLow < prevLow and prevLow < prevLow2 and prevLow2 < prevLow3
        strategy.entry('long', strategy.long)
if numberOfLows == 'Four'
    if truetime and prevLow > 0 and lowestLow < prevLow and prevLow < prevLow2 and prevLow2 < prevLow3 and prevLow3 < prevLow4
        strategy.entry('long', strategy.long)

if truetime and prevHigh > 0 and highestHigh > prevHigh
    strategy.close('long')


if prevLow != lowestLow
    prevLow4 := prevLow3
    prevLow3 := prevLow2
    prevLow2 := prevLow
    prevLow := lowestLow
prevHigh := highestHigh

plot(lowestLow, color=color.green, linewidth=1, title="Lowest Low Line")
plot(highestHigh, color=color.green, linewidth=1, title="Highest High Line")
Detail
https://www.fmz.com/strategy/430867
Last Modified
2023-11-02 15:34:22