
9.6 KiB
Name
移动平均线金叉交易策略Moving-Average-Crossover-Trading-Strategy
Author
ChaoZhang
Strategy Description
 [trans]
概述
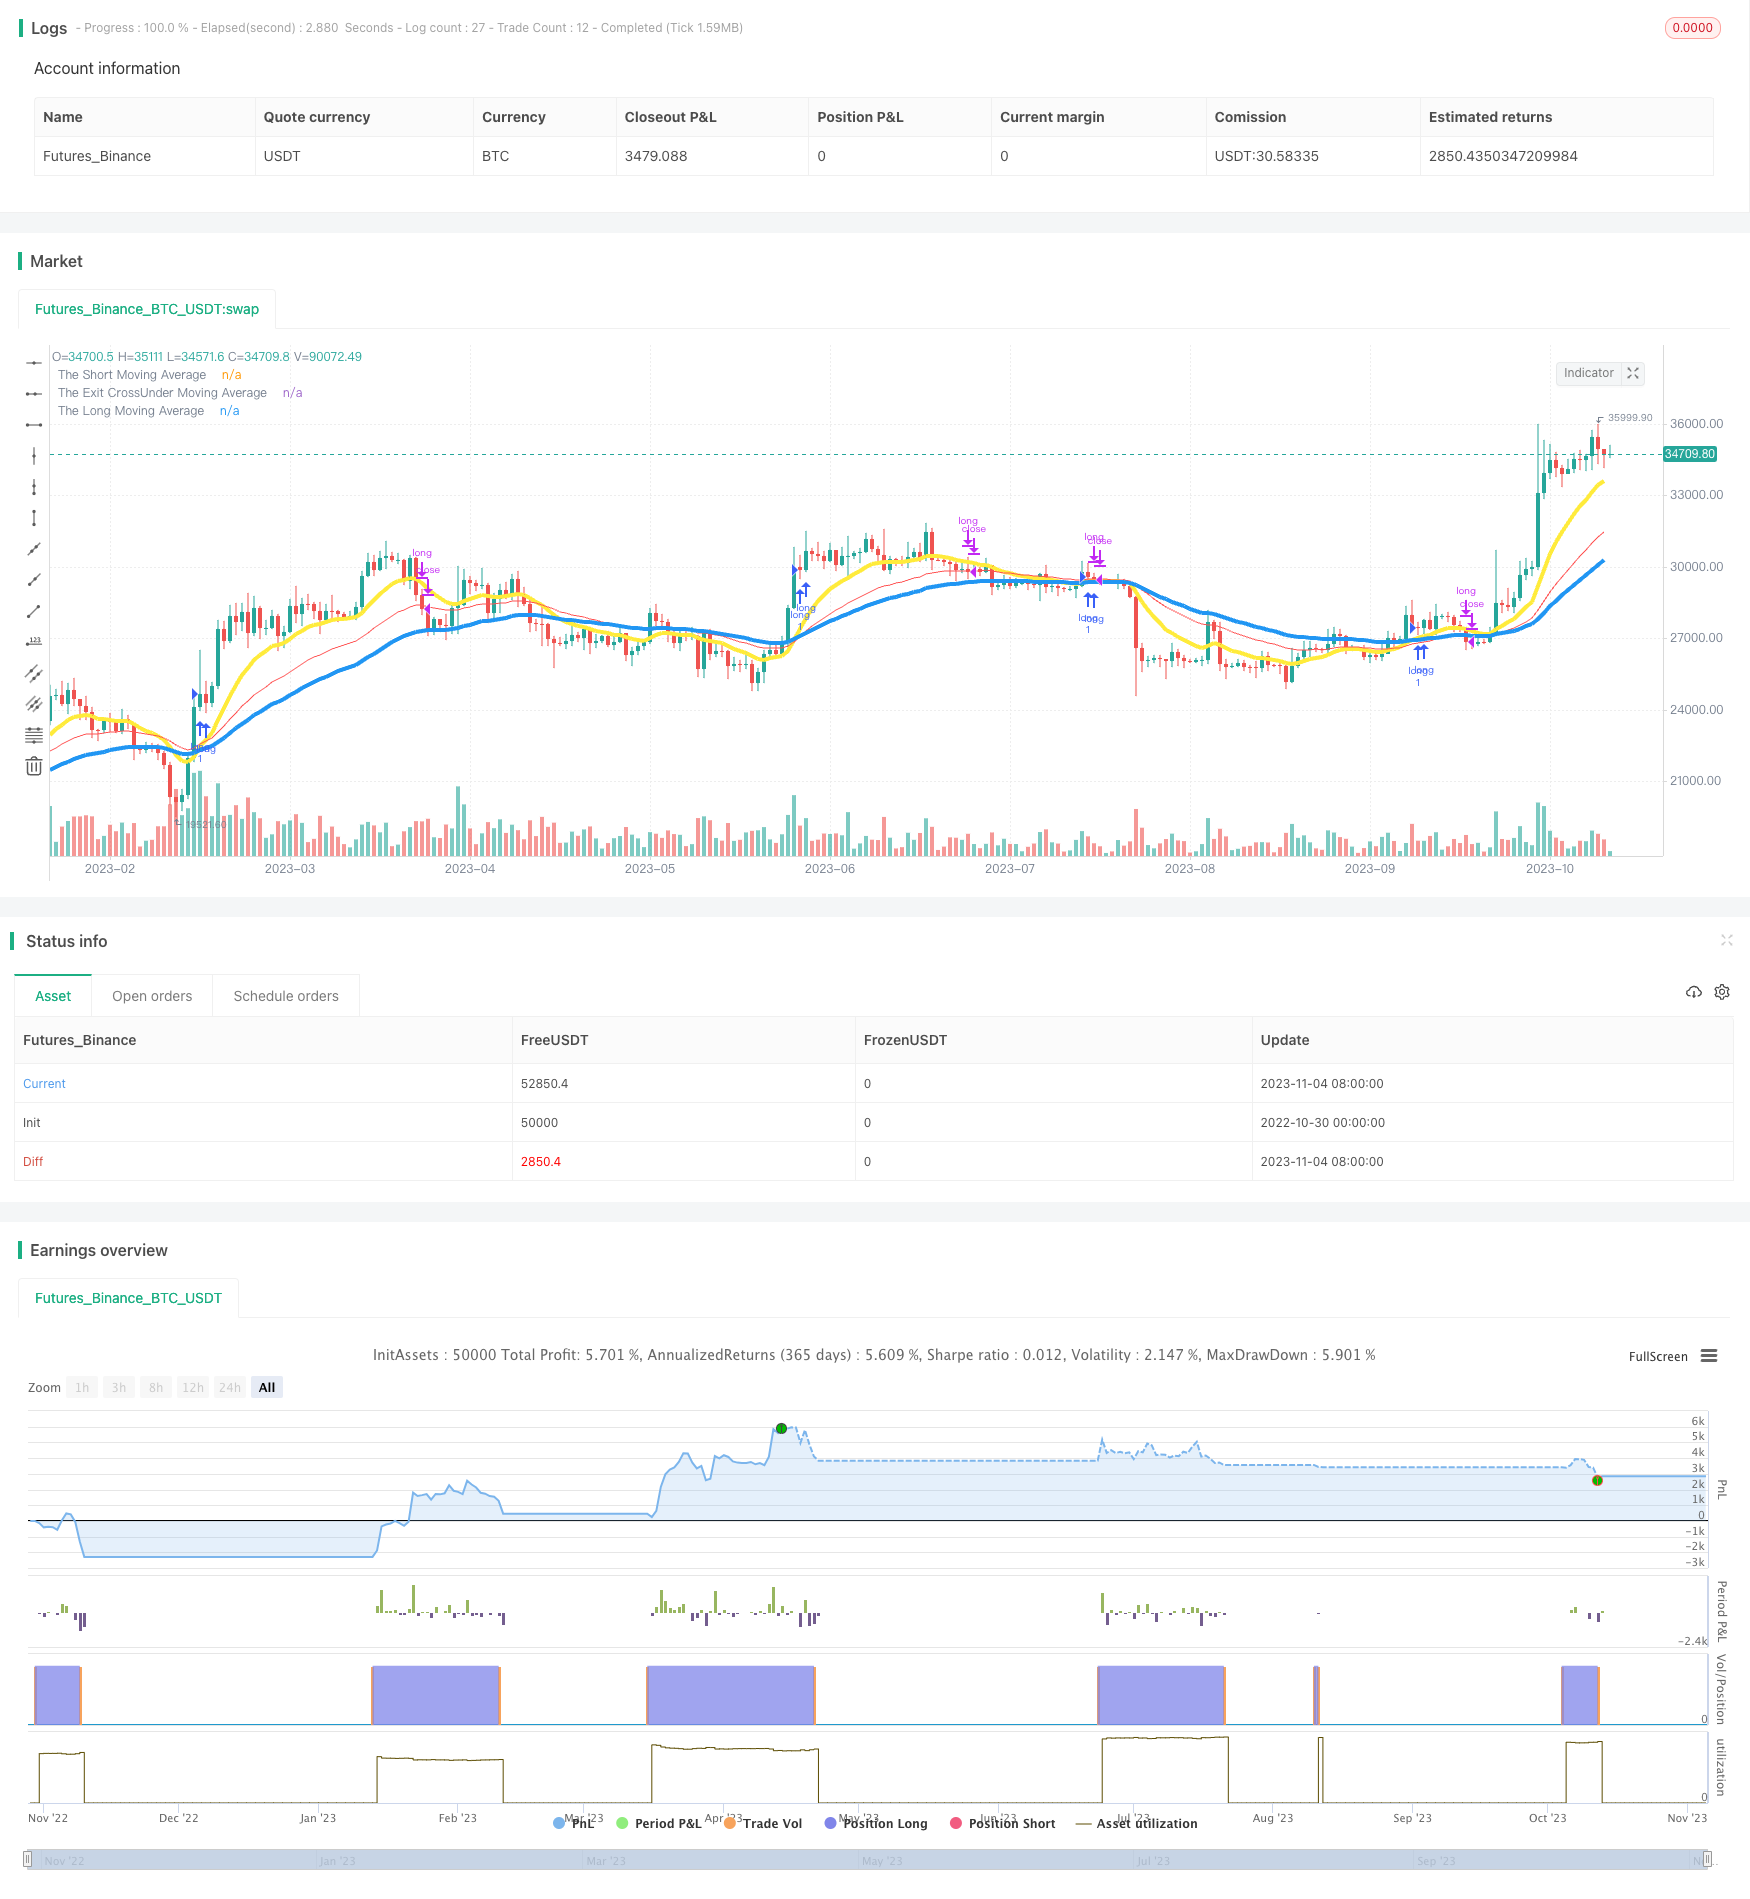
该策略基于移动平均线的金叉原理来进行交易。策略运用两个移动平均线,当短期移动平均线从下方向上突破长期移动平均线时产生买入信号。当价格跌破另一个移动平均线时产生卖出信号。该策略适用于趋势性市场,能够有效过滤掉部分噪音交易,抓住主要趋势进行交易。
策略原理
该策略使用用户自定义的短期移动平均线周期、长期移动平均线周期、退出移动平均线周期以及各移动平均线的计算方式。
当短期移动平均线从下方向上突破长期移动平均线时,产生买入信号。这表示短期趋势转换为上升趋势,可以买入。
当收盘价跌破退出移动平均线时,产生卖出信号。这表示趋势反转,应该退出头寸。
所以该策略的交易信号来源于短期移动平均线和长期移动平均线的交叉以及收盘价与退出移动平均线的关系。
优势分析
该策略具有以下优势:
-
简单易懂,容易实现。
-
可自定义参数,适应不同市场情况。
-
使用移动平均线过滤噪音,抓住主要趋势。
-
可结合趋势、支持阻力等技术指标进一步优化。
-
损益比例可控,具有止损机制。
风险分析
该策略也存在以下风险:
-
趋势性不强的盘整市场中容易产生虚假信号。
-
参数设置不当可能错过趋势或者产生过多无效交易。
-
止损位置设置不合理可能扩大损失。
-
突破失败可能产生损失。
-
需适时调整参数以适应市场变化。
对应风险的解决方法包括:优化参数设置、结合其他指标过滤信号、调整止损位置、确定趋势后再参与等。
优化方向
该策略可以从以下方面进行优化:
-
开发趋势判断机制,确定趋势后再产生交易信号。
-
结合交易量或者波动指标来过滤信号。
-
动态优化移动平均线周期参数。
-
优化止损机制,实现移动止损。
-
结合支持阻力以及其它指标进一步确认交易信号。
-
根据不同品种、周期调整参数。
总结
该移动平均线金叉交易策略整体来说是一种简单实用的趋势跟踪策略。它可根据市场情况调整参数,在趋势行情中抓住主要趋势方向。但也要注意防范趋势判断失误等风险,需不断优化以适应市场变化。总体而言,该策略具有良好的实用性。
||
Overview
This strategy is based on the crossover principle of moving averages to trade. It uses two moving averages, generating buy signals when the short term moving average crosses above the long term moving average from below. Sell signals are generated when the price breaks below another moving average. This strategy is suitable for trending markets, able to effectively filter out some noise trades and capture the main trend.
Strategy Logic
This strategy uses user-customizable short term and long term moving average periods, exit moving average period, and moving average calculation methods.
When the short term moving average crosses above the long term moving average from below, a buy signal is generated. This indicates the short term trend has switched to an uptrend, and we can buy.
When the close price breaks below the exit moving average, a sell signal is generated. This indicates a trend reversal, so we should exit the position.
Therefore, the strategy's trading signals come from the crossover of the short term and long term moving averages, and the relationship between the closing price and the exit moving average.
Advantage Analysis
The advantages of this strategy are:
-
Simple and easy to implement.
-
Customizable parameters suit different market conditions.
-
Moving averages filter out noise and capture the main trend.
-
Can incorporate other technical indicators like trend, support/resistance to further optimize.
-
Controllable risk-reward ratio, has stop loss mechanism.
Risk Analysis
The risks are:
-
Prone to false signals in non-trending consolidation markets.
-
Improper parameter settings may cause missing trends or too many invalid trades.
-
Improper stop loss placement could increase losses.
-
Failed breakouts may cause losses.
-
Parameters need timely adjustment to suit market changes.
Solutions include optimizing parameters, incorporating other filters, adjusting stops, waiting for trend confirmation before trading, etc.
Optimization Directions
This strategy can be improved by:
-
Developing trend determination mechanisms and only trading after trend confirmation.
-
Adding filters like volume or volatility to filter signals.
-
Dynamic optimization of moving average periods.
-
Optimizing the stop loss mechanism to use a trailing stop.
-
Incorporating support/resistance and other indicators to further confirm signals.
-
Adjusting parameters based on different products and timeframes.
Conclusion
Overall this moving average crossover strategy is a simple and practical trend following system. It can be adjusted to market conditions by tweaking parameters and catch the main trend direction in trending markets. But risks like trend misidentification should be noted, and constant optimization is needed to adapt to changing markets. In general, this strategy has good viability.
[/trans]
Strategy Arguments
| Argument | Default | Description |
|---|---|---|
| v_input_1 | true | From Day |
| v_input_2 | true | From Month |
| v_input_3 | 2020 | From Year |
| v_input_4 | true | To Day |
| v_input_5 | true | To Month |
| v_input_6 | 2021 | To Year |
| v_input_7 | 13 | Enter Period for Short Moving Average |
| v_input_8 | 0 | Choose Smoothing Type for Short Moving Average: EMA |
| v_input_9 | 48 | Enter Period for Long Moving Average |
| v_input_10 | 0 | Choose Smoothing Type for Long Moving Average: EMA |
| v_input_11 | 30 | Enter Period for Exit Moving Average |
| v_input_12 | 0 | Choose Smoothing Type for Exit Moving Average: EMA |
Source (PineScript)
/*backtest
start: 2022-10-30 00:00:00
end: 2023-11-05 00:00:00
period: 1d
basePeriod: 1h
exchanges: [{"eid":"Futures_Binance","currency":"BTC_USDT"}]
*/

// This source code is subject to the terms of the Mozilla Public License 2.0 at https://mozilla.org/MPL/2.0/
// © TwoChiefs

//@version=4
strategy("John EMA Crossover Strategy", overlay=true)
////////////////////////////////////////////////////////////////////////////////
// BACKTESTING RANGE

// From Date Inputs
fromDay = input(defval = 1, title = "From Day", minval = 1, maxval = 31)
fromMonth = input(defval = 1, title = "From Month", minval = 1, maxval = 12)
fromYear = input(defval = 2020, title = "From Year", minval = 1970)

// To Date Inputs
toDay = input(defval = 1, title = "To Day", minval = 1, maxval = 31)
toMonth = input(defval = 1, title = "To Month", minval = 1, maxval = 12)
toYear = input(defval = 2021, title = "To Year", minval = 1970)

// Calculate start/end date and time condition
startDate = timestamp(fromYear, fromMonth, fromDay, 00, 00)
finishDate = timestamp(toYear, toMonth, toDay, 00, 00)
time_cond = true

////////////////////////////////////////////////////////////////////////////////

//CREATE USER-INPUT VARIABLES

periodShort = input(13, minval=1, title="Enter Period for Short Moving Average")
smoothingShort = input(title="Choose Smoothing Type for Short Moving Average", defval="EMA", options=["RMA", "SMA", "EMA", "WMA", "VWMA", "SMMA", "DEMA", "TEMA", "HullMA", "LSMA"])

periodLong = input(48, minval=1, title="Enter Period for Long Moving Average")
smoothingLong = input(title="Choose Smoothing Type for Long Moving Average", defval="EMA", options=["RMA", "SMA", "EMA", "WMA", "VWMA", "SMMA", "DEMA", "TEMA", "HullMA", "LSMA"])

periodExit = input(30, minval=1, title="Enter Period for Exit Moving Average")
smoothingExit = input(title="Choose Smoothing Type for Exit Moving Average", defval="EMA", options=["RMA", "SMA", "EMA", "WMA", "VWMA", "SMMA", "DEMA", "TEMA", "HullMA", "LSMA"])


src1 = close
pivot = (high + low + close) / 3

//MA CALCULATION FUNCTION
ma(smoothing, src, length) =>
    if smoothing == "RMA"
        rma(src, length)
    else
        if smoothing == "SMA"
            sma(src, length)
        else
            if smoothing == "EMA"
                ema(src, length)
            else
                if smoothing == "WMA"
                    wma(src, length)
				else
					if smoothing == "VWMA"
						vwma(src, length)
					else
						if smoothing == "SMMA"
							na(src[1]) ? sma(src, length) : (src[1] * (length - 1) + src) / length

						else
							if smoothing == "HullMA"
								wma(2 * wma(src, length / 2) - wma(src, length), round(sqrt(length)))


//ASSIGN A MOVING AVERAGE RESULT TO A VARIABLE
shortMA=ma(smoothingShort, pivot, periodShort)
longMA=ma(smoothingLong, pivot, periodLong)
exitMA=ma(smoothingExit, pivot, periodExit)

//PLOT THOSE VARIABLES
plot(shortMA, linewidth=4, color=color.yellow,title="The Short Moving Average")
plot(longMA, linewidth=4, color=color.blue,title="The Long Moving Average")
plot(exitMA, linewidth=1, color=color.red,title="The Exit CrossUnder Moving Average")


//BUY STRATEGY
buy = crossover(shortMA,longMA) ? true : na
exit = crossunder(close,exitMA) ? true : na


strategy.entry("long",true,when=buy and time_cond)
strategy.close("long",when=exit and time_cond)


if (not time_cond)
    strategy.close_all()
Detail
https://www.fmz.com/strategy/431280
Last Modified
2023-11-06 16:38:22