
6.3 KiB
Name
移动平均线交叉穿越策略Moving-Average-Crossover-Strategy
Author
ChaoZhang
Strategy Description
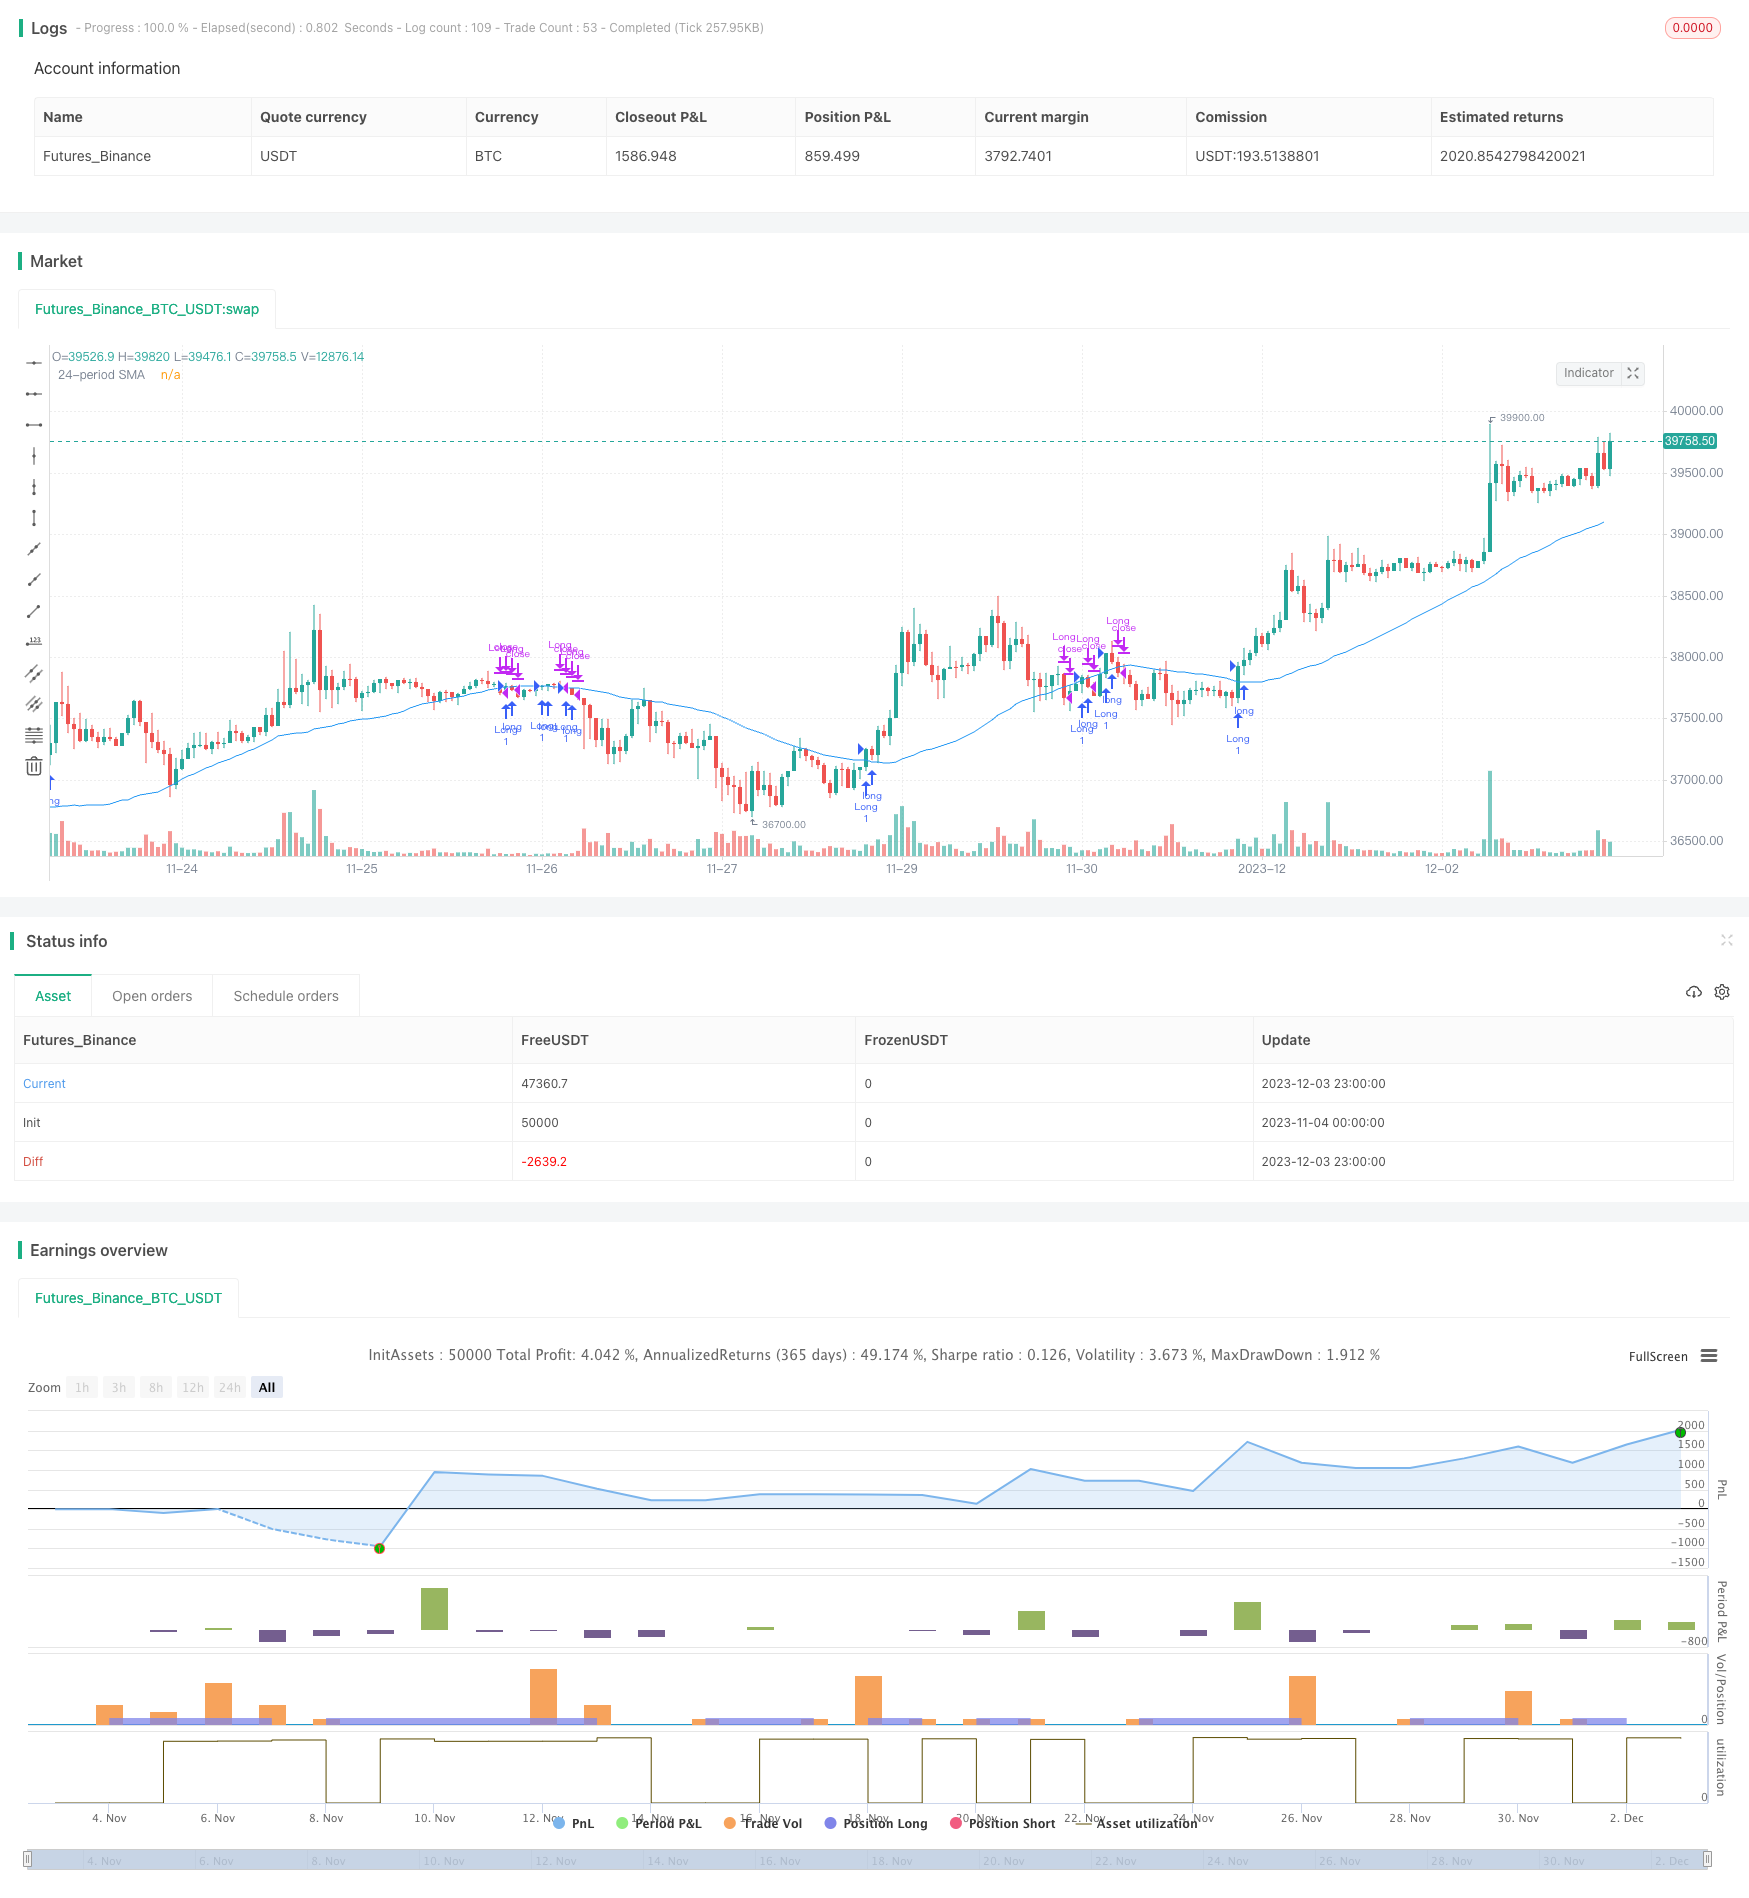
[trans]
概述
移动平均线交叉穿越策略是一种基于技术指标的量化交易策略。该策略通过计算两条移动平均线之间的交叉关系,判断市场的趋势方向,并相应生成交易信号。
策略原理
该策略的核心指标是两条移动平均线:一条较长期的40周期简单移动平均线(SMA),以及股票的收盘价。当股票的收盘价从下方向上突破40周期SMA时,表示市场趋势可能发生转折,股票进入新的上升趋势,这时策略会生成做多信号;当收盘价下跌突破40周期SMA时,表示股票上升趋势结束,可能进入下跌通道,这时策略会平仓做多头仓位。
通过比较收盘价与SMA的突破关系,可以捕捉到价格趋势的转折点,进而根据趋势方向做出交易决策。
策略优势
该策略具有以下几个优势:
- 规则简单清晰,容易理解与实施;
- 可有效捕捉股票中长线趋势的转折,及时调整仓位;
- SMA指标对异常价格变动有一定的滤波效果,可减少错误信号;
- 可自定义SMA参数,适用于不同的交易品种与周期。
策略风险
该策略也存在以下风险:
- SMA指标作为趋势跟踪工具,对突发事件的响应滞后;
- 可能出现频繁交易与反复震荡,增加交易成本和套利风险;
- 参数设置不当可能导致过度交易或错过机会。
可通过调整SMA参数、设置止损线等方法来控制风险。
优化方向
该策略还可从以下几个方面进行优化:
- 增加多个移动平均线比较,形成交易过滤器,减少错误信号;
- 结合其他指标判断,如成交量fgraph矩,增强决策可靠性;
- 动态优化SMA参数,让它自动适应市场变化;
- 设定复合条件的止损机制,控制单笔损失。
总结
移动平均线交叉策略通过比较价格与SMA的关系变化判断趋势转折,是一种较为经典的规则型交易策略。该策略实施简单,容易跟踪中长期趋势获利,同时也存在一定盈利回吐和滞后识别风险。可通过参数设定与组合指标判断来控制风险与提高决策效果。
||
Overview
The moving average crossover strategy is a quantitative trading strategy based on technical indicators. It judges the trend direction of the market by calculating the crossover relationship between two moving average lines, and generates corresponding trading signals.
Strategy Logic
The core indicators of this strategy are two moving average lines: a longer 40-period simple moving average (SMA) and the closing price of the stock. When the closing price breaks through the 40-period SMA from below, it indicates that the market trend may reverse and the stock may enter a new uptrend. At this point, the strategy will generate a long signal. When the closing price falls below the 40-period SMA, it indicates that the uptrend of the stock has ended and it may enter a downtrend channel. The strategy will close long positions at this time.
By comparing the breakthrough relationship between closing price and SMA, the turning points of the price trend can be captured to make trading decisions according to the trend direction.
Advantages of the Strategy
The strategy has the following advantages:
- Simple and clear rules that are easy to understand and implement.
- Can effectively capture the reversal of stock mid-to-long term trends and timely adjust positions.
- The SMA indicator has a certain filtering effect on abnormal price movements and can reduce false signals.
- Customizable SMA parameters, applicable to different trading varieties and cycles.
Risks of the Strategy
There are also the following risks:
- As a trend tracking tool, the SMA indicator lags in responding to sudden events.
- Frequent trading and whipsaw may increase trading costs and locked profit risks.
- Improper parameter settings may lead to overtrading or missing opportunities.
Risks can be controlled by adjusting SMA parameters, setting stop loss lines, etc.
Optimization Directions
The strategy can also be optimized in the following aspects:
- Add comparisons of multiple moving averages to form a filter to reduce false signals.
- Incorporate other indicators such as trading volume and graph rector to enhance reliability.
- Dynamically optimize SMA parameters to automatically adapt them to market changes.
- Set stop loss mechanisms with compound conditions to control single transaction loss.
Summary
The moving average crossover strategy judges trend reversal by comparing price changes with the SMA relationship. It is a relatively classic rule-based trading strategy. The strategy is simple to implement, easy to follow mid-to-long term trends for profit, while there are also certain risks of profit retracement and lagging identification. Risks can be controlled and decision effectiveness improved by parameter settings and incorporating other indicators.
[/trans]
Strategy Arguments
| Argument | Default | Description |
|---|---|---|
| v_input_1 | 40 | SMA Length |
Source (PineScript)
/*backtest
start: 2023-11-04 00:00:00
end: 2023-12-04 00:00:00
period: 1h
basePeriod: 15m
exchanges: [{"eid":"Futures_Binance","currency":"BTC_USDT"}]
*/

//@version=5
strategy(title="MA Crossover (40)", overlay=true)

// Input for the SMA length (24)
sma_length = input(40, title="SMA Length")
sma = ta.sma(close, sma_length)

// Determine if the current candle crosses above the 24-period SMA
longCondition = ta.crossover(close, sma)

// Determine if the current candle crosses and closes below the 24-period SMA
closeLongCondition = ta.crossunder(close, sma)

// Plot the 24-period SMA
plot(sma, color=color.blue, title="24-period SMA")

// Long entry signal
if (longCondition)
    strategy.entry("Long", strategy.long)

// Close long position when the current candle crosses and closes below the 24-period SMA
if (closeLongCondition)
    strategy.close("Long")


// Create alerts
alertcondition(longCondition, title="Candle Crosses Above SMA 40", message="Candle has crossed above SMA 40.")
alertcondition(longCondition, title="Candle Closes Above SMA 40", message="Candle has closed above SMA 40.")
Detail
https://www.fmz.com/strategy/434304
Last Modified
2023-12-05 11:52:28