
10 KiB
Name
移动平均交叉趋势跟踪策略Zhukovs-Moving-Average-Crossover-Trend-Following-Strategy
Author
ChaoZhang
Strategy Description
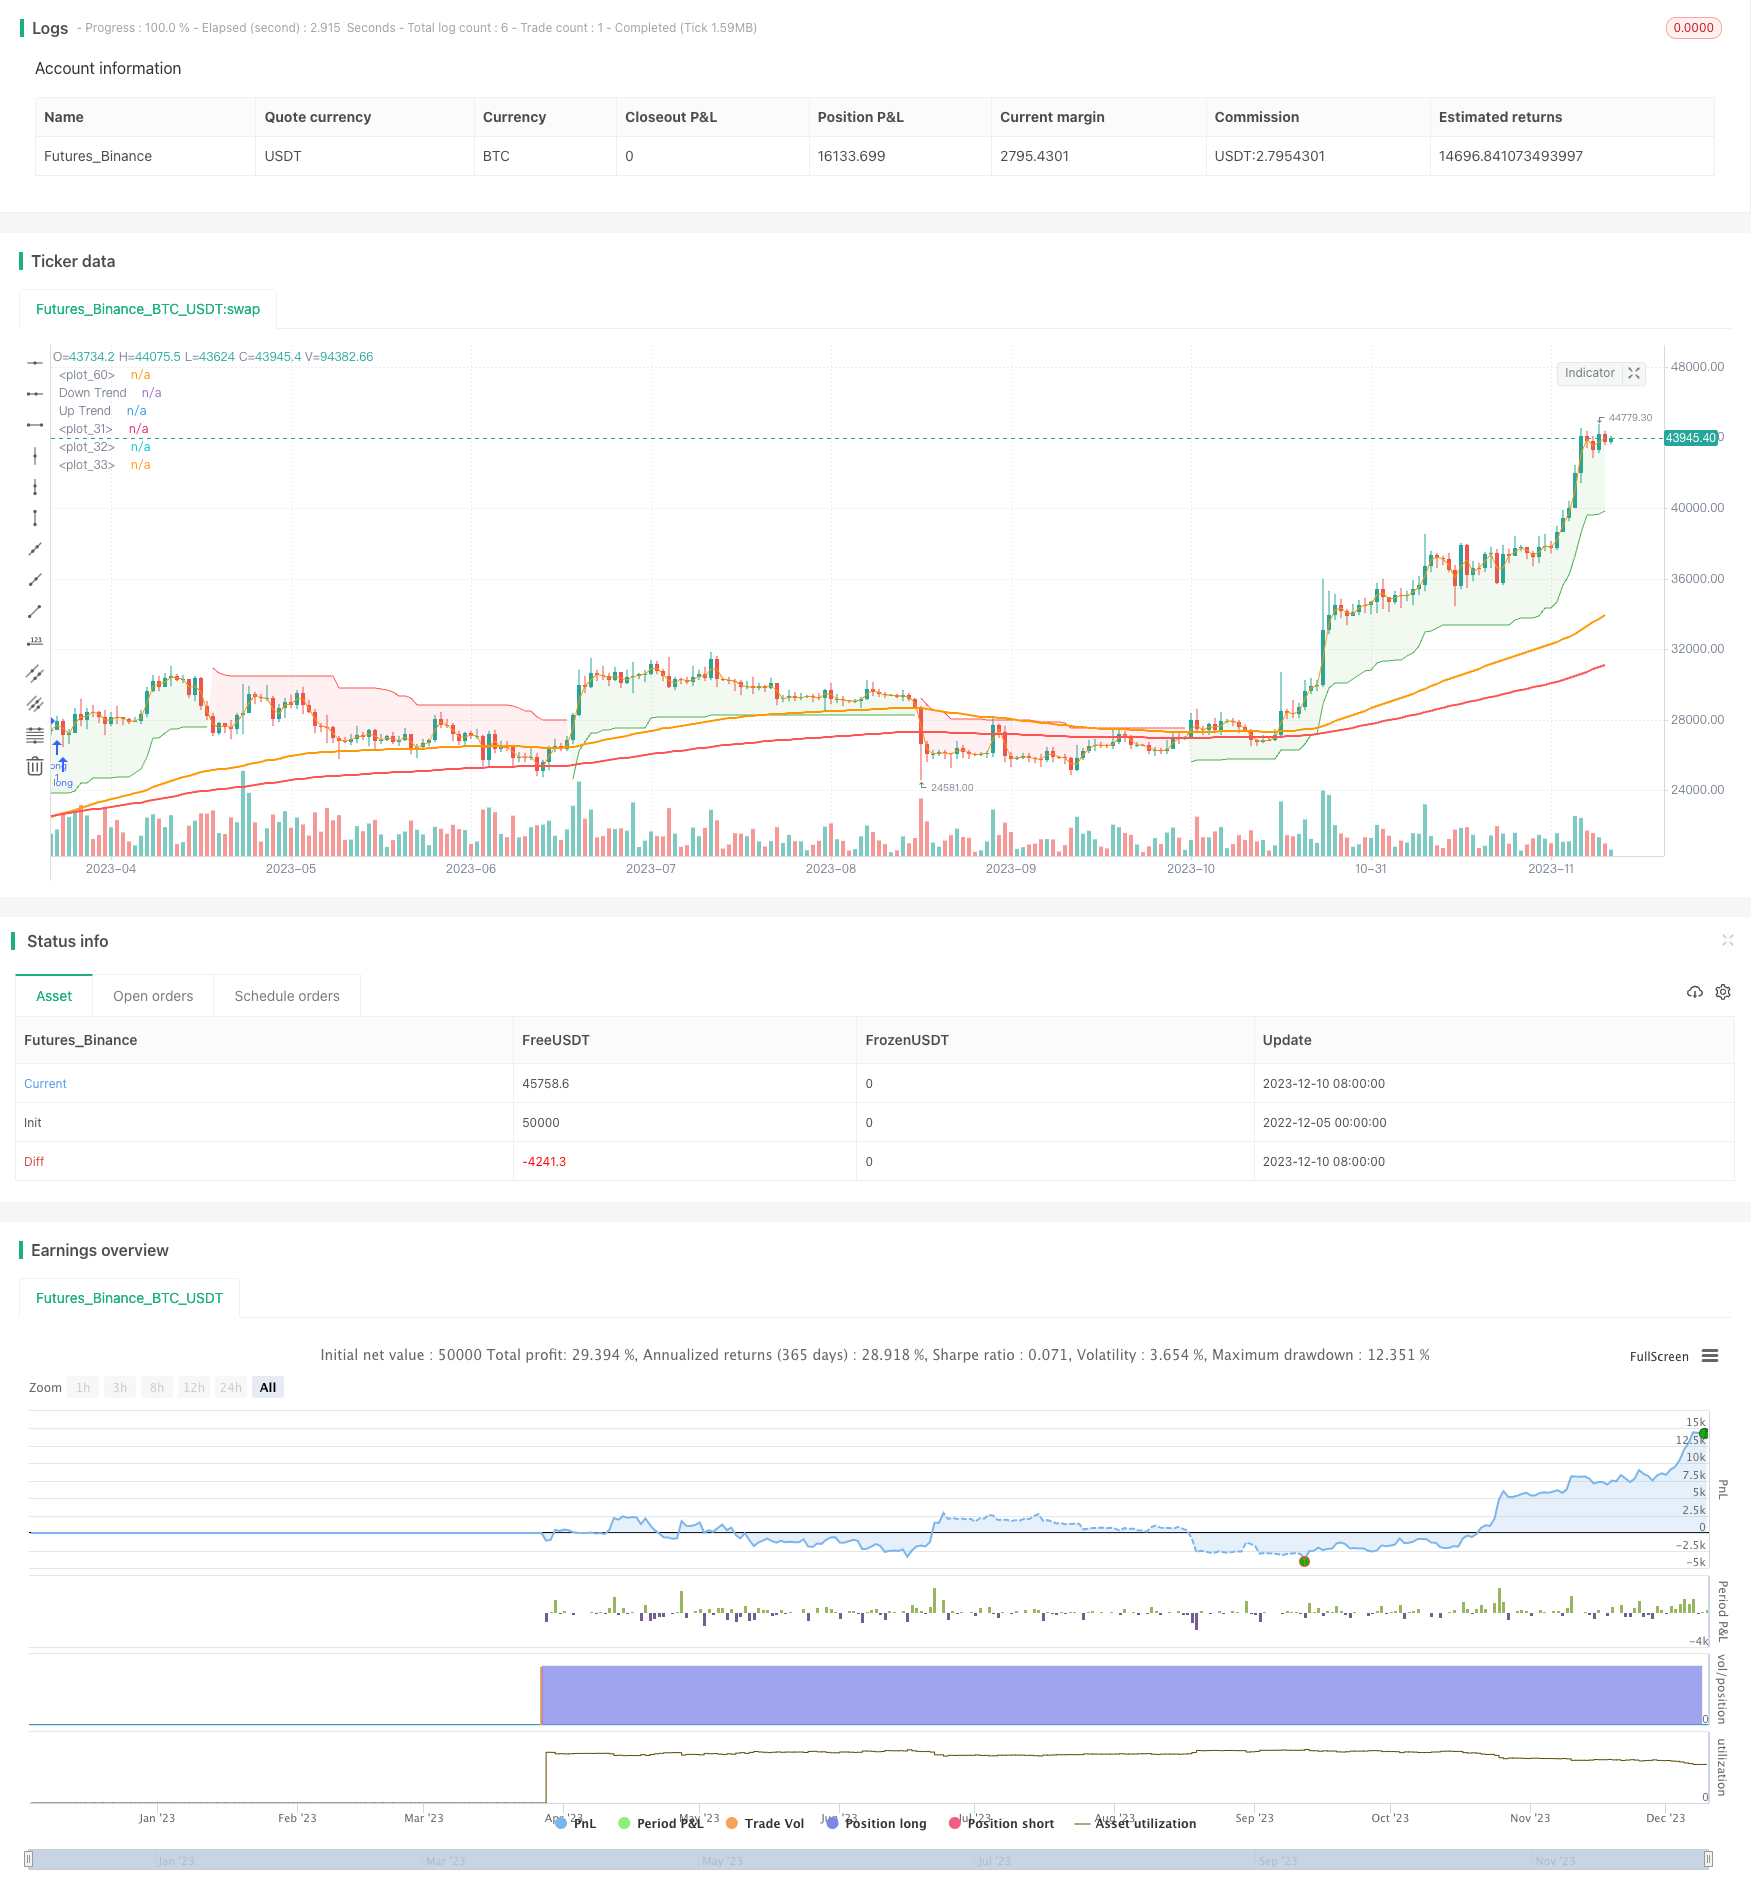 [trans]
概述
该策略基于移动平均线交叉和ATR指标来实现自动化的趋势跟踪交易。当快速EMA线上穿慢速EMA线时,采取做多头仓位;当快速EMA线下穿慢速EMA线时,采取做空头仓位。同时,结合ATR指标来判断趋势方向,只有在ATR判断为趋势方向时才发出交易信号。
策略原理
该策略主要基于两个技术指标:
-
EMA均线:采用快慢两个不同参数的EMA均线,当快线上穿慢线时视为多头信号,下穿时视为空头信号。
-
ATR指标:ATR指标能够判断价格波动的幅度和力度, 从而判断当前走势的趋势性。当ATR数值较小时表示目前处于盘整,此时不宜建仓;当ATR数值较大且方向向上时,表示目前处于趋势市,此时等待EMA金叉做多;当ATR数值较大且方向向下时,表示目前处于趋势市,此时等待EMA死叉做空。
通过EMA均线的交叉来寻找买卖点机会,同时结合ATR指标来过滤掉趋势性不强的交易信号,避免在市场震荡盘整中被套牢。
优势分析
该策略具有以下优势:
-
只在ATR指标判断为趋势行情时才交易,有助于避免震荡不明时被套牢。
-
运用快慢均线的交叉原理寻找买卖点,简单有效。
-
通过参数调节,EMA均线的敏感度和平滑性可以根据个人喜好进行调整。
-
只需要利用两个简单指标即可实现的完整的自动交易系统,可以轻松地通过Pine编辑器进行策略开发与优化。
-
无需频繁调整的参数,实现简单的ParameterSet和Forget策略。
风险分析
该策略也存在一些风险需要关注:
-
EMA交叉容易产生假信号,可能引发不必要的亏损。可以通过调整EMA参数平滑一些指标。
-
ATR指标有时对盘整和趋势的判断也可能有失误,从而导致错过交易机会。可适当宽松ATR的数值门槛。
-
策略本身没有考虑大级别因素分析,如果遇到重大消息面市场出现反转,则很难通过快速均线交叉判断,这时需要人工干预装逃顶底。
可以通过一定的优化来降低这些风险的影响。
优化方向
该策略还有以下几个主要的优化方向:
-
可以考虑加入其它指标判断,形成指标组合系统,提高信号的准确性。例如结合RSI指标避免超买超卖的风险。
-
可以根据不同交易品种、不同交易区间来选择更合适的参数,使EMA和ATR的参数更符合当下市场特点。
-
可以通过机器学习等方法实现动态参数优化。让指标参数可以根据实时市场情况进行调整,而不是使用固定静态的数值。
总结
本策略整体是一个非常实用的趋势跟踪策略。只需要两种简单指标的组合就可以实现较为完整的交易系统。通过参数调节可以适应不同偏好的交易者。同时也具有进一步扩展优化的空间,使策略表现更加出色。简单高效的交易思路与良好的优化潜力,使其成为值得长期研究与应用的量化策略之一。
||
Overview
This strategy uses moving average crossovers and the ATR indicator to implement automated trend following trading. It goes long when the fast EMA crosses above the slow EMA, and goes short when the fast EMA crosses below the slow EMA. At the same time, it uses the ATR indicator to judge the trend direction and only sends trading signals when the ATR indicates that a trend is present.
Strategy Logic
The strategy is mainly based on two technical indicators:
-
EMA Lines: It uses two EMA lines with different parameters, fast and slow. When the fast EMA crosses above the slow EMA, it is considered a long signal. When the fast EMA crosses below the slow EMA, it is considered a short signal.
-
ATR Indicator: The ATR indicator measures the magnitude and force of price fluctuations to judge the trendiness of the current move. Small ATR values indicate consolidation while large upward ATR values suggest an uptrend, and large downward ATR values suggest a downtrend.
By combining EMA crossovers to identify trading opportunities and the ATR filter to avoid low trendiness regimes, the strategy aims to avoid being whipsawed during market choppiness.
Advantage Analysis
The advantages of this strategy include:
-
Only trading when the ATR identifies a trend, which helps avoid being whipsawed during non-directional regimes.
-
Using simple fast vs slow EMA crossover logic to identify trading signals.
-
Customizable EMA sensitivity and smoothness through parameter adjustments.
-
Complete automated trading system built with just two simple indicators, easily implemented in Pine editor.
-
Minimal need for ongoing parameter tweaking, “set and forget” approach.
Risk Analysis
Some risks to note include:
-
EMA crossovers may generate false signals, leading to unnecessary losses. Smoother EMA parameters may help.
-
ATR trend judgment can also be prone to errors, missing trading opportunities. ATR threshold values could be loosened.
-
No consideration of higher timeframe fundamentals. Major news events can trigger reversals that fast EMA crossovers may miss, requiring manual intervention.
These risks can be reduced through optimizations.
Optimization Directions
Main optimization directions include:
-
Adding other indicators to create a combined system and improve signal accuracy. Example - integrating RSI to avoid overbought/oversold risks.
-
Selecting EMA and ATR parameters more suited to the particular market based on symbol and time frame traded.
-
Implementing dynamic parameter optimization through machine learning to adjust indicators based on current market conditions instead of using fixed static values.
Conclusion
Overall this is a very practical trend following strategy. With just a simple combination of two indicators, it builds a relatively complete trading system. Through parameter adjustments it can be adapted to traders with different preferences and styles. At the same time, further expansion and optimizations can make strategy performance even better. The simple yet effective trading logic coupled with strong optimization potential makes this a worthwhile quantitative strategy to research and apply over the long run.
[/trans]
Strategy Arguments
| Argument | Default | Description |
|---|---|---|
| v_input_int_1 | 100 | Fast EMA |
| v_input_int_2 | 200 | Slow EMA |
| v_input_string_1 | 0 | Trade Direction: Both |
| v_input_1 | timestamp(01 Jan 2023 00:00) | Start Date |
| v_input_2 | timestamp(31 Dec 2023 23:59) | End Date |
| v_input_3 | false | Take Profit Percent |
| v_input_4 | false | Stop Loss Percent |
| v_input_5 | 12 | ATR Length |
| v_input_float_1 | 3 | Factor |
Source (PineScript)
/*backtest
start: 2022-12-05 00:00:00
end: 2023-12-11 00:00:00
period: 1d
basePeriod: 1h
exchanges: [{"eid":"Futures_Binance","currency":"BTC_USDT"}]
*/

// This strategy has been created for GMT trade 4h by Zhukov


//@version=5
strategy('ZhukovTrade', overlay=true, calc_on_every_tick=true, currency=currency.USD)

// INPUT:

// Options to enter fast and slow Exponential Moving Average (EMA) values
emaFast = input.int(title='Fast EMA', defval=100, minval=1, maxval=9999)
emaSlow = input.int(title='Slow EMA', defval=200, minval=1, maxval=9999)

// Option to select trade directions
tradeDirection = input.string(title='Trade Direction', options=['Long', 'Short', 'Both'], defval='Both')

// Options that configure the backtest date range
startDate = input(title='Start Date', defval=timestamp('01 Jan 2023 00:00'))
endDate = input(title='End Date', defval=timestamp('31 Dec 2023 23:59'))


// CALCULATIONS:

// Use the built-in function to calculate two EMA lines
fastEMA = ta.ema(close, emaFast)
slowEMA = ta.ema(close, emaSlow)
emapos = ta.ema(close,200)

// PLOT:

// Draw the EMA lines on the chart
plot(series=fastEMA, color=color.new(color.orange, 0), linewidth=2)
plot(series=slowEMA, color=color.new(color.blue, 0), linewidth=2)
plot(series=emapos, color=color.new(color.red, 0), linewidth=2)


// CONDITIONS:

// Check if the close time of the current bar falls inside the date range
inDateRange = true

// Translate input into trading conditions
longOK = tradeDirection == 'Long' or tradeDirection == 'Both'
shortOK = tradeDirection == 'Short' or tradeDirection == 'Both'

// Decide if we should go long or short using the built-in functions
longCondition = ta.crossover(fastEMA, slowEMA)
shortCondition = ta.crossunder(fastEMA, slowEMA)
// ORDERS:
// Set take profit and stop loss percentages
take_profit_percent = input(0, title="Take Profit Percent")
stop_loss_percent = input(0, title="Stop Loss Percent")
// Submit entry (or reverse) orders


atrPeriod = input(12, "ATR Length")
factor = input.float(3.0, "Factor", step = 0.01)

[supertrend, direction] = ta.supertrend(factor, atrPeriod)

bodyMiddle = plot((open + close) / 2, display=display.none)
upTrend = plot(direction < 0 ? supertrend : na, "Up Trend", color = color.green, style=plot.style_linebr)
downTrend = plot(direction < 0? na : supertrend, "Down Trend", color = color.red, style=plot.style_linebr)

fill(bodyMiddle, upTrend, color.new(color.green, 90), fillgaps=false)
fill(bodyMiddle, downTrend, color.new(color.red, 90), fillgaps=false)

if longCondition and inDateRange
    if longOK and direction<0

        strategy.entry(id='long', direction=strategy.long, alert_message = "LONG")
if shortCondition and inDateRange
    if shortOK and direction>0
        strategy.entry(id='short', direction=strategy.short, alert_message = "SHORT")

// Submit exit orders in the cases where we trade only long or only short

if strategy.position_size > 0 and take_profit_percent
    strategy.exit(id='tp long',from_entry ="long",profit = take_profit_percent)
if strategy.position_size > 0 and stop_loss_percent
    strategy.exit(id='sl long',from_entry="long",loss=stop_loss_percent)

if strategy.position_size < 0 and stop_loss_percent
    strategy.exit(id='sl short',from_entry="short",loss=stop_loss_percent)
if strategy.position_size < 0 and take_profit_percent
    strategy.exit(id='tp short',from_entry="short",profit = take_profit_percent)
Detail
https://www.fmz.com/strategy/435102
Last Modified
2023-12-12 12:24:11