
10 KiB
Name
相对强弱指数多空策略Relative-Strength-Index-Long-Short-Strategy
Author
ChaoZhang
Strategy Description
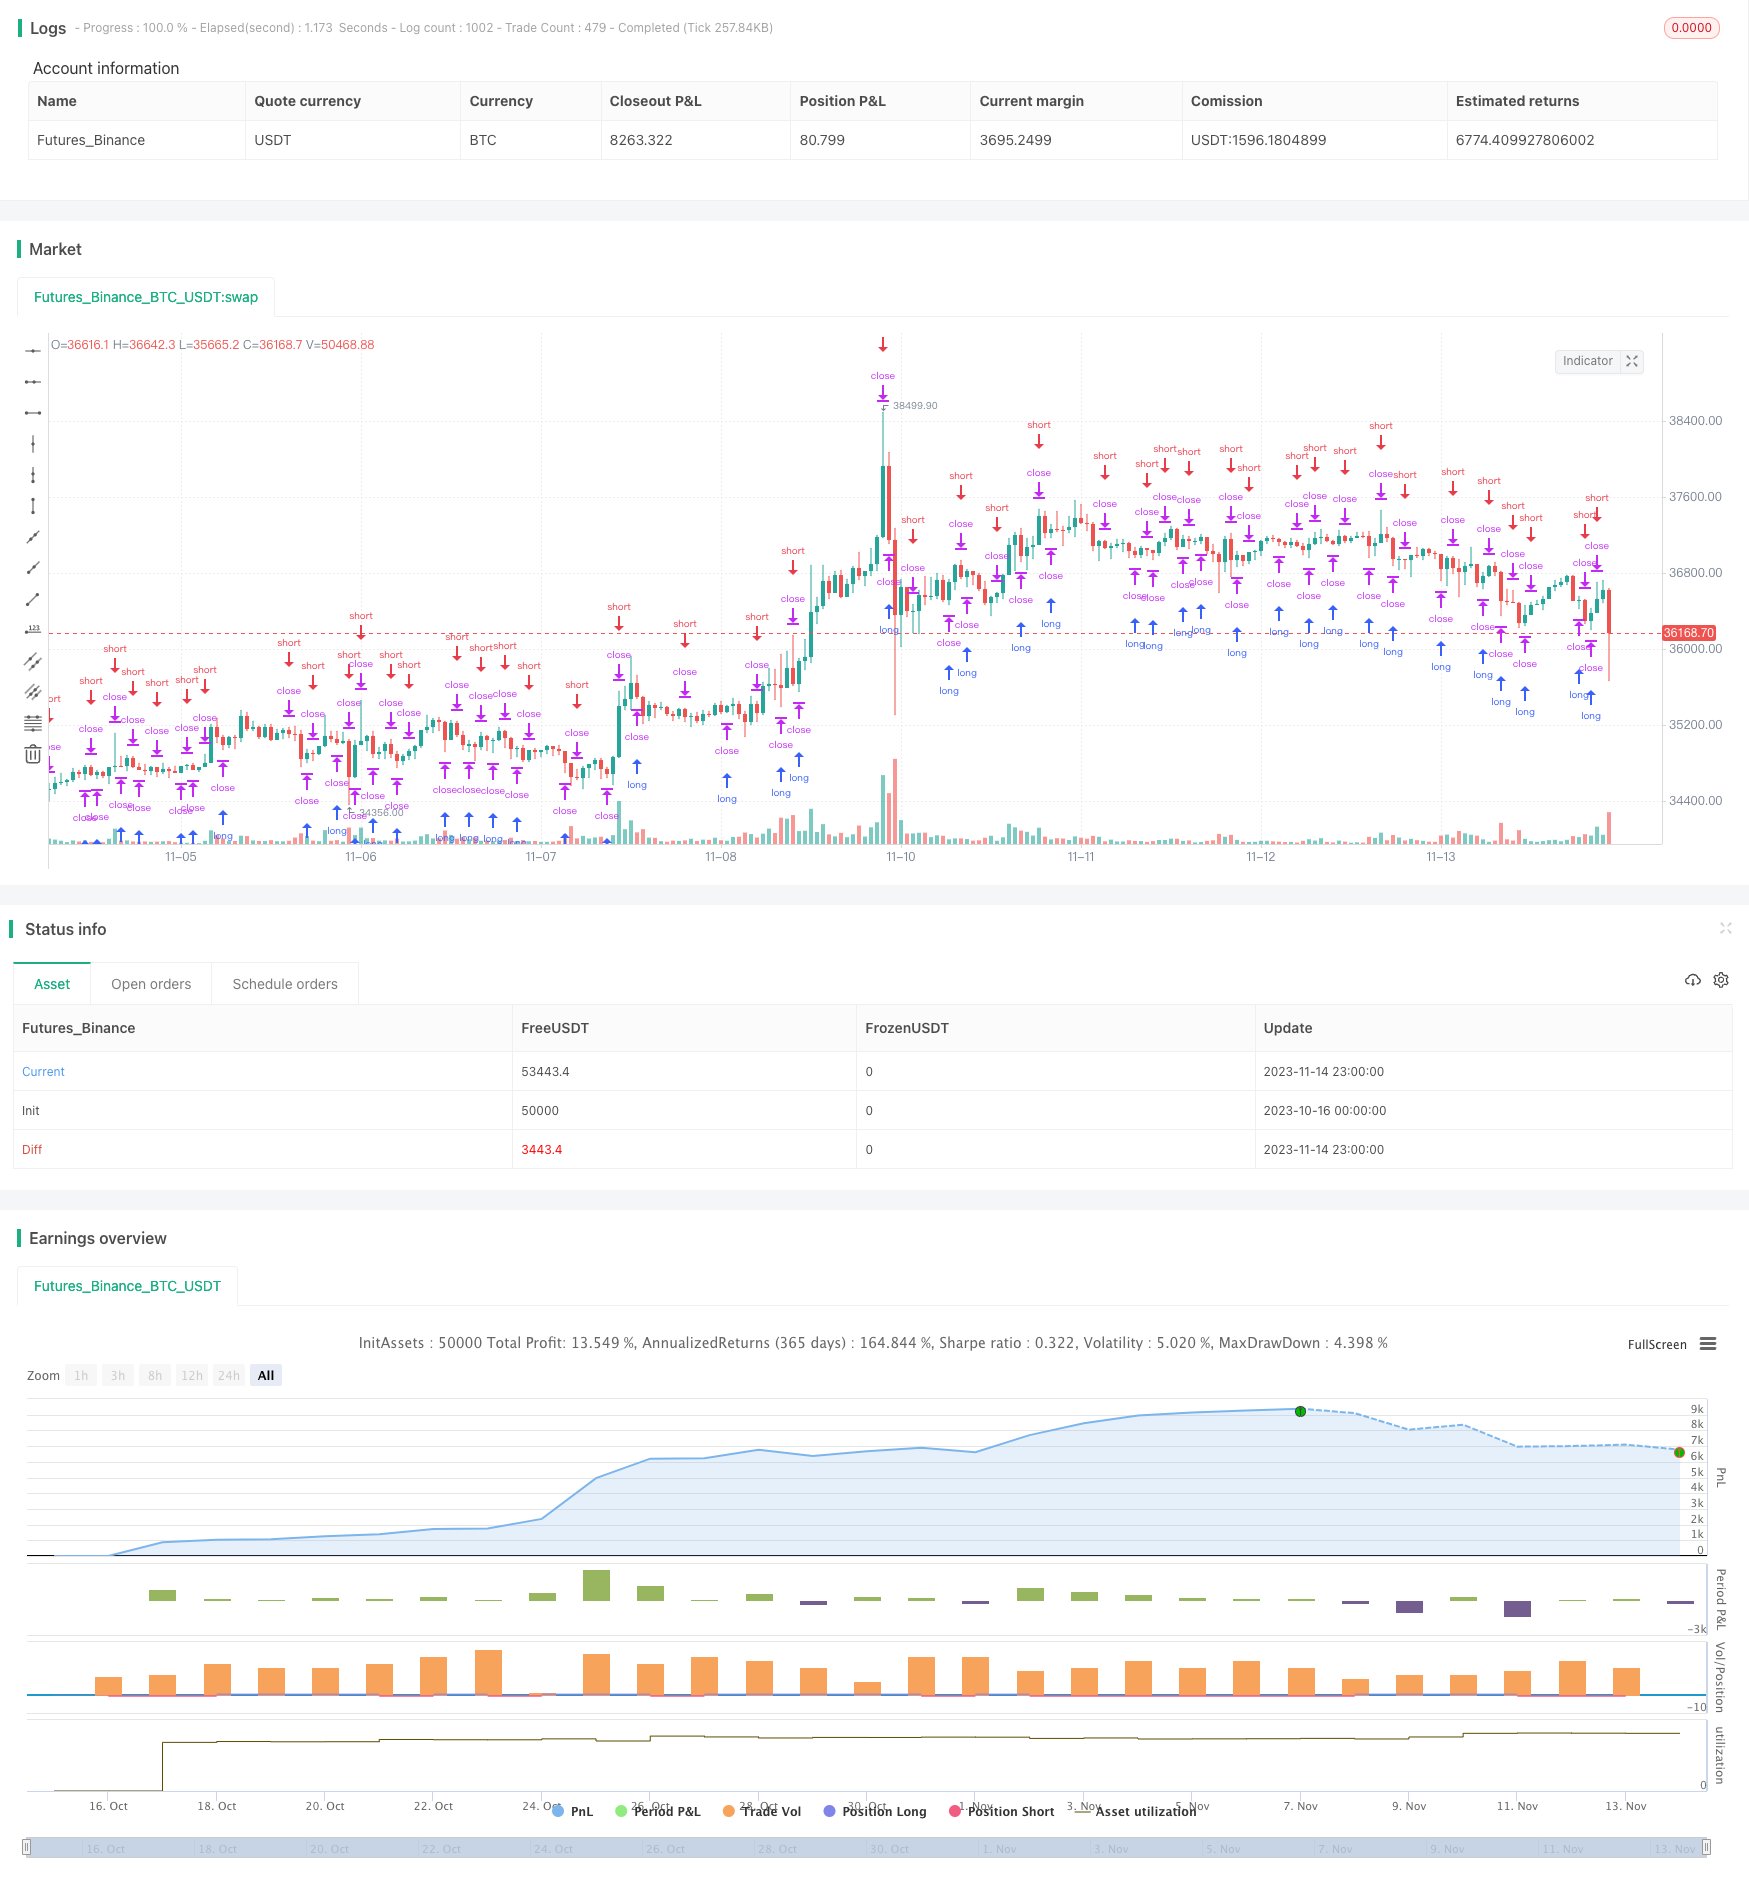
[trans]
概述
该策略通过比较数字货币的RSI指标与加密市场指数的RSI指标,判断数字货币相对于加密市场的价值,产生交易信号。
策略原理
该策略首先允许选择一个加密市场指数,如总市值、总市值除比特币、其他币种总市值等。同时选择一个更高时间周期的加密市场指数,默认是日线。然后计算选定数字货币的RSI指标和该加密市场指数的RSI指标,通过比值得到一个相对强弱指数。当该相对强弱指数上穿指定参数时,产生买入信号;当下穿时,产生卖出信号。
该策略的核心逻辑是,当数字货币的RSI强于加密市场指数时,说明该币种相对市场价值被低估,具有被高估价值的可能,所以可以买入;当数字货币RSI弱于市场指数时,说明该币种相对市场已被高估,具有被低估的可能,所以可以卖出。通过相对强弱指数,可以更准确地判断价值。
优势分析
该策略最大的优势在于利用了相对强弱指数指标,可以更准确判断数字货币的价值,而不是仅仅根据单一币种本身的技术指标来决策,避免了只看一隅的困局。
相对强弱指数充分考虑了市场整体环境对单一币种的影响,能够把握市场轮动的节奏,以及不同板块的流动,挖掘市场中的价值币种。
另外,该策略提供了多种指数选择,可以根据不同市场环境,选择最适合的指数进行交易,这为策略的效果提供了保障。
风险分析
该策略主要风险在于,相对强弱指数仅是一个价值判断工具,不能完全避免单一币种自身的技术形态产生的交易风险。
例如,如果该币进入了明显的头肩顶背驰形态,市场结构发生转变,仅凭相对强弱指数买入信号,可能会产生损失。
因此,该策略还需要结合数字货币本身的技术形态,避免在关键技术点产生不理想的交易。
另一个风险在于,如果选择的指数不当,与数字货币不具有高相关性,则相对强弱指数的指示作用将会大打折扣。这需要根据不同币种与市场指数的相关性优化选择。
优化方向
该策略可以从以下几个方面进行优化:
-
增加止损策略,在币种价格反转时及时止损。
-
优化指数的选择,不同币种可以匹配不同的指数,提高相关性。
-
增加多个时间周期进行组合,例如日线指标与4小时线指标进行确认,可以提高信号的可靠性。
-
增加机器学习算法,通过自适应方式确定相对强弱指数的阈值,而不是使用固定参数。
-
结合情感分析、基本面分析等其它指标,形成更全面的价值判断体系。
总结
该相对强弱指数策略通过比较数字货币与市场指数的强弱关系,判断出币种的相对价值高低,形成交易信号。策略优势在于增加了市场分析的维度,可以把握市场的节奏。但也存在一定的风险,需要进行优化,增加止损、时间周期组合、自适应阈值等手段来提升效果。如果应用得当,该策略可以在数字货币量化交易中发挥重要作用。
||
Overview
This strategy generates trading signals by comparing the RSI indicator of a cryptocurrency with the RSI indicator of a crypto market index to judge the relative value of the cryptocurrency against the crypto market.
Strategy Logic
The strategy allows selecting a crypto market index first, such as total market cap, total market cap excluding Bitcoin, market cap of other coins, etc. It also selects a higher time frame of the crypto index, default to daily. Then it calculates the RSI of the selected cryptocurrency and the RSI of the crypto index, and generates a relative strength index based on their ratio. When the relative strength index crosses above the specified parameter, a buy signal is generated. When it crosses below, a sell signal is generated.
The core logic is that when the RSI of the cryptocurrency is stronger than the crypto index, it means the coin is relatively undervalued compared to the market, and has the potential to become overvalued, so it can be bought. When the coin RSI is weaker than the market index, it means the coin is relatively overvalued compared to the market, and has the potential to become undervalued, so it can be sold. The relative strength index allows more accurate valuation judgments.
Advantage Analysis
The biggest advantage of this strategy is that it uses the relative strength index, which allows more accurate valuation of cryptocurrencies, instead of solely relying on technical indicators of a single coin to make decisions, avoiding the pitfall of looking at things in isolation.
The relative strength index takes into account the overall market environment's impact on individual coins, and can capture the market rotation rhythm and sector rotations, and dig out valuable coins from the market.
Also, the strategy provides multiple index selections, which can be optimized for different market environments to ensure the strategy's effectiveness.
Risk Analysis
The main risk of this strategy is that the relative strength index is merely a valuation tool, and cannot completely avoid trading risks arising from the technical patterns of individual coins.
For example, if the coin has entered an obvious head-and-shoulders top reversal pattern, and the market structure has changed, relying solely on the relative strength buy signals could lead to losses.
Therefore, the strategy needs to combine the technical patterns of the individual cryptocurrencies themselves to avoid unfavorable trades at critical technical points.
Another risk is if the selected index is inappropriate, and has low correlation with the cryptocurrency, then the indicating power of the relative strength index would be largely compromised. This requires optimizing the index selection based on the correlation between different coins and market indices.
Optimization Directions
The strategy can be optimized in the following aspects:
-
Add stop loss strategies to cut losses in time when prices reverse.
-
Optimize index selection, match different indices for different coins to increase correlation.
-
Add multiple time frame combinations, such as confirming daily signals with 4h signals, to increase signal reliability.
-
Add machine learning algorithms to adaptively determine the threshold for the relative strength index, instead of using fixed parameters.
-
Incorporate other indicators like sentiment analysis, fundamental analysis to form a more comprehensive valuation system.
Conclusion
The relative strength index strategy judges the relative valuation of cryptocurrencies by comparing their strength against market indices, and generates trading signals. Its advantage lies in incorporating market analysis dimensions and capturing market rhythms. But it also has risks that need optimization, such as adding stop loss, time frame combinations, adaptive threshold etc. to improve performance. If properly implemented, this strategy can play an important role in crypto algorithmic trading. [/trans]
Strategy Arguments
| Argument | Default | Description |
|---|---|---|
| v_input_1 | 2016 | Backtest Start Year |
| v_input_2 | true | Backtest Start Month |
| v_input_3 | true | Backtest Start Day |
| v_input_4 | 2030 | Backtest Stop Year |
| v_input_5 | 12 | Backtest Stop Month |
| v_input_6 | 30 | Backtest Stop Day |
| v_input_7 | 4 | length of rsi comparison |
| v_input_8 | true | correlation crossover |
| v_input_string_1 | 0 | Index selection: CRYPTOCAP:TOTAL2 |
| v_input_string_2 | 0 | higher time frame reference index: 120 |
| v_input_9 | true | Color Hull according to trend? |
Source (PineScript)
/*backtest
start: 2023-10-16 00:00:00
end: 2023-11-15 00:00:00
period: 1h
basePeriod: 15m
exchanges: [{"eid":"Futures_Binance","currency":"BTC_USDT"}]
*/

//@version=5
strategy('RSI correlation with cryptoindices [strategy version]', overlay=false)

// Testing Start dates
testStartYear = input(2016, 'Backtest Start Year')
testStartMonth = input(1, 'Backtest Start Month')
testStartDay = input(1, 'Backtest Start Day')
testPeriodStart = timestamp(testStartYear, testStartMonth, testStartDay, 0, 0)
//Stop date if you want to use a specific range of dates
testStopYear = input(2030, 'Backtest Stop Year')
testStopMonth = input(12, 'Backtest Stop Month')
testStopDay = input(30, 'Backtest Stop Day')
testPeriodStop = timestamp(testStopYear, testStopMonth, testStopDay, 0, 0)
testPeriod() =>
    time >= testPeriodStart and time <= testPeriodStop ? true : false

len = input(4, title='length of rsi comparison')
correlationcrossover = input(1, title='correlation crossover')
IndexSwitch = input.string('CRYPTOCAP:TOTAL2', title='Index selection', options=['CRYPTOCAP:TOTAL2', 'CRYPTOCAP:TOTAL', 'CRYPTOCAP:OTHERS', 'CRYPTOCAP:USDT', 'CRYPTOINDEX:CIX100', 'CRYPTOCAP:BTC.D', 'CRYPTOCAP:BTC'])
IndexHTF = input.string('120', title='higher time frame reference index', options=['1', '2', '5', '10', '15', '30', '45', '60', '90', '120', '150', '240', '360', '720', 'D', '3D', 'W', 'M'])
switchColor = input(true, 'Color Hull according to trend?')
ref = request.security(IndexSwitch, IndexHTF, close[1], lookahead=barmerge.lookahead_on)
RSI_ref = ta.rsi(ref, len)
RSI_close = ta.rsi(close, len)
relative = RSI_ref / RSI_close
plot(relative, color=color.new(color.blue, 0))
long = ta.crossover(relative, correlationcrossover)
short = ta.crossunder(relative, correlationcrossover)
corr = plot(correlationcrossover, color=color.new(color.green, 0), linewidth=1)
hullColor = switchColor ? relative > correlationcrossover ? #00ff00 : #ff0000 : #ff9800

//PLOT
///< Frame
Fi1 = plot(relative, title='relative', color=hullColor, linewidth=1, transp=50)
fill(Fi1, corr, title='Band Filler', color=hullColor, transp=50)

if long and testPeriod()
    strategy.entry("long", strategy.long)

if short and testPeriod()
    strategy.entry("long", strategy.short)

// alertcondition(long, title='long', message='long')
// alertcondition(short, title='short', message='short')
Detail
https://www.fmz.com/strategy/432350
Last Modified
2023-11-16 17:06:14