
7.0 KiB
Name
熊市反转哈拉米回测策略Bearish-Harami-Reversal-Backtest-Strategy
Author
ChaoZhang
Strategy Description
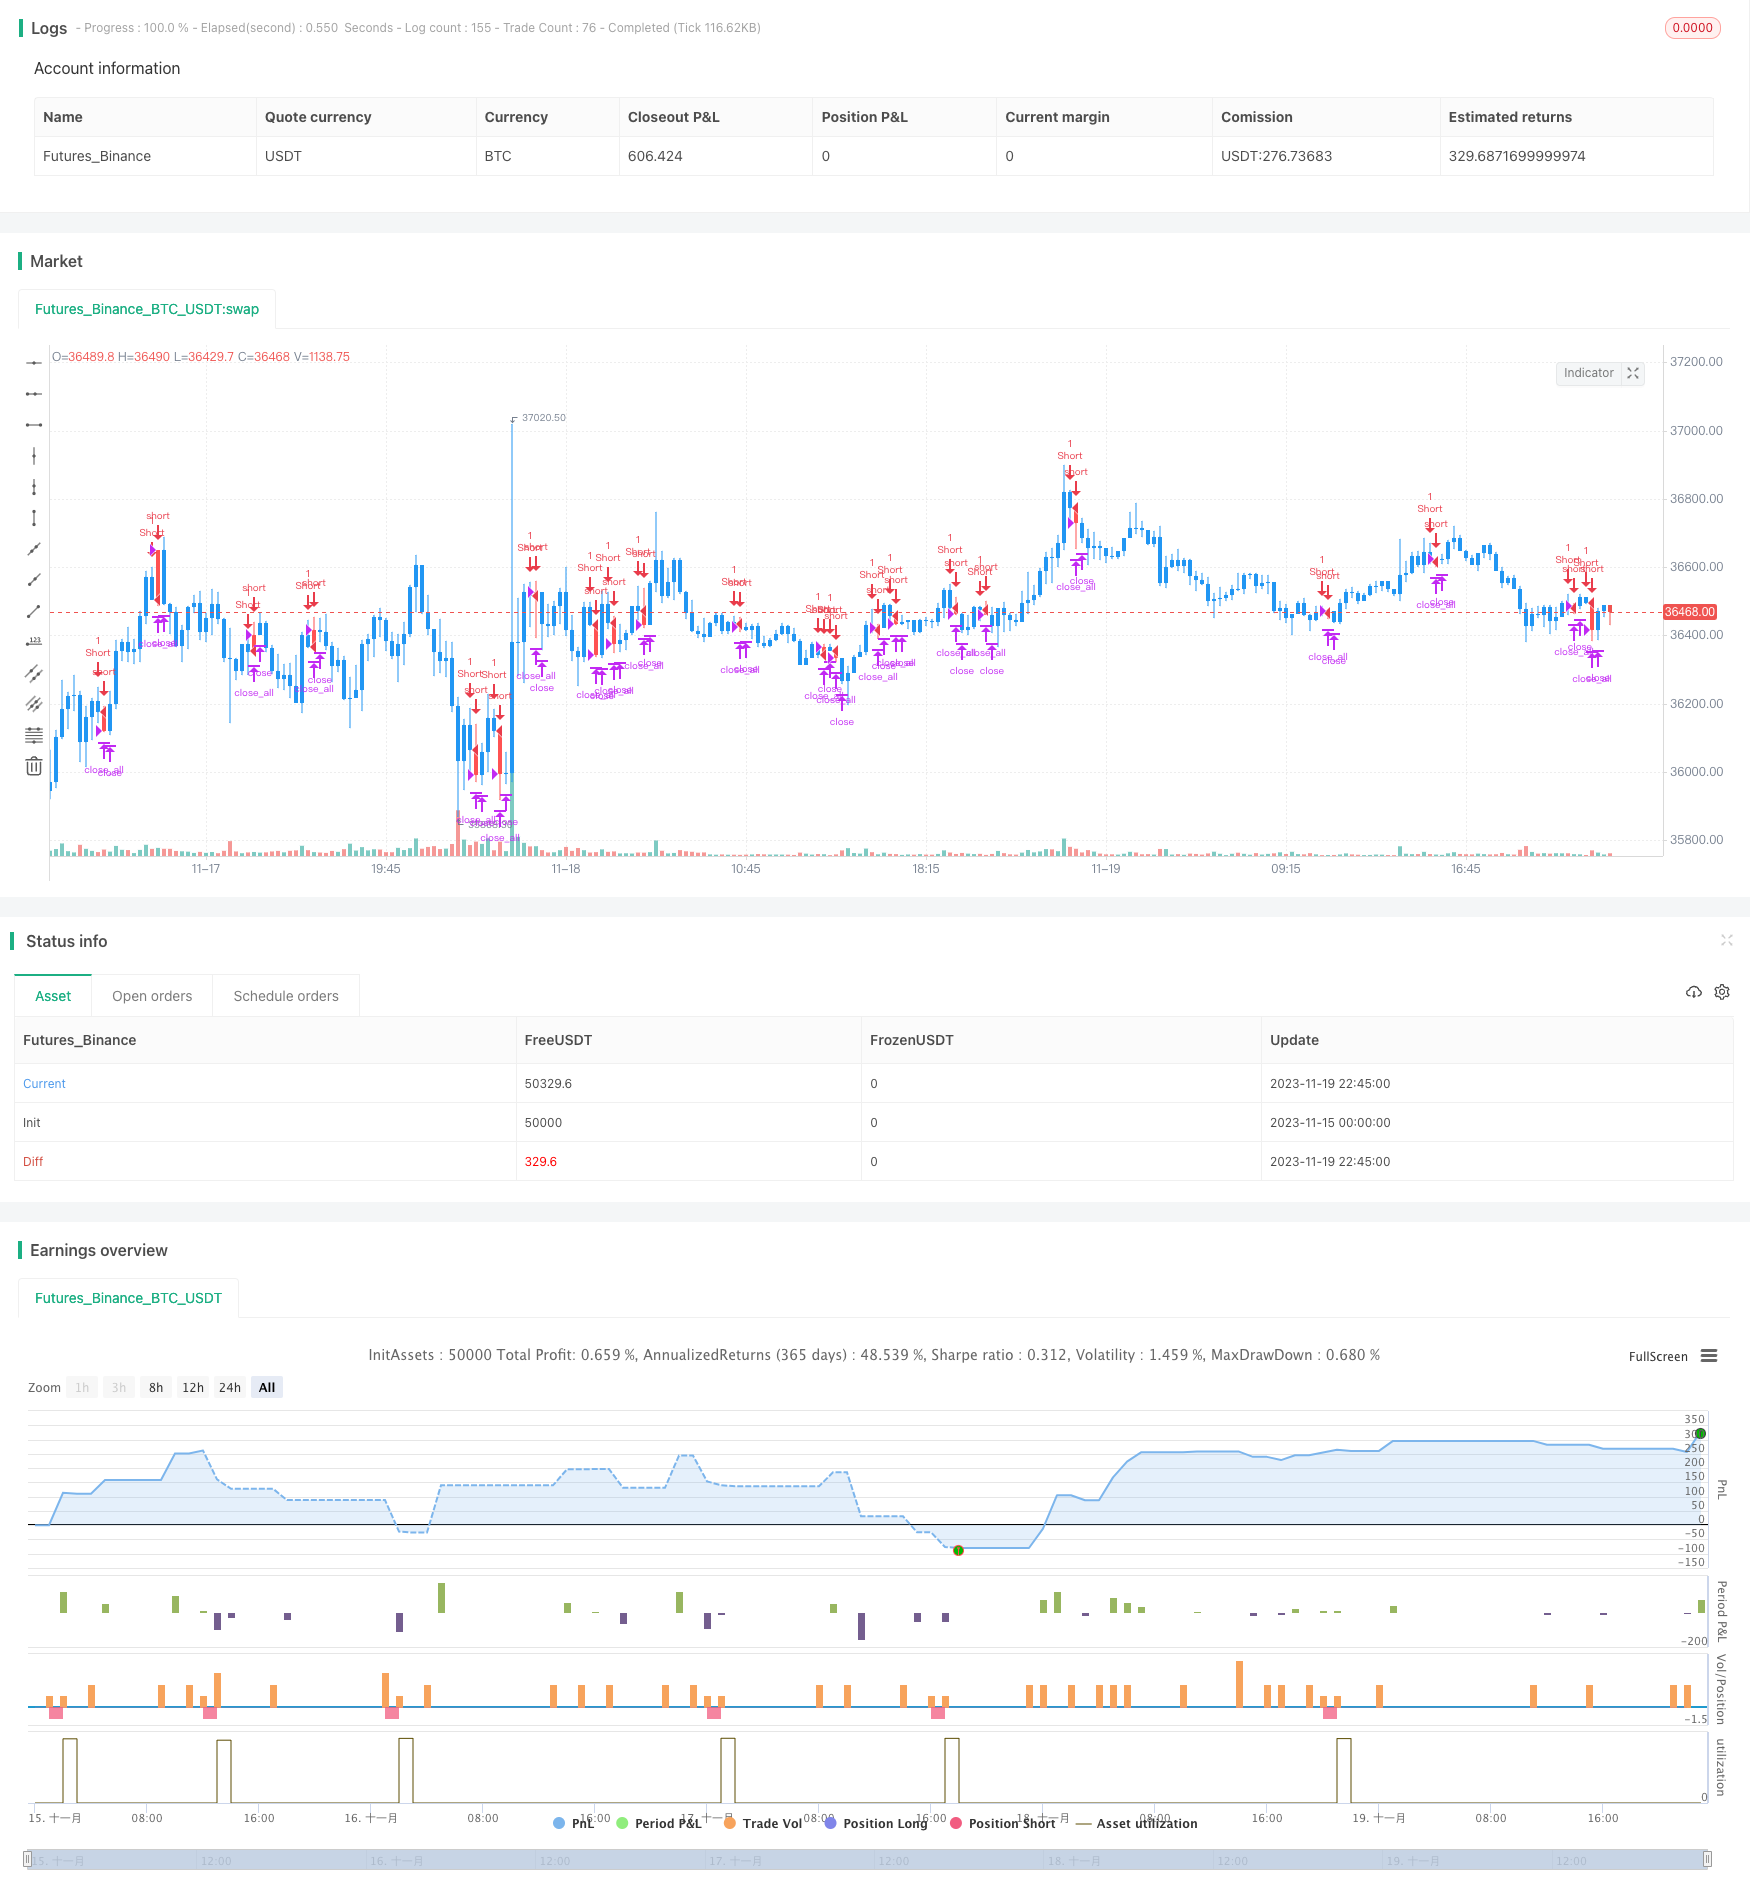
[trans]
概述
熊市反转哈拉米回测策略通过识别蜡烛图中的熊市反转哈拉米形态,实现自动交易。当识别到熊市反转哈拉米形态时,该策略会进入做空头寸;当止损或止盈后,平仓头寸。
策略原理
该策略的核心识别指标是:前一根K线为长阳线,第二根K线收盘价包含在前一根K线实体内,并且为阴线,则可能形成熊市反转哈拉米形态。符合该形态时,策略会进入做空头寸。
具体判断逻辑是:
- 计算前一根K线体大小ABS(Close1 - Open1)是否大于设置的最小实体大小
- 判断前一根K线是否为阳线 Close1 > Open1
- 判断当前K线是否为阴线 Open > Close
- 判断当前K线开盘价是否小于等于前一根K线收盘价 Open <= Close1
- 判断前一根K线开盘价是否小于等于当前K线收盘价 Open1 <= Close
- 判断当前K线实体是否小于前一根K线 Open - Close < Close1 - Open1
- 满足以上条件则形成熊市反转哈拉米,进入做空头寸
优势分析
该策略具有以下优势:
- 利用熊市反转哈拉米强势反转信号,增大获利概率
- 回测数据充足,模拟交易结果优良
- 策略逻辑简单清晰,容易理解与优化
- 可自定义止盈止损点,控制风险
风险分析
该策略也存在一些风险:
- 市场可能出现假突破,造成头寸被套。可适当放宽止损点,或增加过滤条件。
- 标的证券价格波动可能过大,无法止损。应选择波动率较低的交易品种。
- 回测数据不足,可能无法反映真实市场情况。应增加回测数据量,并做实盘验证。
优化方向
该策略还可从以下方面进行优化:
- 增加Volume,MACD等指标过滤,提高信号质量
- 优化止盈止损策略,动态调整点位
- 提高持仓效率,结合趋势等因素,减少无效交易
- 尝试不同交易品种,选择波动率更合适的品种
总结
熊市反转哈拉米回测策略整体逻辑清晰,易于理解和优化,回测结果较好。风险可控,具有实盘调整空间。整体而言,该策略形成的交易信号较为可靠,值得进一步实盘验证与优化。
||
Overview
The Bearish Harami Reversal Backtest Strategy identifies bearish Harami reversal patterns in candlestick charts and automatically trades them. It goes short when detecting a bearish Harami pattern and closes the position when the stop loss or take profit is triggered.
Strategy Logic
The core pattern recognition indicator of this strategy is: the close of the first candle is a long bullish candle and the second candle's close is inside the first candle's body, forming a bearish candle. This indicates a potential Bearish Harami reversal pattern. When this pattern forms, the strategy goes short.
The specific logic is:
- Calculate if the body size of the first candle ABS(Close1 - Open1) is greater than the set minimum body size
- Check if the first candle is bullish Close1 > Open1
- Check if the current candle is bearish Open > Close
- Check if current candle's open is less than or equal to previous close Open <= Close1
- Check if previous candle's open is less than or equal to current candle's close Open1 <= Close
- Check if current candle's body is less than previous body Open - Close < Close1 - Open1
- If all conditions pass, a Bearish Harami has formed and the strategy goes short.
Advantage Analysis
The advantages of this strategy are:
- Utilizes the strong bearish reversal signal of Harami for higher profit probability
- Extensive backtest data results are positive
- Simple clear logic that is easy to understand and optimize
- Customizable stop loss and take profit for risk control
Risk Analysis
There are also some risks:
- Market may have false breakouts leading to losing positions. Can widen stop loss or add filters.
- High volatility may trigger stop loss prematurely. Should choose lower volatility products.
- Insufficient backtest data may not reflect real market conditions. Should increase test data size and verify in live trading.
Optimization Directions
The strategy can be further optimized in the following areas:
- Add Volume, MACD and other filters to improve signal quality
- Optimize stop loss and take profit strategies, adjust levels dynamically
- Increase position holding efficiency, combine with trend and other factors to reduce ineffective trades
- Test different trading products to find lower volatility alternatives
Conclusion
The Bearish Harami Reversal Backtest Strategy has clear, easy to understand logic, good backtest results and controllable risks. It has room for live trading adjustments and optimizations. Overall the trading signals are reliable and worth further optimizations and verification in live trading.
[/trans]
Strategy Arguments
| Argument | Default | Description |
|---|---|---|
| v_input_1 | 20 | Take Profit pip |
| v_input_2 | 10 | Stop Loss pip |
| v_input_3 | 3 | Min. Size Body pip |
Source (PineScript)
/*backtest
start: 2023-11-15 00:00:00
end: 2023-11-19 23:00:00
period: 15m
basePeriod: 5m
exchanges: [{"eid":"Futures_Binance","currency":"BTC_USDT"}]
*/

//@version=3
////////////////////////////////////////////////////////////
//  Copyright by HPotter v1.0 16/01/2019
//    This is a bearish reversal pattern formed by two candlesticks in which a short
//    real body is contained within the prior session's long real body. Usually the
//    second real body is the opposite color of the first real body. The Harami pattern
//    is the reverse of the Engulfing pattern.
//
// WARNING:
// - For purpose educate only
// - This script to change bars colors.
////////////////////////////////////////////////////////////
strategy(title = "Bearish Harami Backtest", overlay = true)
input_takeprofit = input(20, title="Take Profit pip")
input_stoploss = input(10, title="Stop Loss pip")
input_minsizebody = input(3, title="Min. Size Body pip")
barcolor(abs(close- open) >= input_minsizebody ? close[1] > open[1] ? open > close ? open <= close[1] ? open[1] <= close ? open - close < close[1] - open[1] ? yellow :na :na : na : na : na : na)
pos = 0.0
barcolor(nz(pos[1], 0) == -1 ? red: nz(pos[1], 0) == 1 ? green : blue )
posprice = 0.0
posprice := abs( close - open) >= input_minsizebody? close[1] > open[1] ? open > close ? open <= close[1] ? open[1] <= close ? open - close < close[1] - open[1] ? close :nz(posprice[1], 0) :nz(posprice[1], 0) : nz(posprice[1], 0) : nz(posprice[1], 0) : nz(posprice[1], 0): nz(posprice[1], 0)
pos := iff(posprice > 0, -1, 0)
if (pos == 0)
    strategy.close_all()
if (pos == -1)
    strategy.entry("Short", strategy.short)
posprice := iff(low <= posprice - input_takeprofit and posprice > 0, 0 ,  nz(posprice, 0))
posprice := iff(high >= posprice + input_stoploss and posprice > 0, 0 ,  nz(posprice, 0))
Detail
https://www.fmz.com/strategy/432977
Last Modified
2023-11-23 11:47:10