
10 KiB
Name
月光追踪者双三角突破策略Moonshot-Dual-Triangle-Breakout-Strategy
Author
ChaoZhang
Strategy Description
 [trans]
概述
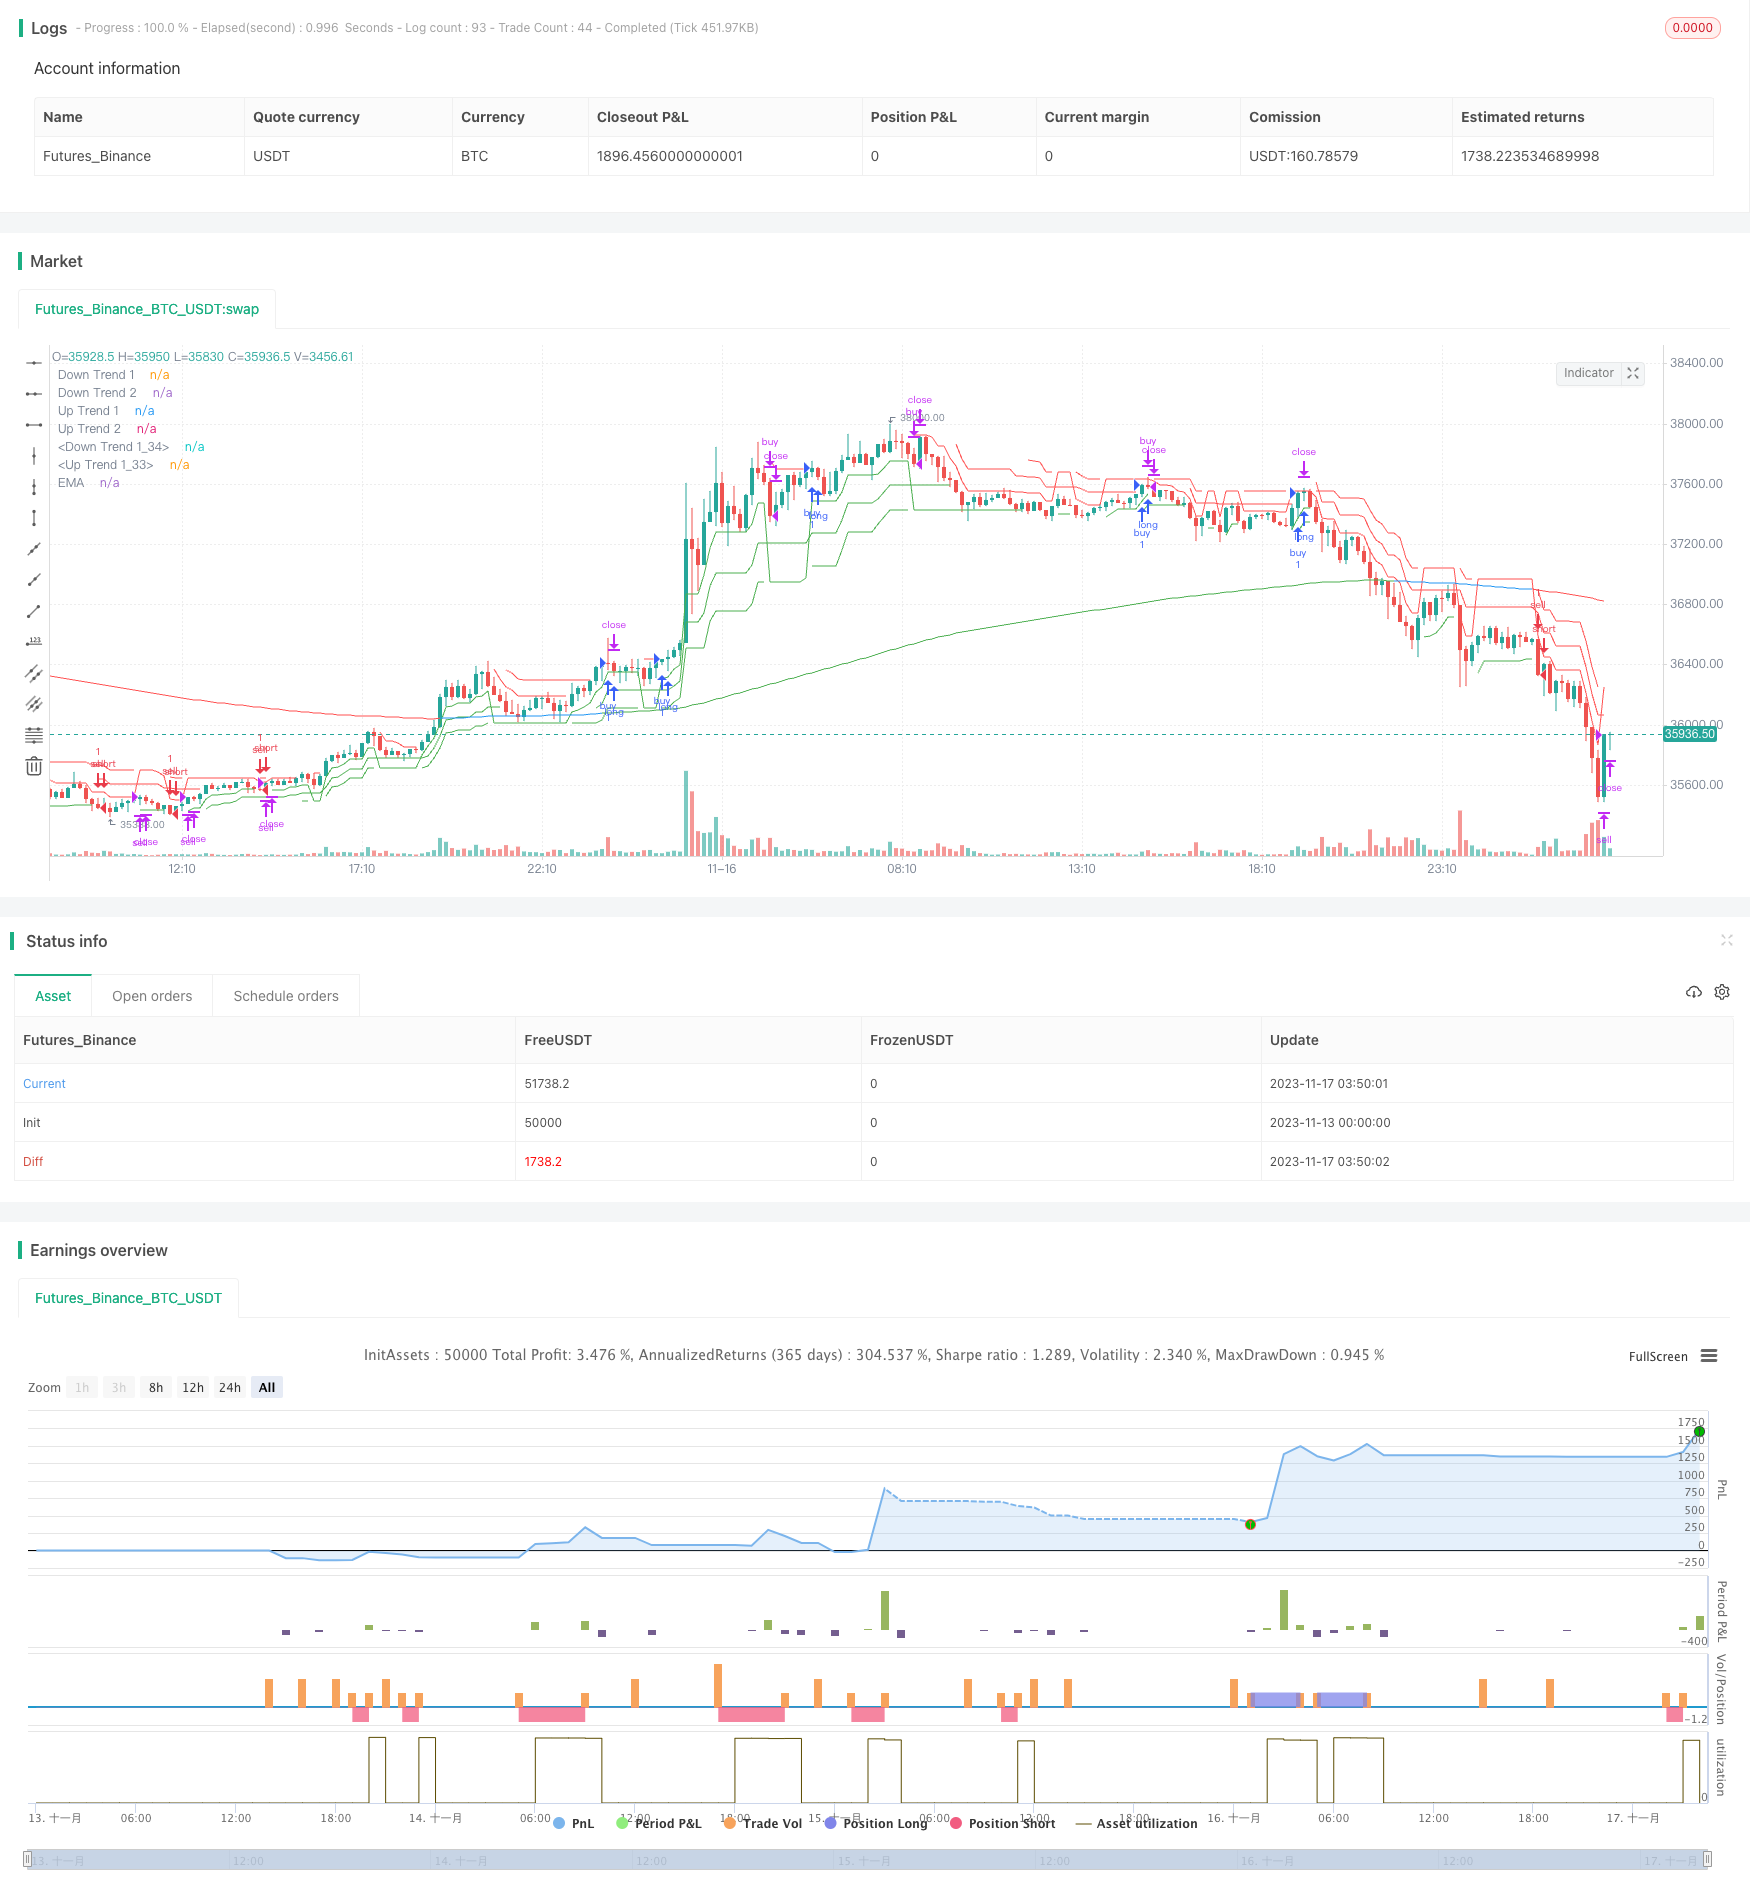
本策略通过构建双三角通道,结合超级趋势指标判断价格突破的方向,实现高胜率的追踪突破操作。该策略同时结合EMA判断市场总体趋势,避免在震荡行情中无效交易。
策略原理
-
构建三个不同参数的超级趋势指标,判断价格的短期、中期和长期趋势方向。
-
通过双三角通道判断价格是否突破上行或下行通道,作为ListEntry和Exit信号。
-
结合233周期的EMA判断总体趋势方向,价格需要在EMA多头市场突破上行通道才可做多,空头市场突破下行通道才可做空。
-
通过三个超级趋势指标结合判断止盈和止损信号。当两个以上指标变色时平仓止盈或止损。
策略优势
-
双三角通道结合多时间周期判断,可准确捕捉趋势性突破。
-
多级筛选条件可避免无效交易,提高胜率。
-
动态跟踪止盈止损,降低回撤风险。
-
简单参数设置,容易掌握使用。
策略风险及优化
-
大周期震荡市场中可能出现频繁打开头寸然后被止损的情况。可适当调整ATR周期参数降低开仓频率。
-
EMA周期过短无法判断总体趋势,过长则跟踪不灵敏。建议测试确定最优EMA参数。
-
止盈止损水平无法动态跟踪市场波动幅度变化,需要人工干预调整。后期可考虑结合ATR动态调整止盈止损距离。
总结
月光追踪者双三角突破策略通过超级趋势指标与双三角通道的结合,实现了对强势突破的精确捕捉。同时多级筛选机制可过滤无效信号,具有较高的胜率。简单的参数设置也使其易于掌握使用。通过优化助推器参数与止盈止损设计可进一步增强策略的跟踪效果与风险控制能力。
||
Overview
This strategy constructs dual triangle channels combined with Super Trend indicators to identify breakout directions for high-winrate chasing operations. It also uses EMA to determine overall market trend to avoid ineffective trades in ranging markets.
Strategy Logic
-
Build 3 Super Trends with different parameters to judge short-term, medium-term and long-term trend directions of the price.
-
Use the dual triangle channel to determine if the price breaks out the upper or lower channel as entry and exit signals.
-
Combine the 233-period EMA to determine overall trend direction. Go long when price breaks out the upper channel in an uptrend market and go short when breaking out the lower channel in a downtrend market judged by EMA.
-
Use the crossover signals of the 3 Super Trends to determine take profit and stop loss. Close positions when 2 or more indicators change color.
Advantages
-
The dual triangle channel combined with multiple timeframes can accurately capture trending breakouts.
-
Multi-layer screening avoids ineffective trades and improves win rate.
-
Dynamic trailing stop loss reduces drawdown risk.
-
Simple parameter setup makes it easy to use.
Risks & Optimization
-
Frequent position opening and stop loss in ranging markets. Adjust ATR periods to reduce trade frequency.
-
EMA period too short fails to catch the trend, too long lags the trend change. Optimize EMA parameter through backtest.
-
Static stop loss fails to adapt dynamic market volatility. Consider using ATR to trail stop levels.
Conclusion
The Moonshot Dual Triangle Breakout Strategy precisely captures strong breakouts through the combination of Super Trend and dual triangle channel. Multi-layer filters avoid bad signals and achieve high win rate. Simple parameter setup makes it easy to use. Further enhancements on ATR periods and stop loss design can improve its chasing and risk control capabilities.
[/trans]
Strategy Arguments
| Argument | Default | Description |
|---|---|---|
| v_input_1 | 10 | ATR Length 1 |
| v_input_float_1 | true | ATR Factor 1 |
| v_input_2 | 11 | ATR Length 2 |
| v_input_float_2 | 2 | ATR Factor 2 |
| v_input_3 | 12 | ATR Length 3 |
| v_input_float_3 | 3 | ATR Factor 3 |
| v_input_int_1 | 233 | Trend-EMA Length |
| v_input_4_close | 0 | Source: close |
| v_input_int_2 | false | Offset |
| v_input_float_4 | true | Long Stop Loss (%) |
| v_input_float_5 | true | Short Stop Loss (%) |
Source (PineScript)
/*backtest
start: 2023-11-13 00:00:00
end: 2023-11-17 04:00:00
period: 10m
basePeriod: 1m
exchanges: [{"eid":"Futures_Binance","currency":"BTC_USDT"}]
*/

// @version=5
// author=theasgard and moonshot-indicator (ms)
// year 2021
//
// This is a well knowen strategy by using 3 different Supertrends and a trend-defining EMA,
// feel free to play around with the settings, a backtest on 8h ETHUSDT pair brought some good results using
// the 233EMA and investing 75% of a 10k start capital
//
// the idea is to have at least 2 supertrnds going green above the trend-EMA to go long and exit by turning
// 2 supertrends red (idea: 1 supertrend in red could initialize a take profit)
// shorts work vice versa
// The EMA shows in green for uptrends and in red for downtrends, if it is blue no Signal will be taken because
// the 3 supertrends are not all above or below the trendline(EMA)

strategy("ms hypertrender", overlay=true)

// set up 3 supertrendlines and colour the direction up/down
atrPeriod1 = input(10, "ATR Length 1")
factor1 = input.float(1.0, "ATR Factor 1", step = 0.01)
[supertrend1, direction1] = ta.supertrend(factor1, atrPeriod1)
upTrend1 = plot(direction1 < 0 ? supertrend1 : na, "Up Trend 1", color = color.green, style=plot.style_linebr)
downTrend1 = plot(direction1 < 0? na : supertrend1, "Down Trend 1", color = color.red, style=plot.style_linebr)

atrPeriod2 = input(11, "ATR Length 2")
factor2 = input.float(2.0, "ATR Factor 2", step = 0.01)
[supertrend2, direction2] = ta.supertrend(factor2, atrPeriod2)
upTrend2 = plot(direction2 < 0 ? supertrend2 : na, "Up Trend 2", color = color.green, style=plot.style_linebr)
downTrend2 = plot(direction2 < 0? na : supertrend2, "Down Trend 2", color = color.red, style=plot.style_linebr)

atrPeriod3 = input(12, "ATR Length 3")
factor3 = input.float(3.0, "ATR Factor 3", step = 0.01)
[supertrend3, direction3] = ta.supertrend(factor3, atrPeriod3)
upTrend3 = plot(direction3 < 0 ? supertrend3 : na, "Up Trend 1", color = color.green, style=plot.style_linebr)
downTrend3 = plot(direction3 < 0? na : supertrend3, "Down Trend 1", color = color.red, style=plot.style_linebr)

//set up the trend dividing EMA and color uptrend nutreal downtrend
len = input.int(233, minval=1, title="Trend-EMA Length")
src = input(close, title="Source")
offset = input.int(title="Offset", defval=0, minval=-500, maxval=500)

//general Bull or Bear Trend? Visualized by ema
ematrend = ta.ema(src, len)
generaluptrend = supertrend1 > ematrend and supertrend2 > ematrend and supertrend3 > ematrend
generaldowntrend = supertrend1 < ematrend and supertrend2 < ematrend and supertrend3 < ematrend
emacolor = if generaluptrend
    color.green
else if generaldowntrend
    color.red
else
    color.blue
plot(ematrend, title="EMA", color=emacolor, offset=offset)

// Bullish? min 2 supertrends green
bullish = (direction1 < 0 and direction2 < 0) or (direction1 < 0 and direction3 < 0) or (direction2 < 0 and direction3 < 0) and generaluptrend
extremebullish = direction1 < 0 and direction2 < 0 and direction3 < 0 and generaluptrend //all 3 green

// Bearish? min 2 supertrends red
bearish = (direction1 > 0 and direction2 > 0) or (direction1 > 0 and direction3 > 0) or (direction2 > 0 and direction3 > 0) and generaldowntrend
extremebearish = direction1 > 0 and direction2 > 0 and direction3 > 0 and generaldowntrend //all 3 red

// Open Long
//plotchar(((bullish and not bullish[1]) or (extremebullish and not extremebullish[1])) and (emacolor==color.green)? close : na, title = 'Start Long', char='▲', color = #80eb34, location = location.belowbar, size = size.small)

// TP 10% Long
TP10long = ((generaluptrend and bullish[1]) or (generaluptrend and extremebullish[1])) and (direction1 > 0 or direction2 > 0 or direction3 > 0)
//plotchar(TP10long and not TP10long[1]? close : na, title = 'TP on Long', char='┼', color = #ffd000, location = location.abovebar, size = size.tiny)

// Exit Long
//plotchar(extremebearish and not extremebearish[1] or bearish and not bearish[1]? close : na, title = 'Close all Longs', char='Ꭓ', color = #ff0037, location = location.abovebar, size = size.tiny)

// Open Short
//plotchar(((bearish and not bearish[1]) or (extremebearish and not extremebearish[1])) and (emacolor==color.red)? close : na, title = 'Start Short', char='▼', color = #0547e3, location = location.abovebar, size = size.small)

// TP 10% Short
TP10short = ((generaldowntrend and bearish[1]) or (generaldowntrend and extremebearish[1])) and (direction1 < 0 or direction2 < 0 or direction3 < 0)
//plotchar(TP10short and not TP10short[1]? close : na, title = 'TP on Short', char='┼', color = #ffd000, location = location.belowbar, size = size.tiny)

// Exit Short
//plotchar(extremebullish and not extremebullish[1] or bullish and not bullish[1]? close : na, title = 'Close all Shorts', char='Ꭓ', color = #ff0037, location = location.belowbar, size = size.tiny)

// Set stop loss level with input options (optional)
longLossPerc = input.float(title="Long Stop Loss (%)",
     minval=0.0, step=0.1, defval=1) * 0.01

shortLossPerc = input.float(title="Short Stop Loss (%)",
     minval=0.0, step=0.1, defval=1) * 0.01

// Determine stop loss price
longStopPrice  = strategy.position_avg_price * (1 - longLossPerc)
shortStopPrice = strategy.position_avg_price * (1 + shortLossPerc)

openlong = (((bullish and not bullish[1]) or (extremebullish and not extremebullish[1])) and (emacolor==color.green))
openshort = (((bearish and not bearish[1]) or (extremebearish and not extremebearish[1])) and (emacolor==color.red))
exitlong = (extremebearish and not extremebearish[1] or bearish and not bearish[1]) or TP10long
exitshort = (extremebullish and not extremebullish[1] or bullish and not bullish[1]) or TP10short
strategy.entry("buy", strategy.long, when=openlong)
strategy.entry("sell", strategy.short, when=openshort)

strategy.close("buy", when=exitlong)
strategy.close("sell", when=exitshort)

// Submit exit orders based on calculated stop loss price
if (strategy.position_size > 0)
    strategy.exit(id="Long Stop", stop=longStopPrice)

if (strategy.position_size < 0)
    strategy.exit(id="Short Stop", stop=shortStopPrice)
Detail
https://www.fmz.com/strategy/432776
Last Modified
2023-11-21 13:49:10