
10 KiB
Name
最低点反转策略Bottom-Reversal-Strategy
Author
ChaoZhang
Strategy Description
 [trans]
概述
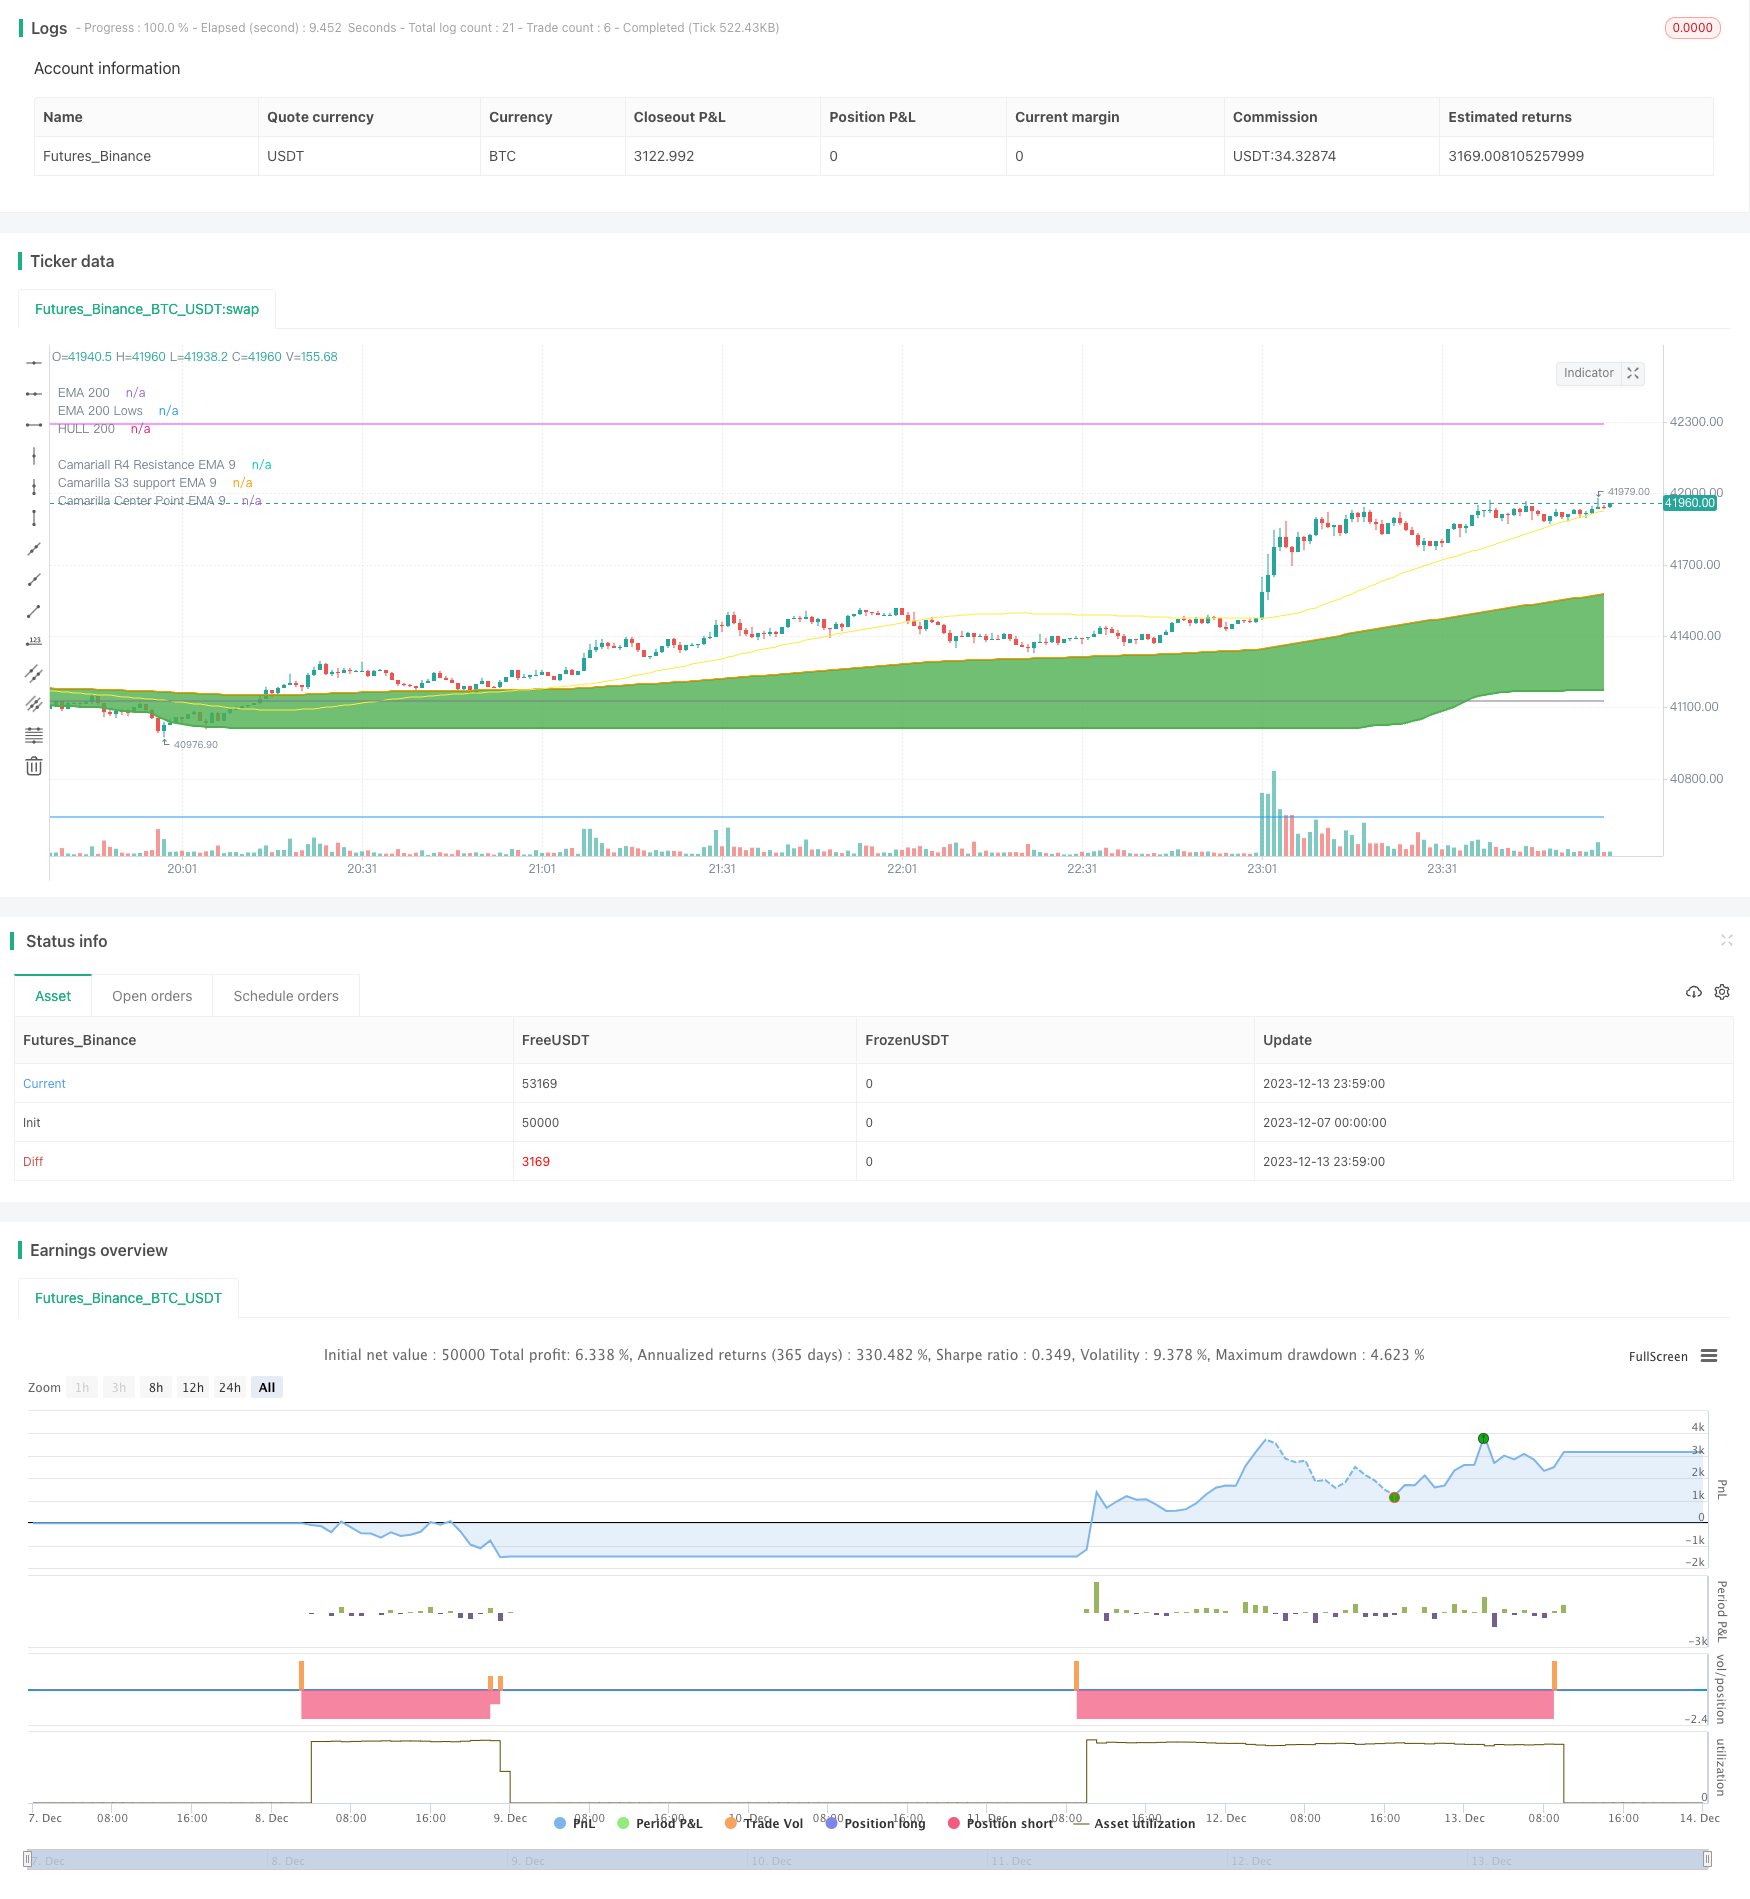
该策略是基于市场最低点进行反转操作的策略。它利用200日EMA的最低点,结合卡马列拉支撑阻力位判断市场最低点,当价格反弹时进行做多操作。
策略原理
- 计算200日EMA的最低价EMA200Lows,当价格关闭低于该EMA时,认为处于市场最低点附近。
- 计算卡马列拉支撑3(S3)的9日EMA即ema_s3_9,作为重要的支撑位。
- 再计算卡马列拉中枢的9日EMA即ema_center_9,作为判断反转的信号。
- 当ema_center_9上穿ema200Lows时,并且前3根K线都低于ema200Lows时,进行做多操作。
- 止损方式为ATR止损,并追踪最低价移动。
- 目标利润为ema_h4_9(卡马列拉阻力4)和ema_s3_9(卡马列拉支撑3)。
优势分析
- 使用200日EMA最低点判断市场最低区域,避免在中途出现更低点。
- 卡马列拉支撑位与中枢结合,可以更准确判断反转点。
- ATR止损方式让止损更合理,追踪更低点有利锁定更大利润。
风险分析
- 长期持仓风险大。本策略更适合短线操作。
- 大行情下,止损可能较大。可根据ATR参数调整。
- 卡马列拉反转判断不一定百分百可靠,可能出现误判。
优化方向
- 可以考虑结合其他指标,如RSI等判断反转信号。
- 可以研究不同品种参数调整,寻找更优参数。
- 可以尝试机器学习方法动态调整ATR 止损。
总结
该策略利用EMA最低点与卡马列拉指标判断市场最低区域与反转点。通过ATR止损获取利润。整体来说,策略较完整,有一定的实战价值。后期通过进一步优化,可以使策略更加稳定可靠。
||
Overview
This strategy is based on market bottoms for reversal trading. It uses the lowest points of the 200-day EMA combined with Camarilla support/resistance levels to determine market bottoms. It goes long when prices bounce back.
Strategy Logic
- Calculate the lowest price EMA200Lows of the 200-day EMA. When prices close below this EMA, the market is considered near the bottom.
- Calculate the 9-day EMA of Camarilla support level 3 (S3), ema_s3_9, as an important support level.
- Also calculate the 9-day EMA of the Camarilla midpoint ema_center_9 as the signal for reversal.
- When ema_center_9 crosses over ema200Lows, and the last 3 bars are lower than ema200Lows, go long.
- Use ATR trailing stop loss to lock profit, tracking the lowest price.
- Profit targets are ema_h4_9 (Camarilla Resistance Level 4) and ema_s3_9.
Advantage Analysis
- The 200-day EMA lowest price avoids taking positions before the actual bottom.
- Camarilla levels combined with the midpoint identifies reversals reliably.
- ATR stop loss is more reasonable. Tracking lower prices allows bigger profit.
Risk Analysis
- Long holding periods increase risk. This strategy favors short-term trading.
- Large market moves can result in big stop loss. Adjust ATR parameters accordingly.
- Camarilla reversal signals are not always accurate. Expect some whipsaws.
Optimization Directions
- Consider adding indicators like RSI to supplement reversal signals.
- Research optimal parameters for different products.
- Explore machine learning for dynamic ATR stop loss.
Summary
This strategy identifies market bottoms and reversals using EMA lows and Camarilla levels. It locks in profits with ATR trailing stops. Overall it is fairly complete with practical value. Further optimizations will improve robustness.
[/trans]
Strategy Arguments
| Argument | Default | Description |
|---|---|---|
| v_input_1 | 200 | EMA 1 Length |
| v_input_2 | 50 | EMA 2 Length |
| v_input_3 | 20 | EMA 3 Length |
| v_input_4_hlc3 | 0 | Source for Highs: hlc3 |
| v_input_5_hlc3 | 0 | Source for Lows: hlc3 |
| v_input_6 | 7 | HiLo Band Length |
| v_input_7 | 14 | ATR Length |
| v_input_8 | 3.5 | ATR Multiplier |
| v_input_9 | 0 | Pivot Resolution: D |
Source (PineScript)
/*backtest
start: 2023-12-07 00:00:00
end: 2023-12-14 00:00:00
period: 1m
basePeriod: 1m
exchanges: [{"eid":"Futures_Binance","currency":"BTC_USDT"}]
*/

// This source code is subject to the terms of the Mozilla Public License 2.0 at https://mozilla.org/MPL/2.0/
// © mohanee

//Using the lowest of low of ema200, you can find the bottom
//wait for price to close below ema200Lows line
//when pivot

//@version=4
strategy(title="PickingupFromBottom Strategy", overlay=true )  //default_qty_value=10, default_qty_type=strategy.fixed,

//HMA
HMA(src1, length1) =>  wma(2 * wma(src1, length1/2) - wma(src1, length1), round(sqrt(length1)))


//variables BEGIN
length1=input(200,title="EMA 1 Length")
length2=input(50,title="EMA 2 Length")
length3=input(20,title="EMA 3 Length")

sourceForHighs= input(hlc3, title="Source for Highs", type=input.source)
sourceForLows = input(hlc3, title="Source for Lows" , type=input.source)

hiLoLength=input(7, title="HiLo Band Length")

atrLength=input(14, title="ATR Length")
atrMultiplier=input(3.5, title="ATR Multiplier")

//takePartialProfits = input(true, title="Take Partial Profits (if this selected, RSI 13 higher reading over 80 is considered for partial closing ) ")


ema200=ema(close,length1)
hma200=HMA(close,length1)


////Camarilla pivot points
//study(title="Camarilla Pivots", shorttitle="Camarilla", overlay=true)
t = input(title = "Pivot Resolution", defval="D", options=["D","W","M"])

//Get previous day/week bar and avoiding realtime calculation by taking the previous to current bar
sopen = security(syminfo.tickerid, t, open[1], barmerge.gaps_off, barmerge.lookahead_on)
shigh = security(syminfo.tickerid, t, high[1], barmerge.gaps_off, barmerge.lookahead_on)
slow = security(syminfo.tickerid, t, low[1], barmerge.gaps_off, barmerge.lookahead_on)
sclose = security(syminfo.tickerid, t, close[1], barmerge.gaps_off, barmerge.lookahead_on)
r = shigh-slow

//Calculate pivots
//center=(sclose)
//center=(close[1] + high[1] + low[1])/3
center=sclose - r*(0.618)

h1=sclose + r*(1.1/12)
h2=sclose + r*(1.1/6)
h3=sclose + r*(1.1/4)
h4=sclose + r*(1.1/2)
h5=(shigh/slow)*sclose
l1=sclose - r*(1.1/12)
l2=sclose - r*(1.1/6)
l3=sclose - r*(1.1/4)
l4=sclose - r*(1.1/2)
l5=sclose - (h5-sclose)

//Colors (<ternary conditional operator> expression prevents continuous lines on history)
c5=sopen != sopen[1] ? na : color.red
c4=sopen != sopen[1] ? na : color.purple
c3=sopen != sopen[1] ? na : color.fuchsia
c2=sopen != sopen[1] ? na : color.blue
c1=sopen != sopen[1] ? na : color.gray
cc=sopen != sopen[1] ? na : color.blue

//Plotting
//plot(center, title="Central",color=color.blue, linewidth=2)
//plot(h5, title="H5",color=c5, linewidth=1)
//plot(h4, title="H4",color=c4, linewidth=2)
//plot(h3, title="H3",color=c3, linewidth=1)
//plot(h2, title="H2",color=c2, linewidth=1)
//plot(h1, title="H1",color=c1, linewidth=1)
//plot(l1, title="L1",color=c1, linewidth=1)
//plot(l2, title="L2",color=c2, linewidth=1)
//plot(l3, title="L3",color=c3, linewidth=1)
//plot(l4, title="L4",color=c4, linewidth=2)
//plot(l5, title="L5",color=c5, linewidth=1)////Camarilla pivot points

ema_s3_9=ema(l3, 9)
ema_s3_50=ema(l3, 50)
ema_h4_9=ema(h4, 9)

ema_center_9=ema(center, 9)


plot(ema_h4_9, title="Camariall R4 Resistance EMA 9", color=color.fuchsia)
plot(ema_s3_9, title="Camarilla S3 support EMA 9", color=color.gray, linewidth=1)

//plot(ema_s3_50, title="Camarilla S3 support EMA 50", color=color.green, linewidth=2)

plot(ema_center_9, title="Camarilla Center Point EMA 9", color=color.blue)


plot(hma200, title="HULL 200", color=color.yellow,  transp=25)
plotEma200=plot(ema200, title="EMA 200",  style=plot.style_linebr, linewidth=2 , color=color.orange)

ema200High = ema(highest(sourceForHighs,length1), hiLoLength)
ema200Low= ema(lowest(sourceForLows,length1), hiLoLength)

ema50High = ema(highest(sourceForHighs,length2), hiLoLength)
ema50Low= ema(lowest(sourceForLows,length2), hiLoLength)

ema20High = ema(highest(sourceForHighs,length3), hiLoLength)
ema20Low= ema(lowest(sourceForLows,length3), hiLoLength)

//plot(ema200High, title="EMA 200 Highs", linewidth=2, color=color.orange, transp=30)
plotEma200Low=plot(ema200Low, title="EMA 200 Lows", linewidth=2, color=color.green, transp=30, style=plot.style_linebr)

//plot(ema50High, title="EMA 50 Highs", linewidth=2, color=color.blue, transp=30)
//plotEma50Low=plot(ema50Low, title="EMA 50 Lows", linewidth=2, color=color.blue, transp=30)


fill(plotEma200, plotEma200Low, color=color.green )


// Drawings /////////////////////////////////////////


//Highlight when centerpont crossing up ema200Low a
ema200LowBuyColor=color.new(color.green, transp=50)
bgcolor(crossover(ema_center_9,ema200Low) and (close[1]<ema200Low or close[2]<ema200Low or close[3]<ema200Low)? ema200LowBuyColor : na)
//ema200LowBuyCondition= (close[1]<ema200Low or close[2]<ema200Low or close[3]<ema200Low)
strategy.entry(id="ema200Low Buy", comment="LE2", qty=2, long=true,  when= crossover(ema_center_9,ema200Low) and (close[1]<ema200Low or close[2]<ema200Low or close[3]<ema200Low) )  //or (close>open and low<ema20Low and close>ema20Low) ) )     //  // aroonOsc<0


//Trailing StopLoss
////// Calculate trailing SL
/////////////////////////////////////////////////////
sl_val = atrMultiplier * atr(atrLength)


trailing_sl = 0.0
//trailing_sl :=   max(low[1]  - sl_val, nz(trailing_sl[1]))
trailing_sl :=   strategy.position_size>=1 ?  max(low  - sl_val, nz(trailing_sl[1])) :  na

//draw initil stop loss
//plot(strategy.position_size>=1 ? trailing_sl : na, color = color.blue , style=plot.style_linebr,  linewidth = 2, title = "stop loss")
plot(trailing_sl, title="ATR Trailing Stop Loss", style=plot.style_linebr, linewidth=1, color=color.red, transp=30)
//Trailing StopLoss
////// Calculate trailing SL
/////////////////////////////////////////////////////


strategy.close(id="ema200Low Buy", comment="TP1="+tostring(close - strategy.position_avg_price, "####.##"), qty=1, when=abs(strategy.position_size)>=1 and crossunder(close, ema_h4_9)  )  //close<ema55 and rsi5Val<20 //ema34<ema55  //close<ema89
strategy.close(id="ema200Low Buy", comment="TP2="+tostring(close - strategy.position_avg_price, "####.##"),  qty=1, when=abs(strategy.position_size)>=1 and crossunder(close, ema_s3_9)  )  //close<ema55 and rsi5Val<20 //ema34<ema55  //close<ema89
Detail
https://www.fmz.com/strategy/435473
Last Modified
2023-12-15 11:07:41