
7.1 KiB
Name
方差反转交易策略Variance-Reversion-Trading-Strategy
Author
ChaoZhang
Strategy Description
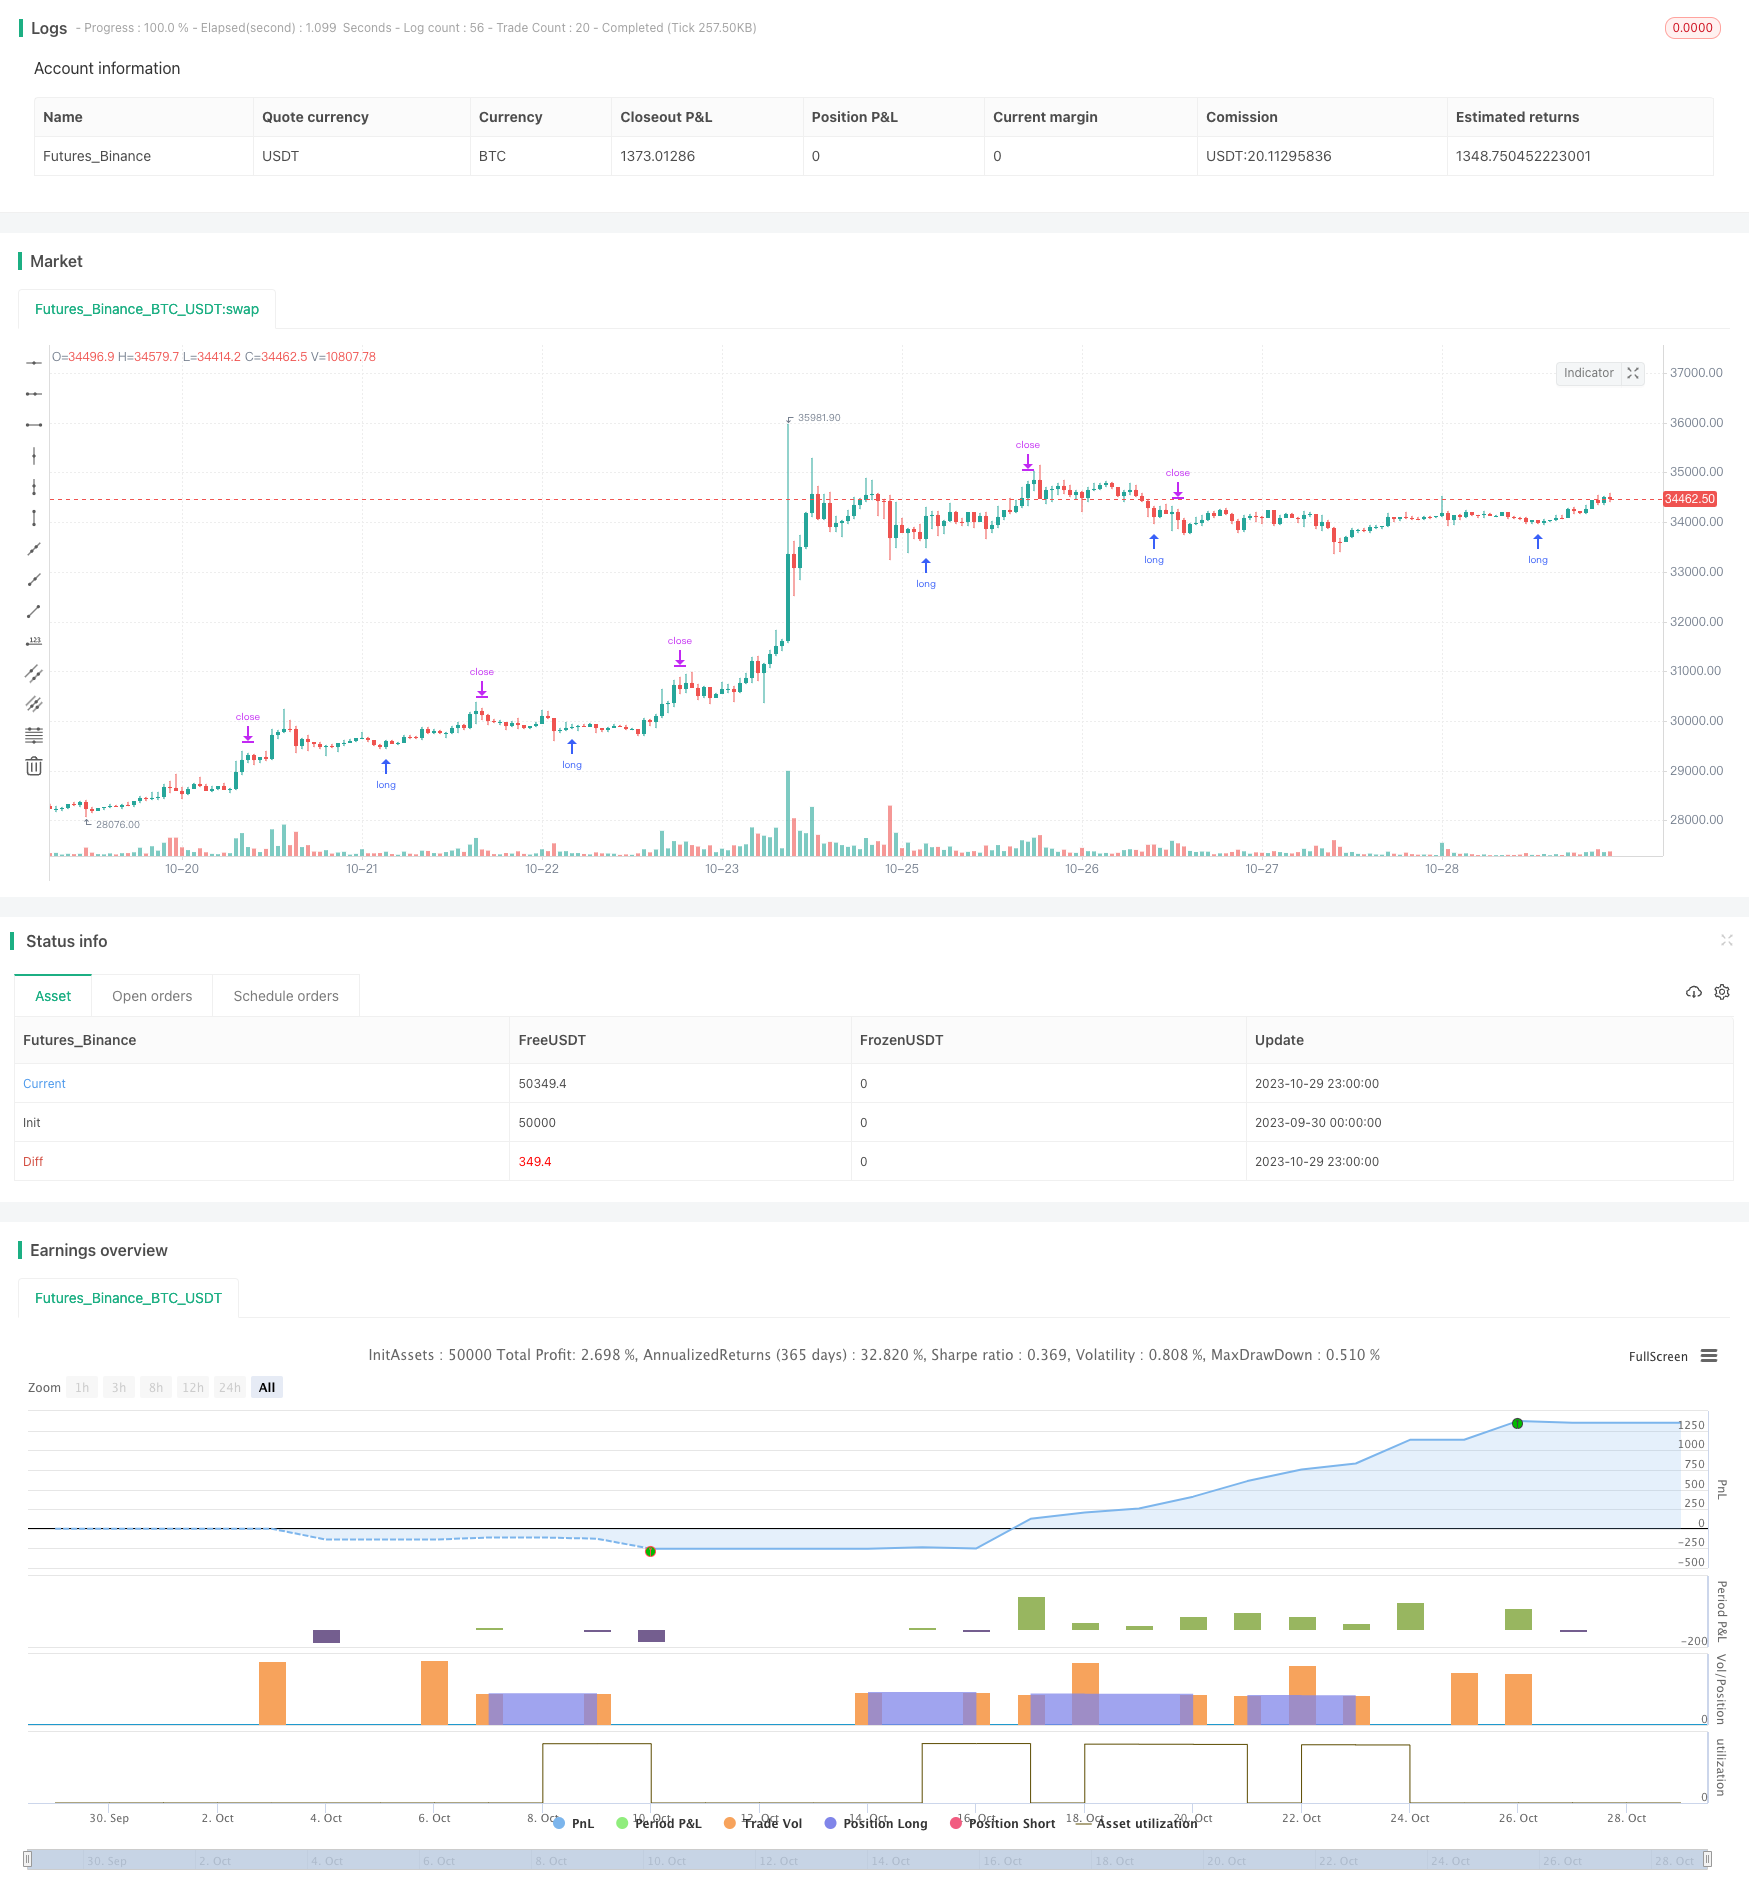 [trans]
概述
方差反转交易策略通过计算认购看涨期权和认沽看跌期权的比率,也称做看涨期权 和看跌期权比率,当该比率出现反转时产生交易信号。该策略结合简单的资金管理规则来实现盈利。它适用于NDX和SPX的30分钟周期。振荡指标需要调整以反映正确的反转点。通过良好的回测结果可以判断出正确的反转点。
策略原理
该策略的核心指标是看涨看跌期权比率的均线及其标准差。首先计算过去20天的看涨看跌期权比率的均值,然后计算过去30天该比率的标准差。当比率上穿比率均值加1.5倍标准差时,做多;当比率下穿比率均值减1.5倍标准差时,做空。
做多后,如果比率重新回落到均值以上时,平掉做空仓位。止损线设置为开仓价格的1%。止盈线设置为开仓价格的3倍止损距离。
优势分析
该策略最大的优势在于捕捉市场情绪的反转点。当市场过度悲观或过度看多时,看涨看跌期权比率会出现反常态,这时做反向操作就能捕捉到局部反转的机会。另外,资金管理规则设置了止损和止盈距离,可以有效控制单笔交易的风险和收益。
风险分析
该策略的主要风险在于参数设置问题。如果参数设置不当,会导致交易信号过于频繁,从而无法捕捉到较大幅度的反转机会。另外,反转信号可能会被假突破,导致亏损。建议优化参数,使信号更稳定可靠。
优化方向
可以考虑结合其他指标来验证反转信号,防止被假突破误导。例如可以加入成交量指标,只有成交量放大的时候才考虑反转信号。也可以加入一些趋势指标,避免逆势操作。可以测试不同市场不同时间周期下的参数设置。总之,综合更多因素来设定交易策略,会使结果更可靠。
总结
该策略通过计算看涨看跌期权比率并结合简单的资金管理原则,试图捕捉市场反转点。它的优势在于能抓住局部反转的机会,但也存在被假突破误导的风险。通过优化参数设置、加入更多验证指标等方式,可以提高策略的稳定性和盈利能力。总体来说,该策略提供了一种利用市场情绪判断反转点的思路,但需要进一步测试和优化,才能在实盘中应用。
||
Overview
The Variance Reversion trading strategy generates trading signals by calculating the ratio between call and put options, also known as the call put ratio. When the ratio reverses, it triggers trades combined with simple money management rules to realize profits. It is suitable for 30-minute periods of NDX and SPX. The oscillation needs to be fine-tuned to reflect the correct reversal point. Solid backtesting results indicate the optimal reversal point.
Strategy Logic
The core metrics of this strategy are the moving average and standard deviation of the call/put ratio. It first calculates the 20-day moving average of the call/put ratio, then computes the 30-day standard deviation of the ratio. A long signal triggers when the ratio crosses above the moving average plus 1.5 standard deviation. A short signal triggers when the ratio falls below the moving average minus 1.5 standard deviation.
After going long, if the ratio rebounds back above the moving average, close out the short position. The stop loss is set at 1% below the entry price. Take profit is set at 3 times the stop loss distance from the entry price.
Advantage Analysis
The biggest edge of this strategy is capturing sentiment reversal points when the market becomes overly pessimistic or bullish, causing anomalies in the call/put ratio. Trading against such anomalies can profit from local reversals. The money management rules effectively limit the risk and reward of individual trades.
Risk Analysis
The major risk comes from improper parameter tuning. Overly frequent signals fail to capture significant reversals. Reversal signals may also be faked out by false breakouts, causing losses. Parameters should be optimized for more reliable signals.
Optimization
Consider adding filters to confirm reversal signals and avoid false breakouts. For example, only consider signals when volume amplifies. Trend filters could also avoid countertrend trades. Optimal parameters likely vary across different markets and time frames. Integrating more factors will make the strategy more robust.
Conclusion
This strategy aims to capture market reversal points by using the call/put ratio with basic money management rules. It can profit from local reversals but faces false breakout risks. Optimizing parameters, adding filters and integrating more factors can enhance its stability and profitability. Overall, it provides a direction to trade reversals based on market sentiment. Further testing and optimization is needed for real-world application.
[/trans]
Strategy Arguments
| Argument | Default | Description |
|---|---|---|
| v_input_float_1 | 0.01 | SL |
| v_input_float_2 | 3 | CRV |
| v_input_int_1 | 30 | Lookback period in Days |
| v_input_int_2 | 20 | ratio_sma_lookback_len |
| v_input_float_3 | 1.5 | Standard Deviation Multiple |
Source (PineScript)
/*backtest
start: 2023-09-30 00:00:00
end: 2023-10-30 00:00:00
period: 1h
basePeriod: 15m
exchanges: [{"eid":"Futures_Binance","currency":"BTC_USDT"}]
*/

// This source code is subject to the terms of the Mozilla Public License 2.0 at https://mozilla.org/MPL/2.0/
// © I11L

//@version=5
strategy("I11L Long Put/Call Ratio Inversion", overlay=false, pyramiding=1, default_qty_value=10000, initial_capital=10000, default_qty_type=strategy.cash)

SL = input.float(0.01,step=0.01)
CRV = input.float(3)
TP = SL * CRV

len = input.int(30,"Lookback period in Days",step=10)
ratio_sma_lookback_len = input.int(20,step=10)
mult = input.float(1.5,"Standard Deviation Multiple")

ratio_sma = ta.sma(request.security("USI:PCC","D",close),ratio_sma_lookback_len)

median = ta.sma(ratio_sma,len)
standartDeviation = ta.stdev(ratio_sma,len)
upperDeviation = median + mult*standartDeviation
lowerDeviation = median - mult*standartDeviation


isBuy = ta.crossunder(ratio_sma, upperDeviation)// and close < buyZone
isCloseShort = (ratio_sma > median and strategy.position_size < 0)
isSL = (strategy.position_avg_price * (1.0 - SL) > low and strategy.position_size > 0) or (strategy.position_avg_price * (1.0 + SL) < high and strategy.position_size < 0)
isSell = ta.crossover(ratio_sma,lowerDeviation)
isTP = strategy.position_avg_price * (1 + TP) < high

if(isBuy)
    strategy.entry("Long", strategy.long)

if(isCloseShort)
    strategy.exit("Close Short",limit=close)

if(isSL)
    strategy.exit("SL",limit=close)

if(isTP)
    strategy.exit("TP",limit=close)

plot(ratio_sma,color=color.white)
plot(median,color=color.gray)
plot(upperDeviation,color=color.rgb(0,255,0,0))
plot(lowerDeviation,color=color.rgb(255,0,0,0))

bgcolor(isBuy?color.rgb(0,255,0,90):na)
bgcolor(isSell?color.rgb(255,0,0,90):na)
Detail
https://www.fmz.com/strategy/430668
Last Modified
2023-10-31 14:42:13