
9.8 KiB
Name
指标驱动型止损止盈策略An-Indicator-Driven-Stop-Loss-and-Take-Profit-Strategy
Author
ChaoZhang
Strategy Description
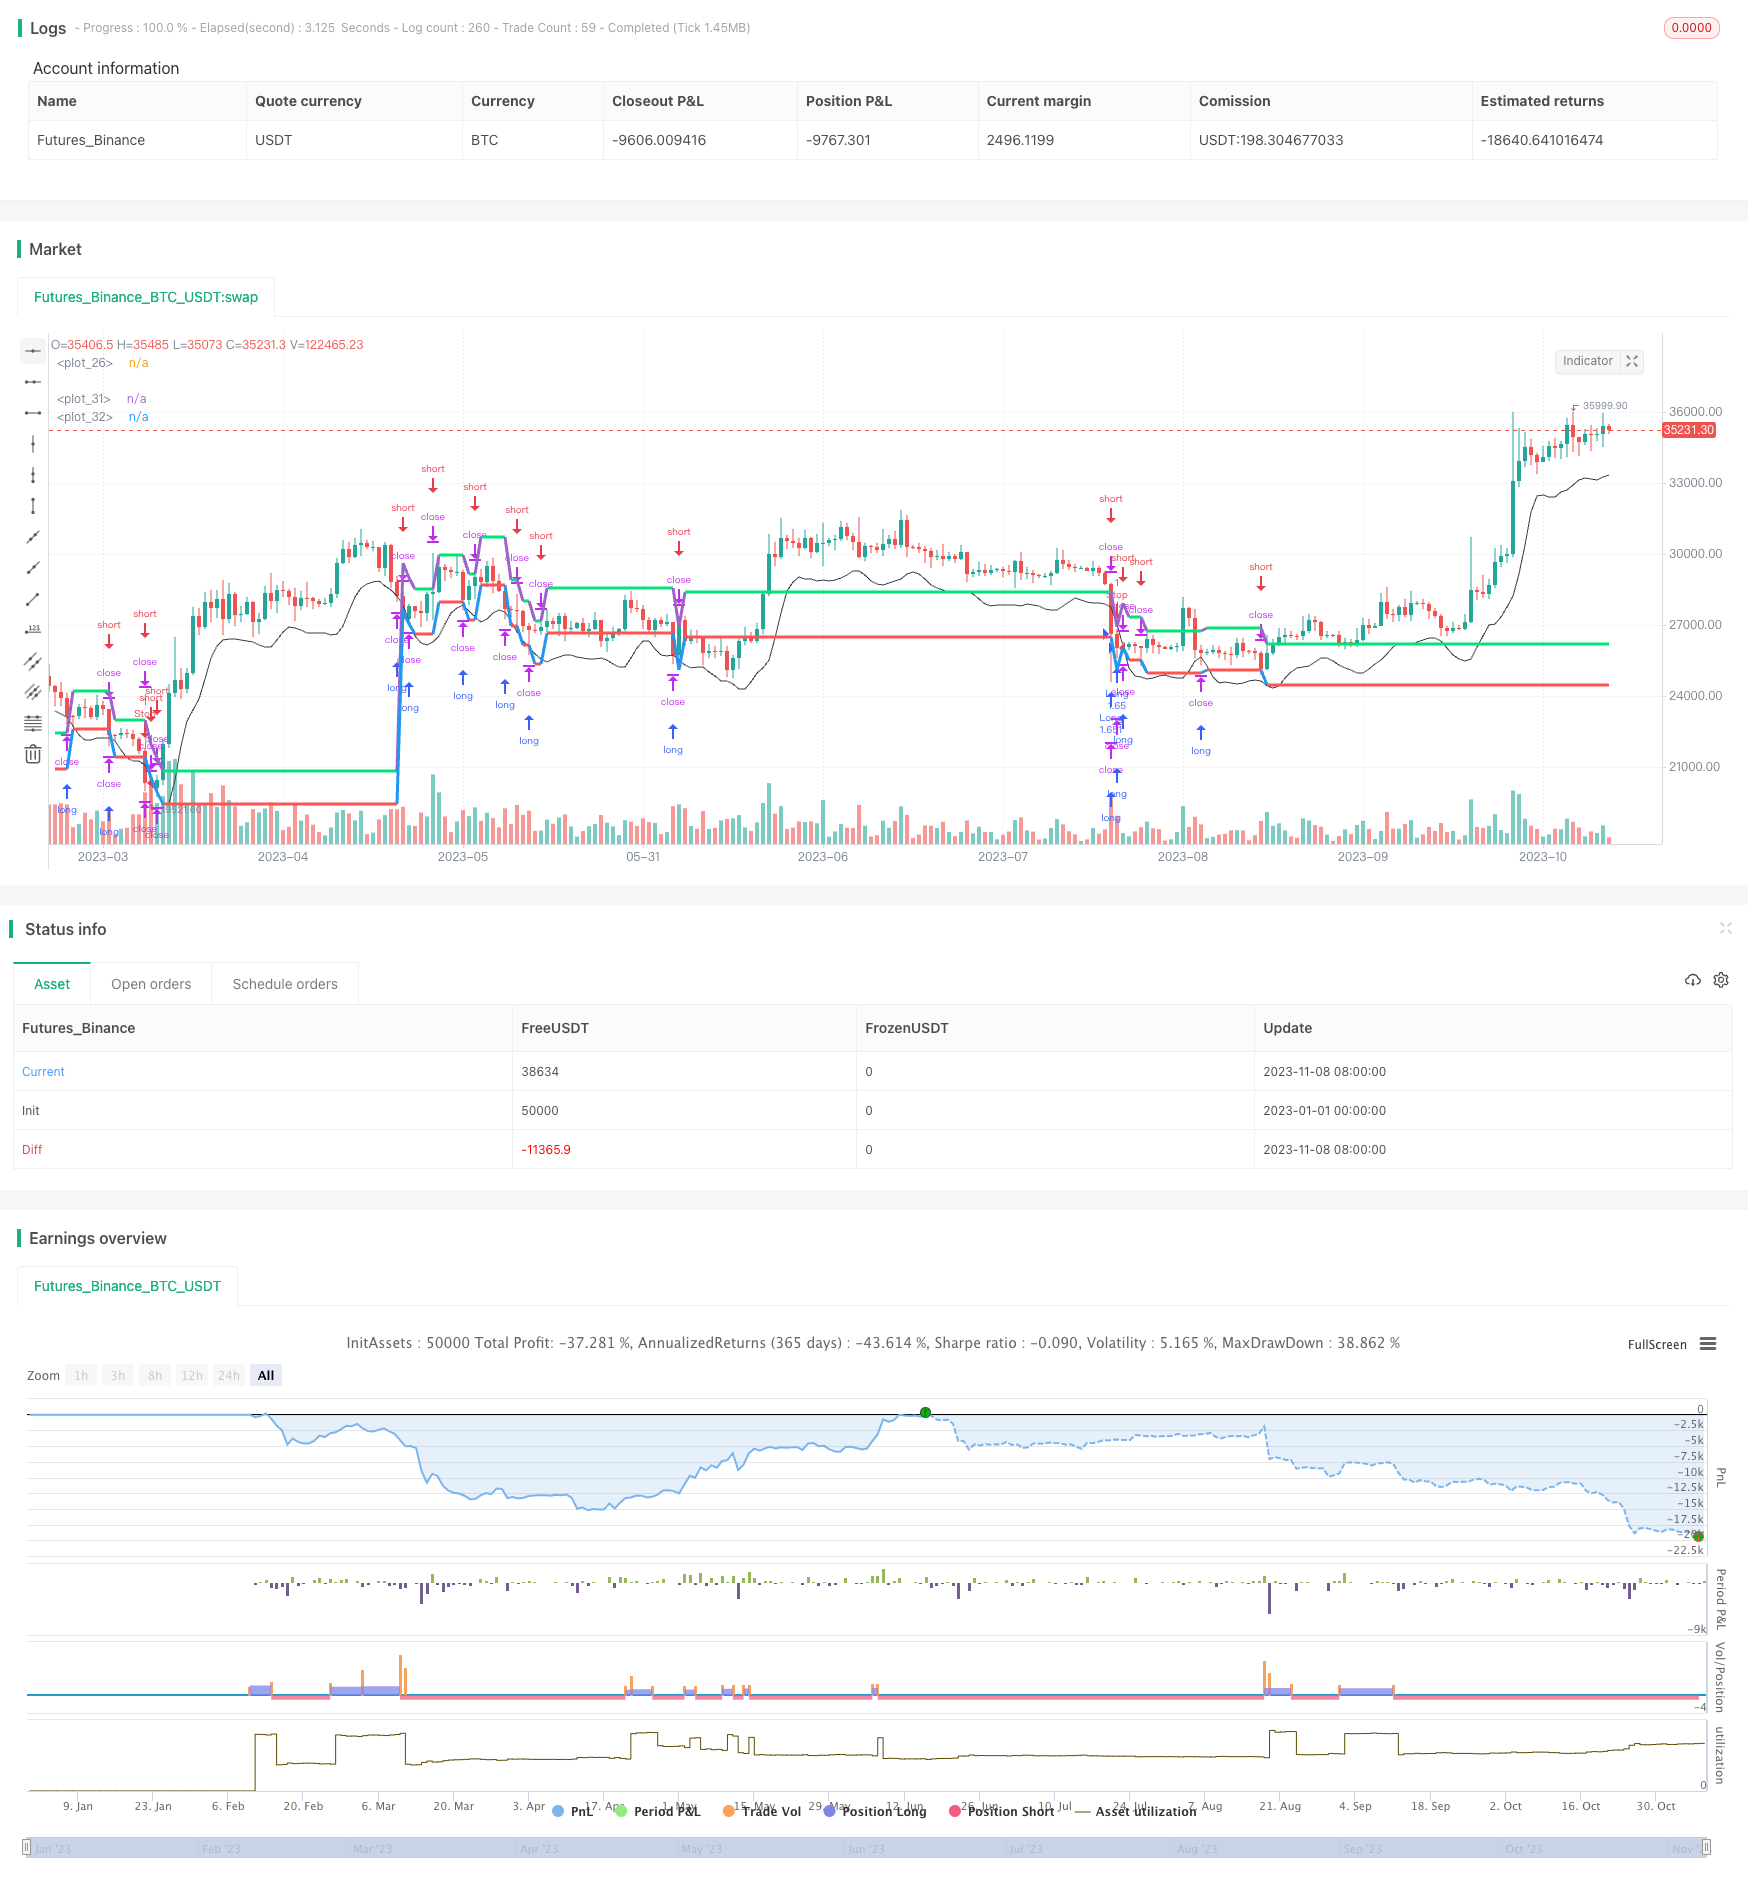
[trans]
概述
本策略利用移动平均线作为交易信号,结合用户自定义的止损止盈比例,实现了一个完整的指标驱动型的止损止盈策略。该策略可以自动进行入场、止损、止盈,无需人工干预,适合自动交易。
策略原理
本策略的核心逻辑是:
-
使用3周期的SMA作为交易信号,当SMA上穿0时做多,SMA下穿0时做空;
-
入场后,用户可以自定义止损比例和止盈比例;
-
根据入场价格和用户设置的止损比例,自动设置止损线;
-
根据入场价格和用户设置的止盈比例,自动设置止盈线;
-
当价格触碰止损线时,自动止损;当价格触碰止盈线时,自动止盈;
-
平仓后,自动撤销止损止盈订单。
具体来说,策略通过sma函数计算3周期的移动平均线,并将其值赋给ma变量。
接着计算多头入场线long,其值为ma加上ma的百分之lo。lo是用户可调参数,代表做多时的入场线偏移量。
当ma上穿0时,表示开始做多,通过strategy.entry函数入场做多,入场价格为long。
同时,设定止损和止盈价格。止损价格为入场价格减去入场价格的sl%。sl是用户可调参数,代表止损比例。止盈价格为入场价格加上入场价格的tp%。tp是用户可调参数,代表止盈比例。
通过strategy.entry函数分别设置止损单和止盈单。当价格触碰止损线时,会自动止损;当价格触碰止盈线时,会自动止盈。
平仓后,通过strategy.cancel函数自动撤销止损止盈订单。
策略优势
本策略具有以下优势:
-
自动化程度高,无需人工干预,适合自动交易;
-
可自定义止损止盈比例,控制风险;
-
交易信号来自指标,避免假突破;
-
可视化止盈止损,直观明了;
-
策略逻辑清晰简单,容易理解实现。
风险及解决方法
本策略也存在一些风险:
-
指标产生假信号的风险。解决方法是优化参数,确保指标稳定可靠。
-
止损止盈比例设定不合理,可能过于宽松或过于激进。解决方法是针对不同市场调整止损止盈参数。
-
突破入场容易被套。解决方法是结合趋势、量价指标等过滤入场信号。
-
回撤可能较大。解决方法是降低仓位标准,或追踪止损。
策略优化方向
本策略可以从以下几个方面进行优化:
-
优化移动平均线的参数,使其更加可靠;
-
优化入场条件,避免假突破,可加入量价确认;
-
优化止损止盈策略,可以使用动态止损、跟踪止损等;
-
优化资金管理,调整仓位标准,降低单笔风险;
-
优化过滤入场时机,结合趋势、支撑阻力位等指标。
-
加入 Pyramiding 进行加仓策略,以提高盈利能力。
-
针对特定品种进行参数优化。
总结
本策略作为一个指标驱动型的止损止盈策略,具有交易自动化、风险控制的优势,适合定量交易。但也存在一些需要优化的方向,如优化指标参数、入场过滤、止损止盈策略、资金管理等。总体来说,本策略提供了一个简单可靠的交易技术框架,在此基础上可以进行扩展和优化,使其成为一个更强大的策略。
||
Overview
This strategy uses a moving average as trading signals and combines it with user-defined stop loss and take profit ratios to implement a complete indicator-driven stop loss and take profit strategy. It can enter trades, set stop loss, and take profit automatically without manual interference, suitable for algorithmic trading.
Strategy Logic
The core logic of this strategy is:
-
Use 3-period SMA as trading signals, go long when SMA crosses above 0, and go short when SMA crosses below 0.
-
After entering a trade, users can customize the stop loss and take profit ratios.
-
Based on entry price and stop loss ratio set by user, automatically set stop loss line.
-
Based on entry price and take profit ratio set by user, automatically set take profit line.
-
When price touches stop loss line, stop out automatically. When price touches take profit line, take profit automatically.
-
After closing positions, automatically cancel stop loss and take profit orders.
Specifically, the strategy calculates 3-period SMA using sma function and assigns it to ma variable.
Then it calculates the long entry line long, which is ma plus ma% of lo. lo is a user adjustable parameter for long entry line offset.
When ma crosses above 0, it signals a long entry. Strategy enters long using strategy.entry function with entry price set to long.
At the same time, stop loss and take profit prices are set. Stop loss price is entry price minus entry price% of sl. sl is user adjustable stop loss ratio parameter. Take profit price is entry price plus entry price% of tp. tp is user adjustable take profit ratio parameter.
Strategy.entry function sets stop loss and take profit orders separately. When price touches stop loss line, it will stop out automatically. When price touches take profit line, it will take profit automatically.
After closing positions, stop loss and take profit orders are cancelled automatically using strategy.cancel function.
Advantages
The advantages of this strategy:
-
High degree of automation, no manual interference needed, suitable for algorithm trading.
-
Customizable stop loss and take profit ratios to control risk.
-
Trading signals come from indicator, avoiding false breakout.
-
Visualized stop loss and take profit, intuitive.
-
Simple and clear strategy logic, easy to understand and implement.
Risks and Solutions
There are also some risks with this strategy:
-
Risk of false signals from indicator. Solution is to optimize parameters to ensure reliable indicator.
-
Improper stop loss and take profit ratio settings, could be too loose or too aggressive. Solution is to adjust ratios for different markets.
-
Breakout entry is prone to being trapped. Solution is to filter entry signals with trend, volume etc.
-
Potentially large drawdown. Solution is to lower position sizing or use trailing stop loss.
Optimization Directions
Some directions to optimize the strategy:
-
Optimize moving average parameters for reliability.
-
Optimize entry conditions to avoid false breakout, add volume confirmation etc.
-
Optimize stop loss and take profit, use dynamic or trailing stop loss etc.
-
Optimize risk management, adjust position sizing, lower single trade risk.
-
Optimize entry timing, combine with trend, support/resistance etc.
-
Add pyramiding for compounding gains.
-
Parameter optimization for specific products.
Conclusion
This strategy provides a simple and reliable technical framework for indicator-driven stop loss and take profit with advantages like automation and risk control. It is suitable for algorithmic trading. There are also many aspects that can be improved and optimized, such as indicator parameters, entry filters, stop loss/take profit strategies, risk management etc. With further extensions and optimizations, it can become an even more powerful trading strategy.
[/trans]
Strategy Arguments
| Argument | Default | Description |
|---|---|---|
| v_input_1 | -5 | Long-line, % |
| v_input_2 | 5 | Take-profit |
| v_input_3 | 2 | Stop-loss |
| v_input_4 | true | Display info panels? |
| v_input_5 | 20 | Info panel offset |
| v_input_6 | 0 | Info panel label size: size.large |
Source (PineScript)
/*backtest
start: 2023-01-01 00:00:00
end: 2023-11-09 00:00:00
period: 1d
basePeriod: 1h
exchanges: [{"eid":"Futures_Binance","currency":"BTC_USDT"}]
*/

//@version=4
strategy("example for panel signals", overlay = true, default_qty_type = strategy.percent_of_equity, default_qty_value = 100, pyramiding = 0)
//https://www.tradingview.com/script/m2a04xmb-noro-s-shiftma-tp-sl-strategy/
//Settings
lo = input(-5.0, title = "Long-line, %")
tp = input(5.0, title = "Take-profit")
sl = input(2.0, title = "Stop-loss")

//SMA
ma = sma(ohlc4, 3)
long = ma + ((ma / 100) * lo)

//Orders
avg = strategy.position_avg_price
if ma > 0
    strategy.entry("Long", strategy.long, limit = long)
    strategy.entry("Take", strategy.short, 0, limit = avg + ((avg / 100) * tp))
    strategy.entry("Stop", strategy.short, 0, stop = avg - ((avg / 100) * sl))

//Cancel order
if strategy.position_size == 0
    strategy.cancel("Take")
    strategy.cancel("Stop")

//Lines
plot(long, offset = 1, color = color.black, transp = 0)
take = avg != 0 ? avg + ((avg / 100) * tp) : long + ((long / 100) * tp)
stop = avg != 0 ? avg - ((avg / 100) * sl) : long - ((long / 100) * sl)
takelinecolor = avg == avg[1] and avg != 0 ? color.lime : na
stoplinecolor = avg == avg[1] and avg != 0 ? color.red : na
plot(take, offset = 1, color = takelinecolor, linewidth = 3, transp = 0)
plot(stop, offset = 1, color = stoplinecolor, linewidth = 3, transp = 0)
//
disp_panels = input(true, title="Display info panels?")
h=high
info_label_off = input(20, title="Info panel offset")
info_label_size = input(size.large, options=[size.tiny, size.small, size.normal, size.large, size.huge], title="Info panel label size")
info_panel_x = timenow + round(change(time)*info_label_off)
info_panel_y = h

info_title= "-=-=-=-=- Info Panel -=-=-=-=-"
info_div = "\n\n------------------------------"
a = "\n\ Long : " + tostring(long)
b = "\n\ Stop loss : " + tostring(stop)
c = "\n\ TP : " + tostring(take)
// info_text = a+c+b
// info_panel = disp_panels ? label.new(x=info_panel_x, y=info_panel_y, text=info_text, xloc=xloc.bar_time, yloc=yloc.price, color=color.yellow, style=label.style_labelup, textcolor=color.black, size=info_label_size) : na
// label.delete(info_panel[1])
Detail
https://www.fmz.com/strategy/431665
Last Modified
2023-11-10 11:28:06