
8.6 KiB
Name
平滑移动平均线交叉策略EMA-Crossover-Strategy
Author
ChaoZhang
Strategy Description
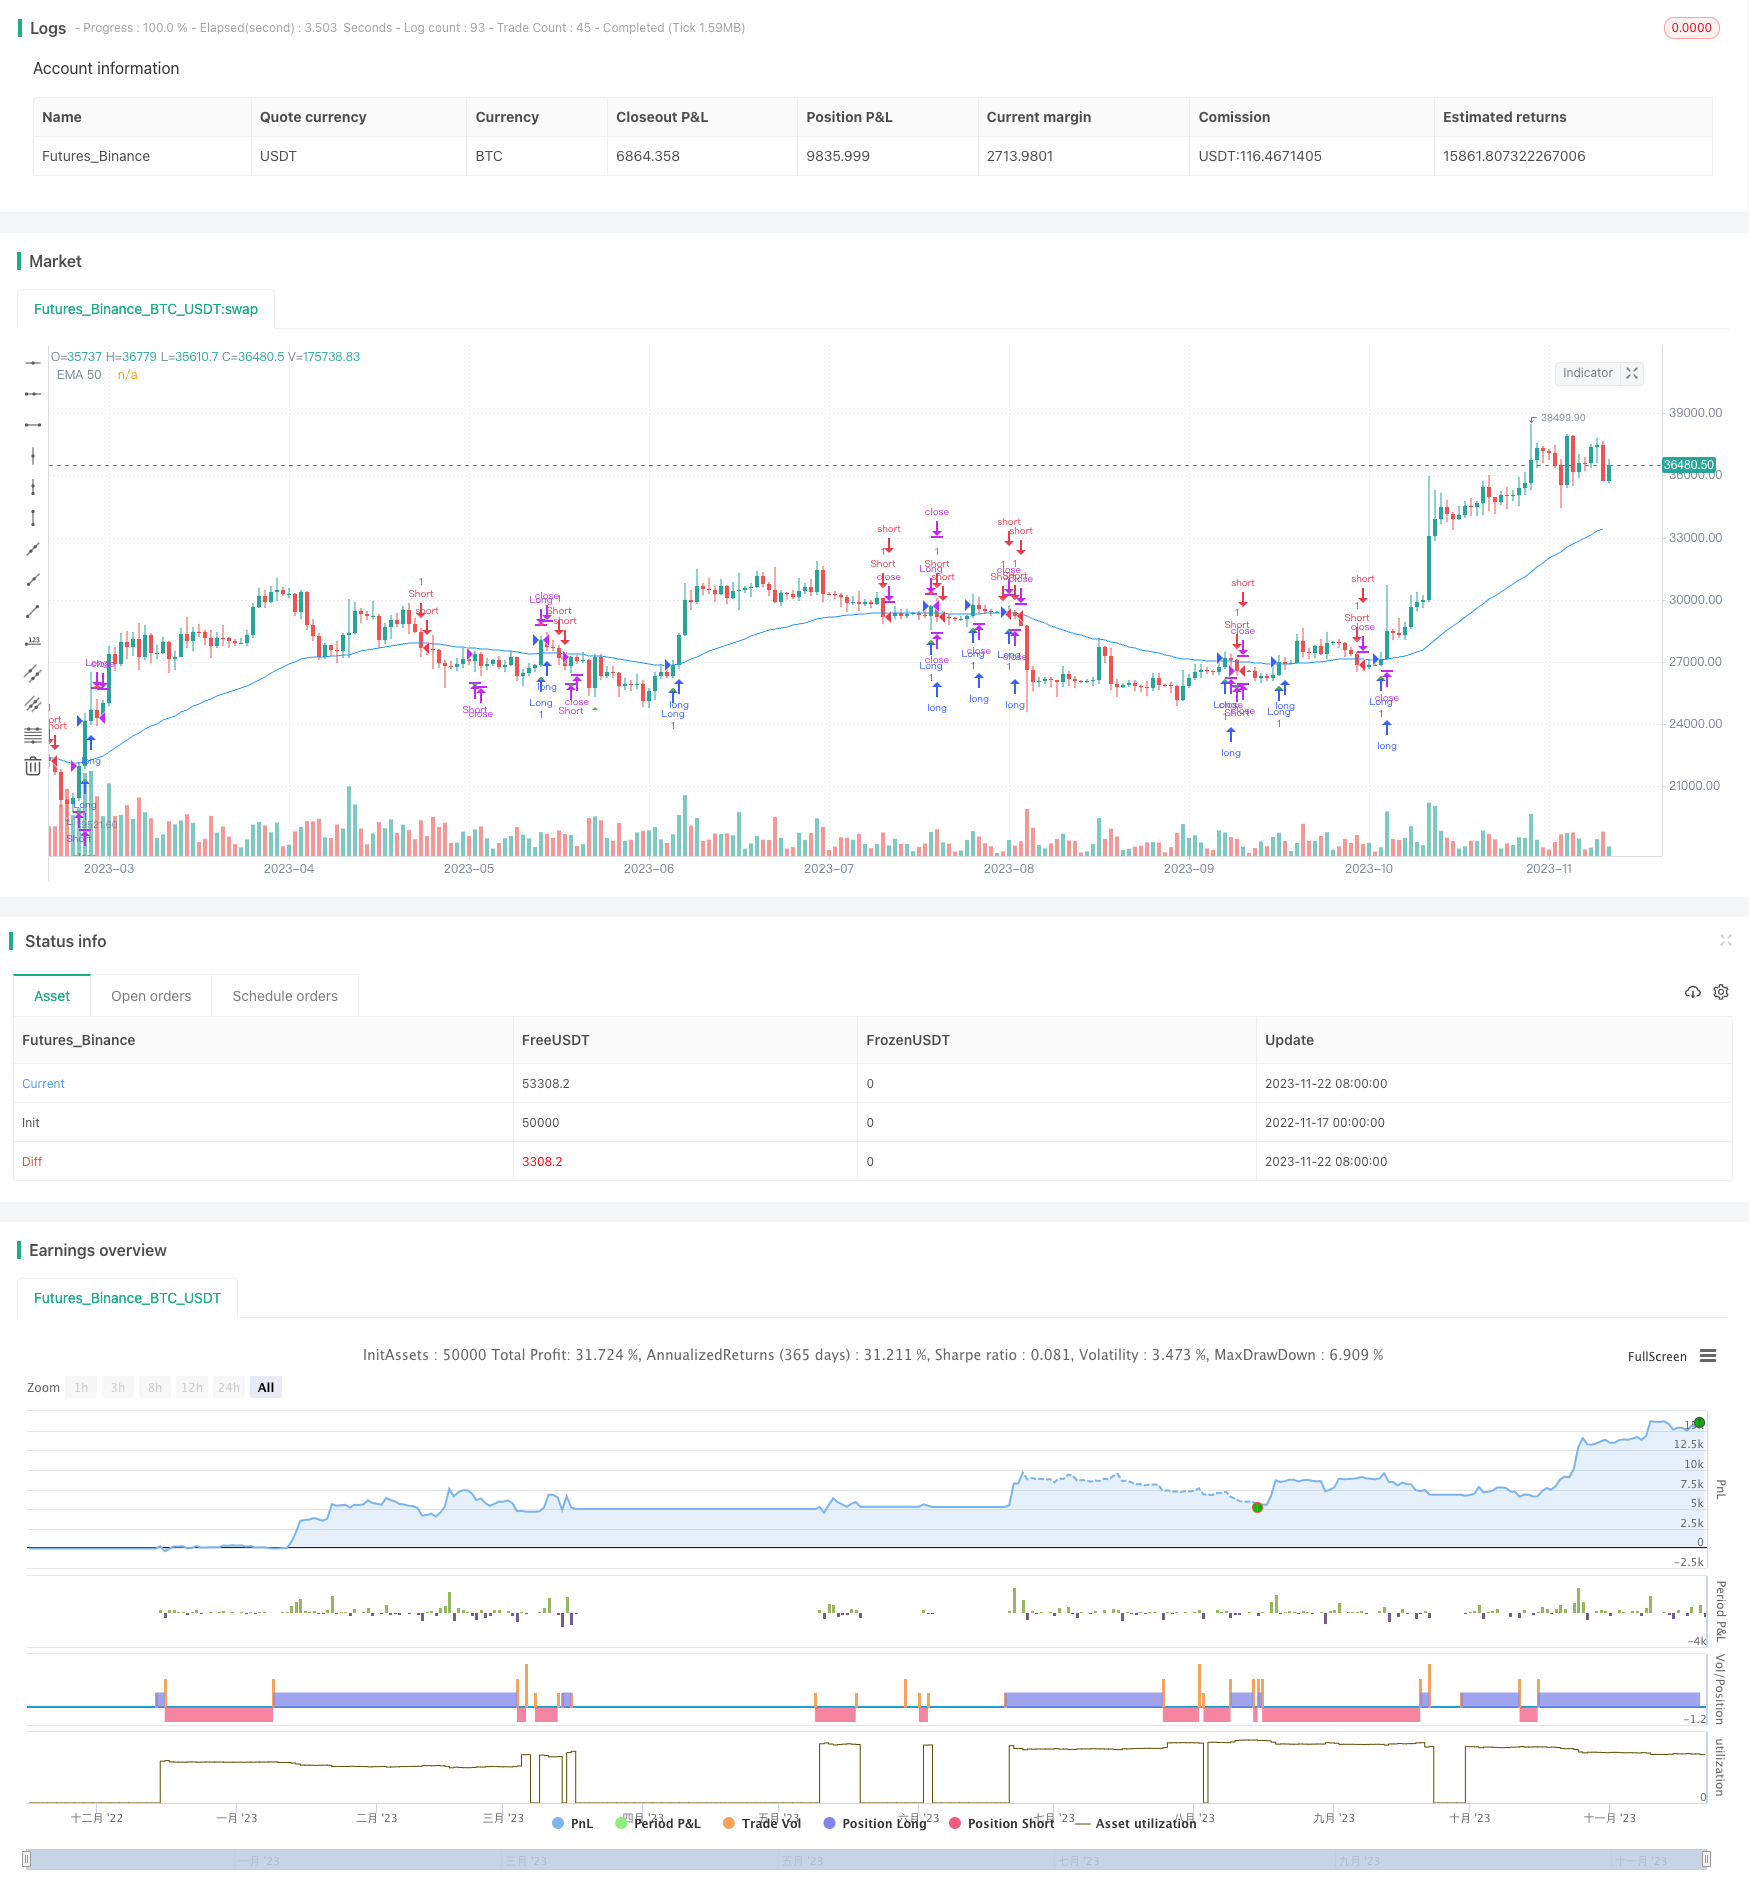
[trans]
概述
本策略是一种基于平滑移动平均线交叉的交易策略。它使用50周期的指数移动平均线(EMA)作为主要的技术指标,当价格线从下方上穿EMA时做多,从上方下穿EMA时做空,实现获利。
策略原理
核心思想是使用50周期的EMA作为判断价格趋势的工具。EMA线能平滑价格的数据,去除短期的市场噪音,反映更长期的价格趋势方向。当价格线从下方上穿EMA线时,表示价格开始上涨,属于做多的时机。当价格线从上方下穿EMA线时,表示价格开始下跌,属于做空的时机。
具体来说,该策略主要包括以下几个方面:
-
输入参数:设置EMA的周期长度为50。
-
计算指标:调用ta.ema函数计算50周期的EMA。
-
入场条件:价格上穿EMA线时生成做多信号,价格下穿EMA线时生成做空信号。
-
出场条件:记录入场时的最高价/最低价,价格后续回破该价格就出场。
-
可视化:绘制EMA线,标记做多做空的入场点和出场点。
通过这个方法,我们可以顺势而为,跟随趋势的方向进行交易,在价格开始转头时及时止损退出。
策略优势分析
相比其它指标和策略,该EMA交叉策略有几个显著的优点:
简单直观。核心指标只有一个EMA线,容易看懂和操作。不会出现指标错综复杂的情况。
灵活调整。EMA的周期长度可以非常灵活地调整,适用于不同市场和品种。
抓住趋势。EMA能有效平滑价格数据,捕捉到价格中长期趋势的转变。
回撤控制。运用价格新的高点/低点来止损,可以很好控制回撤。
风险及解决方法
该策略也存在一些风险,主要包括:
趋势错失。当价格出现剧烈波动时,EMA线无法及时捕捉转折点,可能错过趋势转换的时机。可以结合其它指标如布林带进行验证。
止损过早。止损点直接取信号出现时的最高价/最低价,可能会比较容易达到而过早止损。可以考虑采用移动止损、放宽止损范围等方法。
参数调整。EMA周期不合适会导致多次错误信号。需要针对不同周期、市场波动率调整EMA参数。
策略优化方向
该策略还有进一步优化的空间:
-
结合布林带指标验证信号,避免EMA线生成错误信号。
-
改进止损机制,运用移动止损、回看波动止损等方法,避免过早止损。
-
按照市场和交易品种不同,优化EMA的参数,找到最合适周期。
-
增加自动参数优化模块,让策略自己寻找最佳的参数组合。
总结
本策略基于EMA指标判断价格趋势方向,根据金叉做多和死叉做空。策略简单易操作,可以顺势而为捕捉价格趋势,止损控制风险。该策略还可以进一步优化,结合更多指标过滤信号,改进止损机制等。总的来说,该平滑移动平均线交叉策略值得关注和考虑。
||
Overview
This strategy is a trading strategy based on exponential moving average (EMA) crossover. It uses the 50-period EMA as the main technical indicator. When the price line crosses above the EMA from below, go long. When the price line crosses below the EMA from above, go short to profit.
Strategy Logic
The core idea is to use the 50-period EMA as a tool to judge the trend of prices. The EMA line can smooth the price data and remove short-term market noise to reflect longer term price trends. When the price line crosses above the EMA line from below, it indicates that prices are starting to rise which is a chance to go long. When the price line crosses below the EMA line from above, it indicates that prices are starting to fall which is an opportunity to go short.
Specifically, the strategy mainly includes the following aspects:
-
Input parameters: set EMA period to 50.
-
Indicator calculation: call ta.ema function to calculate 50-period EMA.
-
Entry conditions: a long signal is generated when price crosses above EMA, and a short signal is generated when price crosses below EMA.
-
Exit conditions: record the highest/lowest price when entering. Exit when price breaks that level later.
-
Visualization: plot EMA line and mark entry and exit points for long/short.
In this way, we can trade along the trend direction and timely stop loss when price starts to reverse.
Advantage Analysis
Compared with other indicators and strategies, the EMA crossover strategy has several significant advantages:
Simple and intuitive. The only core indicator is EMA which is easy to understand and operate. No messy complex indicators.
Flexible adjustment. The period of EMA can be adjusted very flexibly to suit different markets and products.
Catch the trend. EMA can effectively smooth price data and capture medium to long term trend changes.
Drawdown control. Use new highest/lowest price to stop loss which can control drawdowns very well.
Risks and Solutions
The strategy also has some risks, mainly including:
Trend missing. When prices fluctuate violently, EMA may not capture reversal points timely and miss trend change opportunities. Other indicators like Bollinger Bands can be combined for verification.
Premature stop loss. The stop loss point directly takes the highest/lowest price when signal appears. It may be too easy to reach and stop loss prematurely. Moving stop loss, widened stop loss range can be considered.
Parameter tuning. Unsuitable EMA period will lead to multiple incorrect signals. Parameters like EMA period need to be adjusted based on volatility, cycle etc.
Improvement Direction
The strategy has room for further improvement:
-
Combine with Bollinger Bands to filter signals and avoid incorrect EMA signals.
-
Improve the stop loss mechanism with trailing stop loss, swing stop loss etc to avoid premature exit.
-
Optimize EMA parameters based on different markets and trading instruments to find the most suitable periods.
-
Add auto parameter optimization module to find the optimum combination.
Conclusion
The strategy determines price trend based on EMA indicator and goes long on golden cross and goes short on death cross. The strategy is simple to operate and can trade along the trend direction with stop loss control. The strategy can be further optimized by combining more filter indicators, improving stop loss mechanisms etc. In general, the EMA crossover strategy is worth paying attention to and considering.
[/trans]
Strategy Arguments
| Argument | Default | Description |
|---|---|---|
| v_input_1 | 50 | EMA Length |
Source (PineScript)
/*backtest
start: 2022-11-17 00:00:00
end: 2023-11-23 00:00:00
period: 1d
basePeriod: 1h
exchanges: [{"eid":"Futures_Binance","currency":"BTC_USDT"}]
*/

//@version=5
strategy("EMA 50 Crossover Strategy", shorttitle="EMA 50 xover", overlay=true)

// Input for EMA length
emaLength = input(50, title="EMA Length")

// Calculate EMA 50
ema50 = ta.ema(close, emaLength)

// Define conditions for long entry
longCondition = ta.crossover(close, ema50)

// Define conditions for short entry
shortCondition = ta.crossunder(close, ema50)

// Calculate the high of the signal candle for long entry
var float longSignalHigh = na
if (longCondition)
    longSignalHigh := high

// Calculate the low of the signal candle for short entry
var float shortSignalLow = na
if (shortCondition)
    shortSignalLow := low

// Long entry
plotshape(series=longCondition, title="Long Entry Signal", location=location.belowbar, color=color.green, style=shape.triangleup, size=size.small)

// Short entry
plotshape(series=shortCondition, title="Short Entry Signal", location=location.abovebar, color=color.red, style=shape.triangledown, size=size.small)

// Exit conditions
longExitCondition = ta.crossunder(close, longSignalHigh)
shortExitCondition = ta.crossover(close, shortSignalLow)

// Plot exit signals
plotshape(series=longExitCondition, title="Long Exit Signal", location=location.abovebar, color=color.red, style=shape.triangledown, size=size.small)
plotshape(series=shortExitCondition, title="Short Exit Signal", location=location.belowbar, color=color.green, style=shape.triangleup, size=size.small)

// Strategy entry and exit logic
strategy.entry("Long", strategy.long, when=longCondition)
strategy.entry("Short", strategy.short, when=shortCondition)
strategy.close("Long", when=longExitCondition)
strategy.close("Short", when=shortExitCondition)

// Plot EMA 50
plot(ema50, title="EMA 50", color=color.blue)
Detail
https://www.fmz.com/strategy/433094
Last Modified
2023-11-24 13:49:45