
18 KiB
Name
平滑移动平均带策略The-Smooth-Moving-Average-Ribbon-Strategy
Author
ChaoZhang
Strategy Description
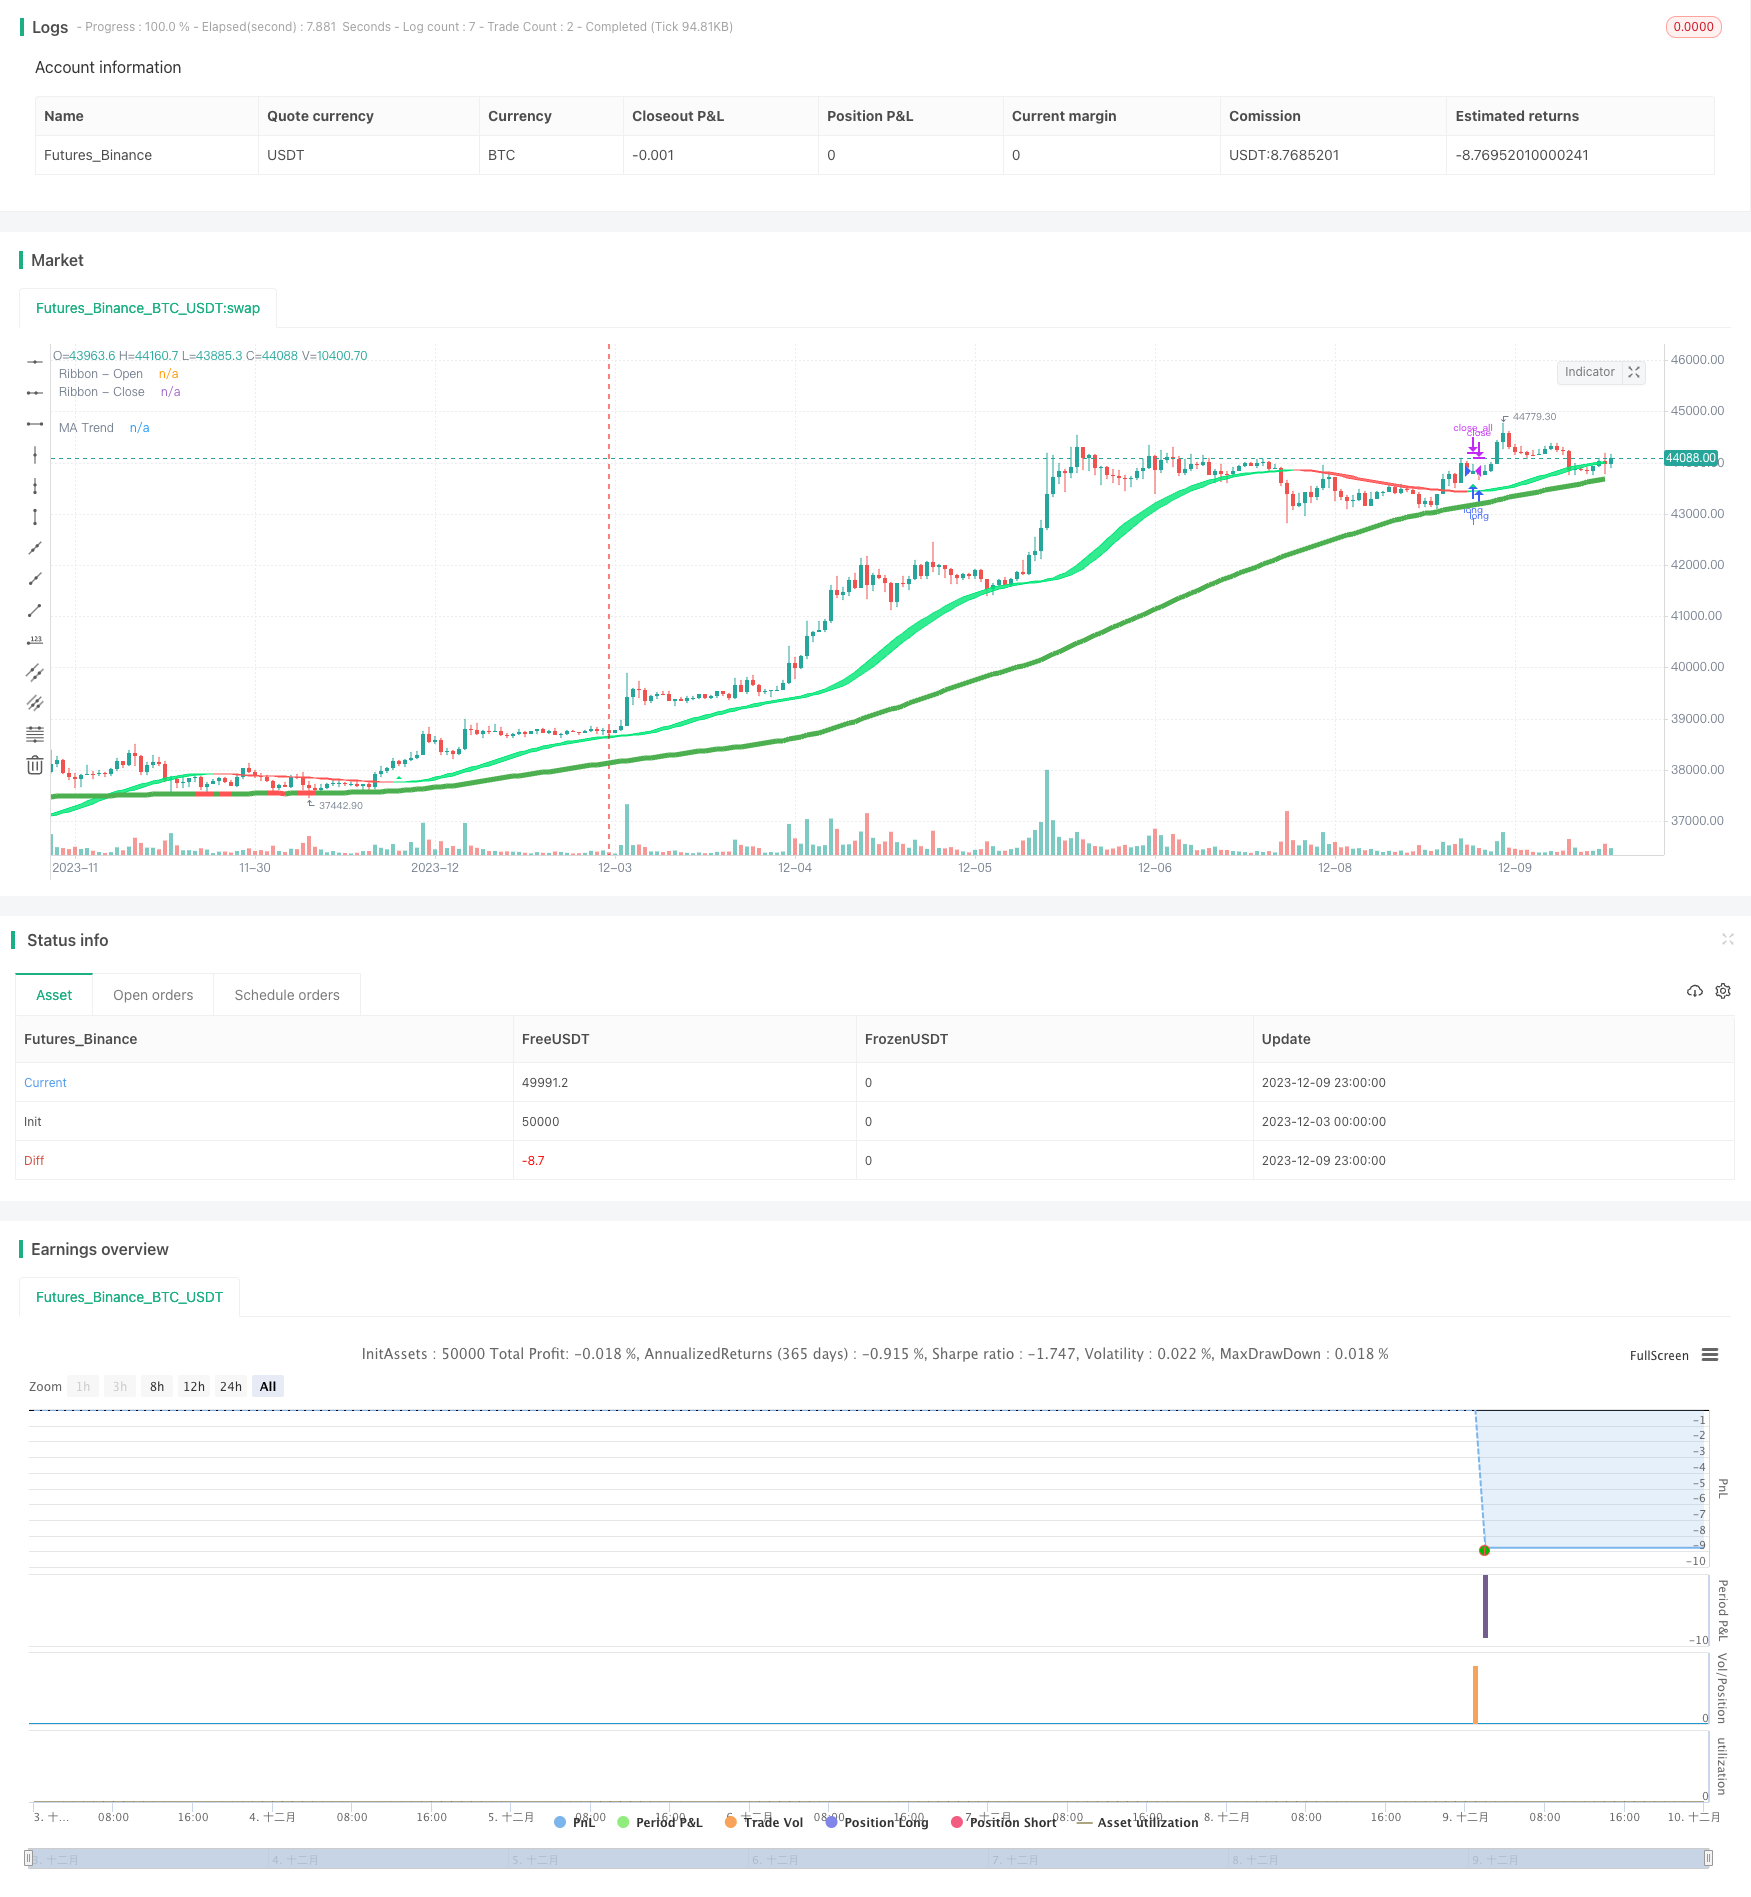 [trans]
概述
本策略通过使用平滑移动平均线构建平滑价格带,并整合多种平滑移动平均线,以实现实时过滤趋势的功能,属于典型的趋势跟随型策略。
策略原理
- 通过构建平滑价格带,使用平滑移动平均线跟踪价格变化,实现对价格变化的平滑跟踪。
- 策略支持输入多种不同类型的移动平均线作为平滑移动平均线的计算类型,如EMA、SMMA、KAMA等。
- 支持对这些移动平均线进行1-5次的叠加平滑,以获得更加平滑的价格带。
- 同时支持在价格和移动平均线之间使用布林带,更好地捕捉价格的变化。
- 通过启用附加的移动平均线过滤器,可以更好地过滤震荡,识别趋势方向。过滤器也支持多种移动平均线类型。
- 结合形态识别指标,实现对买入卖出信号的自动识别。
该策略通过构建平滑价格带捕捉价格趋势,并整合移动平均线过滤器确认趋势方向,属于典型的趋势跟随策略。通过调整参数可以灵活适应不同品种不同周期的市场环境。
策略优势
- 构建价格带可以更平滑地跟踪价格的变化趋势,有效减少错失机会的概率。
- 支持多种移动平均线类型,可以根据不同周期及品种选择合适的移动平均线,提高策略的适应性。
- 1-5次的叠加平滑,可以显著提高价格变化的跟踪能力,更准确抓取趋势转折点。
- 移动平均线过滤器可以有效减少无效信号,提高胜率。
- 通过调整移动平均线长度,可以适应不同时间周期,甚至可以通过多时间框架验证,进一步提升策略效果。
- 支持黑化玻璃显示,可以清晰直观地观察价格带的走势。
策略风险
- 跟踪长期趋势较强,但对短期波动的跟踪和反应较差,容易在震荡行情中产生较多的无效信号。
- 在暴涨暴跌的价格快速变化中,平滑移动平均线会有一定的滞后性,可能错过最佳入场时机。
- 多重叠加的移动平均可能过于平滑价格变化,导致买点卖点识别不准。
- 如果启用的移动平均线长度参数设置不当,可能导致产生大量假信号。
解决方法:
- 适当缩短移动平均线长度,加快对价格变化的反应。
- 调整叠加次数,降低过度平滑的可能。
- 优化和测试移动平均线组合,选择最佳参数。
- 结合其他指标进行多时间框架验证,降低假信号率。
策略优化方向
- 测试优化移动平均线类型的组合,选择最佳参数。
- 测试优化移动平均线长度参数,适应更广泛的品种和时间周期。
- 尝试不同的叠加平滑次数,找到最佳平衡点。
- 尝试添加布林带作为辅助指标。
- 测试不同的附加移动平均线作为过滤器。
- 结合其他指标进行多时间框架验证。
总结
本策略属于典型的趋势跟随策略,通过构建平滑移动平均带持续跟踪价格趋势,结合辅助过滤器避免无效信号。策略优势在于平滑价格带的构建,可以更好地捕捉价格趋势的转折。同时也存在一定的滞后性风险。通过参数优化和指标优化,可以不断提升策略效果,值得进一步研究。
||
Overview
This strategy constructs a smooth price band using smooth moving averages and integrates various smooth moving averages to filter the trend in real time. It belongs to a typical trend following strategy.
Strategy Principle
- Construct a smooth price band to track price changes using smooth moving averages.
- The strategy supports various moving average types as the calculation method for smooth moving averages, such as EMA, SMMA, KAMA, etc.
- It supports 1-5 layers of stacking smoothness on these moving averages to obtain an even smoother price band.
- It also supports adding Bollinger Bands between prices and moving averages to better capture price changes.
- By enabling an additional moving average filter, it can filter out fluctuations better and identify trend directions. The filter also supports multiple moving average types.
- Combined with pattern recognition indicators, it can automatically identify buy and sell signals.
By constructing a smooth price band to capture price trends, and integrating a moving average filter to confirm trend directions, this strategy belongs to a typical trend following strategy. By adjusting parameters, it can be flexibly adapted to different products and timeframes.
Advantages
- Constructing price bands can track price trend changes more smoothly, reducing the probability of missing opportunities.
- Supporting multiple moving average types allows selecting suitable moving averages based on different timeframes and products, improving the adaptability of the strategy.
- 1-5 layers of stacking smoothness can significantly improve the tracking capability of price changes and capture trend reversal points more precisely.
- The moving average filter can effectively reduce invalid signals and improve win rate.
- By adjusting moving average lengths, it can be adapted to different timeframes. Multi-timeframe verification can further improve strategy performance.
- Supporting black glass display enables clear and intuitive observation of price band trends.
Risks
- Strong in tracking long-term trends, but poor in tracking and reacting to short-term fluctuations, tending to generate more invalid signals in range-bound markets.
- In violent price surges and plunges, the lagging of smooth moving averages may miss the best entry timing.
- Excessive stacking of moving averages may overly smooth price changes and cause inaccurate identifications of buy and sell points.
- If the enabled moving average length parameters are improperly set, it may generate a large number of false signals.
Solutions:
- Appropriately shorten moving average lengths to accelerate reaction to price changes.
- Adjust stacking times to reduce over-smoothness.
- Optimize and test moving average combinations to select optimal parameters.
- Use multi-timeframe verification with other indicators to reduce false signals.
Optimization Directions
- Test and optimize combinations of moving average types to select optimal parameters.
- Test and optimize moving average length parameters to adapt to more products and timeframes.
- Try different stacking smoothness times to find the optimal balance point.
- Try adding Bollinger Bands as an auxiliary indicator.
- Test different additional moving averages as filters.
- Use multi-timeframe verification with other indicators.
Conclusion
This strategy belongs to a typical trend following strategy that continuously tracks price trends by constructing smooth moving average bands and avoids invalid signals with assisting filters. Its advantage lies in constructing smooth price bands to better capture turns in price trends. It also has certain risks of lagging. By parameter optimization and indicator optimization, the strategy performance can be continuously improved and is worth further research.
[/trans]
Strategy Arguments
| Argument | Default | Description |
|---|---|---|
| v_input_1 | true | Use HA as source ? |
| v_input_2 | 11 | MA1 Length |
| v_input_3 | 3 | Nr. of MA1 Smoothings |
| v_input_4 | 0 | MA Type: EMA |
| v_input_5 | true | Use HA as source ? |
| v_input_6 | true | ----- Use MA Filter ( For Lower Timeframe Swings / Scalps ) ? ----- |
| v_input_7_close | 0 | MA - Source: close |
| v_input_8 | 100 | MA - Length |
| v_input_9 | 0 | MA - Type: SMA |
| v_input_10 | false | Use HA Candles as Source ? |
| v_input_11 | true | Use Rising / Falling Logic ? |
| v_input_12 | 2018 | Backtest Start Year |
| v_input_13 | true | Backtest Start Month |
| v_input_14 | true | Backtest Start Day |
Source (PineScript)
/*backtest
start: 2023-12-03 00:00:00
end: 2023-12-10 00:00:00
period: 1h
basePeriod: 15m
exchanges: [{"eid":"Futures_Binance","currency":"BTC_USDT"}]
*/

//@version=4
// Copyright (c) 2007-present Jurik Research and Consulting. All rights reserved.
// Copyright (c) 2018-present, Alex Orekhov (everget)
// Thanks to everget for code for more advanced moving averages
// Smooth Moving Average Ribbon [STRATEGY] @PuppyTherapy script may be freely distributed under the MIT license.
strategy( title="Smooth Moving Average Ribbon [STRATEGY] @PuppyTherapy", overlay=true )

// ---- CONSTANTS ----
lsmaOffset = 1
almaOffset = 0.85
almaSigma  = 6
phase = 2
power = 2

// ---- GLOBAL FUNCTIONS ----
kama(src, len)=>
    xvnoise = abs(src - src[1])
    nfastend = 0.666
    nslowend = 0.0645
    nsignal = abs(src - src[len])
    nnoise = sum(xvnoise, len)
    nefratio = iff(nnoise != 0, nsignal / nnoise, 0)
    nsmooth = pow(nefratio * (nfastend - nslowend) + nslowend, 2)
    nAMA = 0.0
    nAMA := nz(nAMA[1]) + nsmooth * (src - nz(nAMA[1]))

t3(src, len)=>
    xe1_1 = ema(src,    len)
    xe2_1 = ema(xe1_1,  len)
    xe3_1 = ema(xe2_1,  len)
    xe4_1 = ema(xe3_1,  len)
    xe5_1 = ema(xe4_1,  len)
    xe6_1 = ema(xe5_1,  len)
    b_1 = 0.7
    c1_1 = -b_1*b_1*b_1
    c2_1 = 3*b_1*b_1+3*b_1*b_1*b_1
    c3_1 = -6*b_1*b_1-3*b_1-3*b_1*b_1*b_1
    c4_1 = 1+3*b_1+b_1*b_1*b_1+3*b_1*b_1
    nT3Average_1 = c1_1 * xe6_1 + c2_1 * xe5_1 + c3_1 * xe4_1 + c4_1 * xe3_1

// The general form of the weights of the (2m + 1)-term Henderson Weighted Moving Average
getWeight(m, j) =>
    numerator = 315 * (pow(m + 1, 2) - pow(j, 2)) * (pow(m + 2, 2) - pow(j, 2)) * (pow(m + 3, 2) - pow(j, 2)) * (3 * pow(m + 2, 2) - 11 * pow(j, 2) - 16)
    denominator = 8 * (m + 2) * (pow(m + 2, 2) - 1) * (4 * pow(m + 2, 2) - 1) * (4 * pow(m + 2, 2) - 9) * (4 * pow(m + 2, 2) - 25)

    denominator != 0
         ? numerator / denominator
         : 0

hwma(src, termsNumber) =>
    sum = 0.0
    weightSum = 0.0

    termMult = (termsNumber - 1) / 2

    for i = 0 to termsNumber - 1
        weight = getWeight(termMult, i - termMult)
        sum := sum + nz(src[i]) * weight
        weightSum := weightSum + weight

    sum / weightSum

get_jurik(length, phase, power, src)=>
    phaseRatio = phase < -100 ? 0.5 : phase > 100 ? 2.5 : phase / 100 + 1.5
    beta = 0.45 * (length - 1) / (0.45 * (length - 1) + 2)
    alpha = pow(beta, power)
    jma = 0.0
    e0 = 0.0
    e0 := (1 - alpha) * src + alpha * nz(e0[1])
    e1 = 0.0
    e1 := (src - e0) * (1 - beta) + beta * nz(e1[1])
    e2 = 0.0
    e2 := (e0 + phaseRatio * e1 - nz(jma[1])) * pow(1 - alpha, 2) + pow(alpha, 2) * nz(e2[1])
    jma := e2 + nz(jma[1])

variant(src, type, len ) =>
    v1 = sma(src, len)                                                  // Simple
    v2 = ema(src, len)                                                  // Exponential
    v3 = 2 * v2 - ema(v2, len)                                          // Double Exponential
    v4 = 3 * (v2 - ema(v2, len)) + ema(ema(v2, len), len)               // Triple Exponential
    v5 = wma(src, len)                                                  // Weighted
    v6 = vwma(src, len)                                                 // Volume Weighted
    v7 = na(v5[1]) ? sma(src, len) : (v5[1] * (len - 1) + src) / len    // Smoothed
    v8 = wma(2 * wma(src, len / 2) - wma(src, len), round(sqrt(len)))   // Hull
    v9 = linreg(src, len, lsmaOffset)                                   // Least Squares
    v10 = alma(src, len, almaOffset, almaSigma)                         // Arnaud Legoux
    v11 = kama(src, len)                                                // KAMA
    ema1 = ema(src, len)
    ema2 = ema(ema1, len)
    v13 = t3(src, len)                                                  // T3
    v14 = ema1+(ema1-ema2)                                              // Zero Lag Exponential
    v15 = hwma(src, len)                                                // Henderson Moving average thanks to  @everget
    ahma = 0.0
    ahma := nz(ahma[1]) + (src - (nz(ahma[1]) + nz(ahma[len])) / 2) / len //Ahrens Moving Average
    v16 = ahma
    v17 = get_jurik( len, phase, power, src)
    type=="EMA"?v2 : type=="DEMA"?v3 : type=="TEMA"?v4 : type=="WMA"?v5 : type=="VWMA"?v6 :
     type=="SMMA"?v7 : type=="Hull"?v8 : type=="LSMA"?v9 : type=="ALMA"?v10 : type=="KAMA"?v11 :
     type=="T3"?v13 : type=="ZEMA"?v14 : type=="HWMA"?v15 : type=="AHMA"?v16 : type=="JURIK"?v17 : v1

smoothMA(o, h, l, c, maLoop, type, len) =>
	ma_o = 0.0
	ma_h = 0.0
	ma_l = 0.0
	ma_c = 0.0
	if maLoop == 1
		ma_o := variant(o, type, len)
		ma_h := variant(h, type, len)
		ma_l := variant(l, type, len)
		ma_c := variant(c, type, len)
	if maLoop == 2
		ma_o := variant(variant(o ,type, len),type, len)
		ma_h := variant(variant(h ,type, len),type, len)
		ma_l := variant(variant(l ,type, len),type, len)
		ma_c := variant(variant(c ,type, len),type, len)
	if maLoop == 3
		ma_o := variant(variant(variant(o ,type, len),type, len),type, len)
		ma_h := variant(variant(variant(h ,type, len),type, len),type, len)
		ma_l := variant(variant(variant(l ,type, len),type, len),type, len)
		ma_c := variant(variant(variant(c ,type, len),type, len),type, len)
	if maLoop == 4
		ma_o := variant(variant(variant(variant(o ,type, len),type, len),type, len),type, len)
		ma_h := variant(variant(variant(variant(h ,type, len),type, len),type, len),type, len)
		ma_l := variant(variant(variant(variant(l ,type, len),type, len),type, len),type, len)
		ma_c := variant(variant(variant(variant(c ,type, len),type, len),type, len),type, len)
	if maLoop == 5
		ma_o := variant(variant(variant(variant(variant(o ,type, len),type, len),type, len),type, len),type, len)
		ma_h := variant(variant(variant(variant(variant(h ,type, len),type, len),type, len),type, len),type, len)
		ma_l := variant(variant(variant(variant(variant(l ,type, len),type, len),type, len),type, len),type, len)
		ma_c := variant(variant(variant(variant(variant(c ,type, len),type, len),type, len),type, len),type, len)
    [ma_o, ma_h, ma_l, ma_c]

smoothHA( o, h, l, c ) =>
    hao = 0.0
    hac = ( o + h + l + c ) / 4
    hao := na(hao[1])?(o + c / 2 ):(hao[1] + hac[1])/2
    hah = max(h, max(hao, hac))
    hal = min(l, min(hao, hac))
	[hao, hah, hal, hac]

// ---- Main Ribbon ----
haSmooth   = input(true, title=" Use HA as source ? " )
length     = input(11, title=" MA1 Length", minval=1, maxval=1000)
maLoop     = input(3, title=" Nr. of MA1 Smoothings ", minval=1, maxval=5)
type       = input("EMA", title="MA Type", options=["SMA", "EMA", "DEMA", "TEMA", "WMA", "VWMA", "SMMA", "Hull", "LSMA", "ALMA", "KAMA", "ZEMA", "HWMA", "AHMA", "JURIK", "T3"])
haSmooth2  = input(true, title=" Use HA as source ? " )

// ---- Trend ----
ma_use    = input(true, title=" ----- Use MA Filter ( For Lower Timeframe Swings / Scalps ) ? ----- " )
ma_source = input(defval = close, title = "MA - Source", type = input.source)
ma_length = input(100,title="MA - Length", minval=1 )
ma_type   = input("SMA", title="MA - Type", options=["SMA", "EMA", "DEMA", "TEMA", "WMA", "VWMA", "SMMA", "Hull", "LSMA", "ALMA", "KAMA", "ZEMA", "HWMA", "AHMA", "JURIK", "T3"])
ma_useHA  = input(defval = false, title = "Use HA Candles as Source ?")
ma_rsl    = input(true, title = "Use Rising / Falling Logic ?" )

// ---- BODY SCRIPT ----
[ ha_open, ha_high, ha_low, ha_close ] = smoothHA(open, high, low, close)

_open_ma  = haSmooth ? ha_open : open
_high_ma  = haSmooth ? ha_high : high
_low_ma   = haSmooth ? ha_low : low
_close_ma = haSmooth ? ha_close : close

[ _open, _high, _low, _close ] = smoothMA( _open_ma, _high_ma, _low_ma, _close_ma, maLoop, type, length)
[ ha_open2, ha_high2, ha_low2, ha_close2 ] = smoothHA(_open, _high, _low, _close)

_open_ma2  = haSmooth2 ? ha_open2 : _open
_high_ma2  = haSmooth2 ? ha_high2 : _high
_low_ma2   = haSmooth2 ? ha_low2 : _low
_close_ma2 = haSmooth2 ? ha_close2 : _close

ribbonColor = _close_ma2 > _open_ma2 ? color.lime : color.red
p_open  = plot(_open_ma2,  title="Ribbon - Open",   color=ribbonColor, transp=70)
p_close = plot(_close_ma2, title="Ribbon - Close",  color=ribbonColor, transp=70)
fill(p_open, p_close, color = ribbonColor, transp = 40 )

// ----- FILTER

ma = 0.0
if ma_use == true
    ma := variant( ma_useHA ? ha_close : ma_source, ma_type,  ma_length )

maFilterShort = ma_use ? ma_rsl ? falling(ma,1) : ma_useHA ? ha_close : close < ma : true
maFilterLong  = ma_use ? ma_rsl ? rising(ma,1) : ma_useHA ? ha_close : close > ma : true


colorTrend = rising(ma,1) ? color.green : color.red
plot( ma_use ? ma : na, title="MA Trend",  color=colorTrend, transp=80, transp=70, linewidth = 5)

long     = crossover(_close_ma2, _open_ma2 ) and maFilterLong
short    = crossunder(_close_ma2, _open_ma2 ) and maFilterShort
closeAll = cross(_close_ma2, _open_ma2 )

plotshape( short , title="Short", color=color.red,  transp=80, style=shape.triangledown, location=location.abovebar, size=size.small)
plotshape( long ,  title="Long",  color=color.lime, transp=80, style=shape.triangleup,   location=location.belowbar, size=size.small)

//* Backtesting Period Selector | Component *//
//* Source: https://www.tradingview.com/script/eCC1cvxQ-Backtesting-Period-Selector-Component *//
testStartYear   = input(2018, "Backtest Start Year",minval=1980)
testStartMonth  = input(1, "Backtest Start Month",minval=1,maxval=12)
testStartDay    = input(1, "Backtest Start Day",minval=1,maxval=31)
testPeriodStart = timestamp(testStartYear,testStartMonth,testStartDay,0,0)
testStopYear    = 9999 //input(9999, "Backtest Stop Year",minval=1980)
testStopMonth   = 12 // input(12, "Backtest Stop Month",minval=1,maxval=12)
testStopDay     = 31 //input(31, "Backtest Stop Day",minval=1,maxval=31)
testPeriodStop  = timestamp(testStopYear,testStopMonth,testStopDay,0,0)
testPeriod() => time >= testPeriodStart and time <= testPeriodStop ? true : false

if testPeriod() and long
    strategy.entry( "long", strategy.long )

if testPeriod() and short
    strategy.entry( "short", strategy.short )

if closeAll
    strategy.close_all( when = closeAll )
Detail
https://www.fmz.com/strategy/434981
Last Modified
2023-12-11 14:48:35