
12 KiB
Name
多重趋势跟踪策略Multiple-Trend-Tracking-Strategy
Author
ChaoZhang
Strategy Description
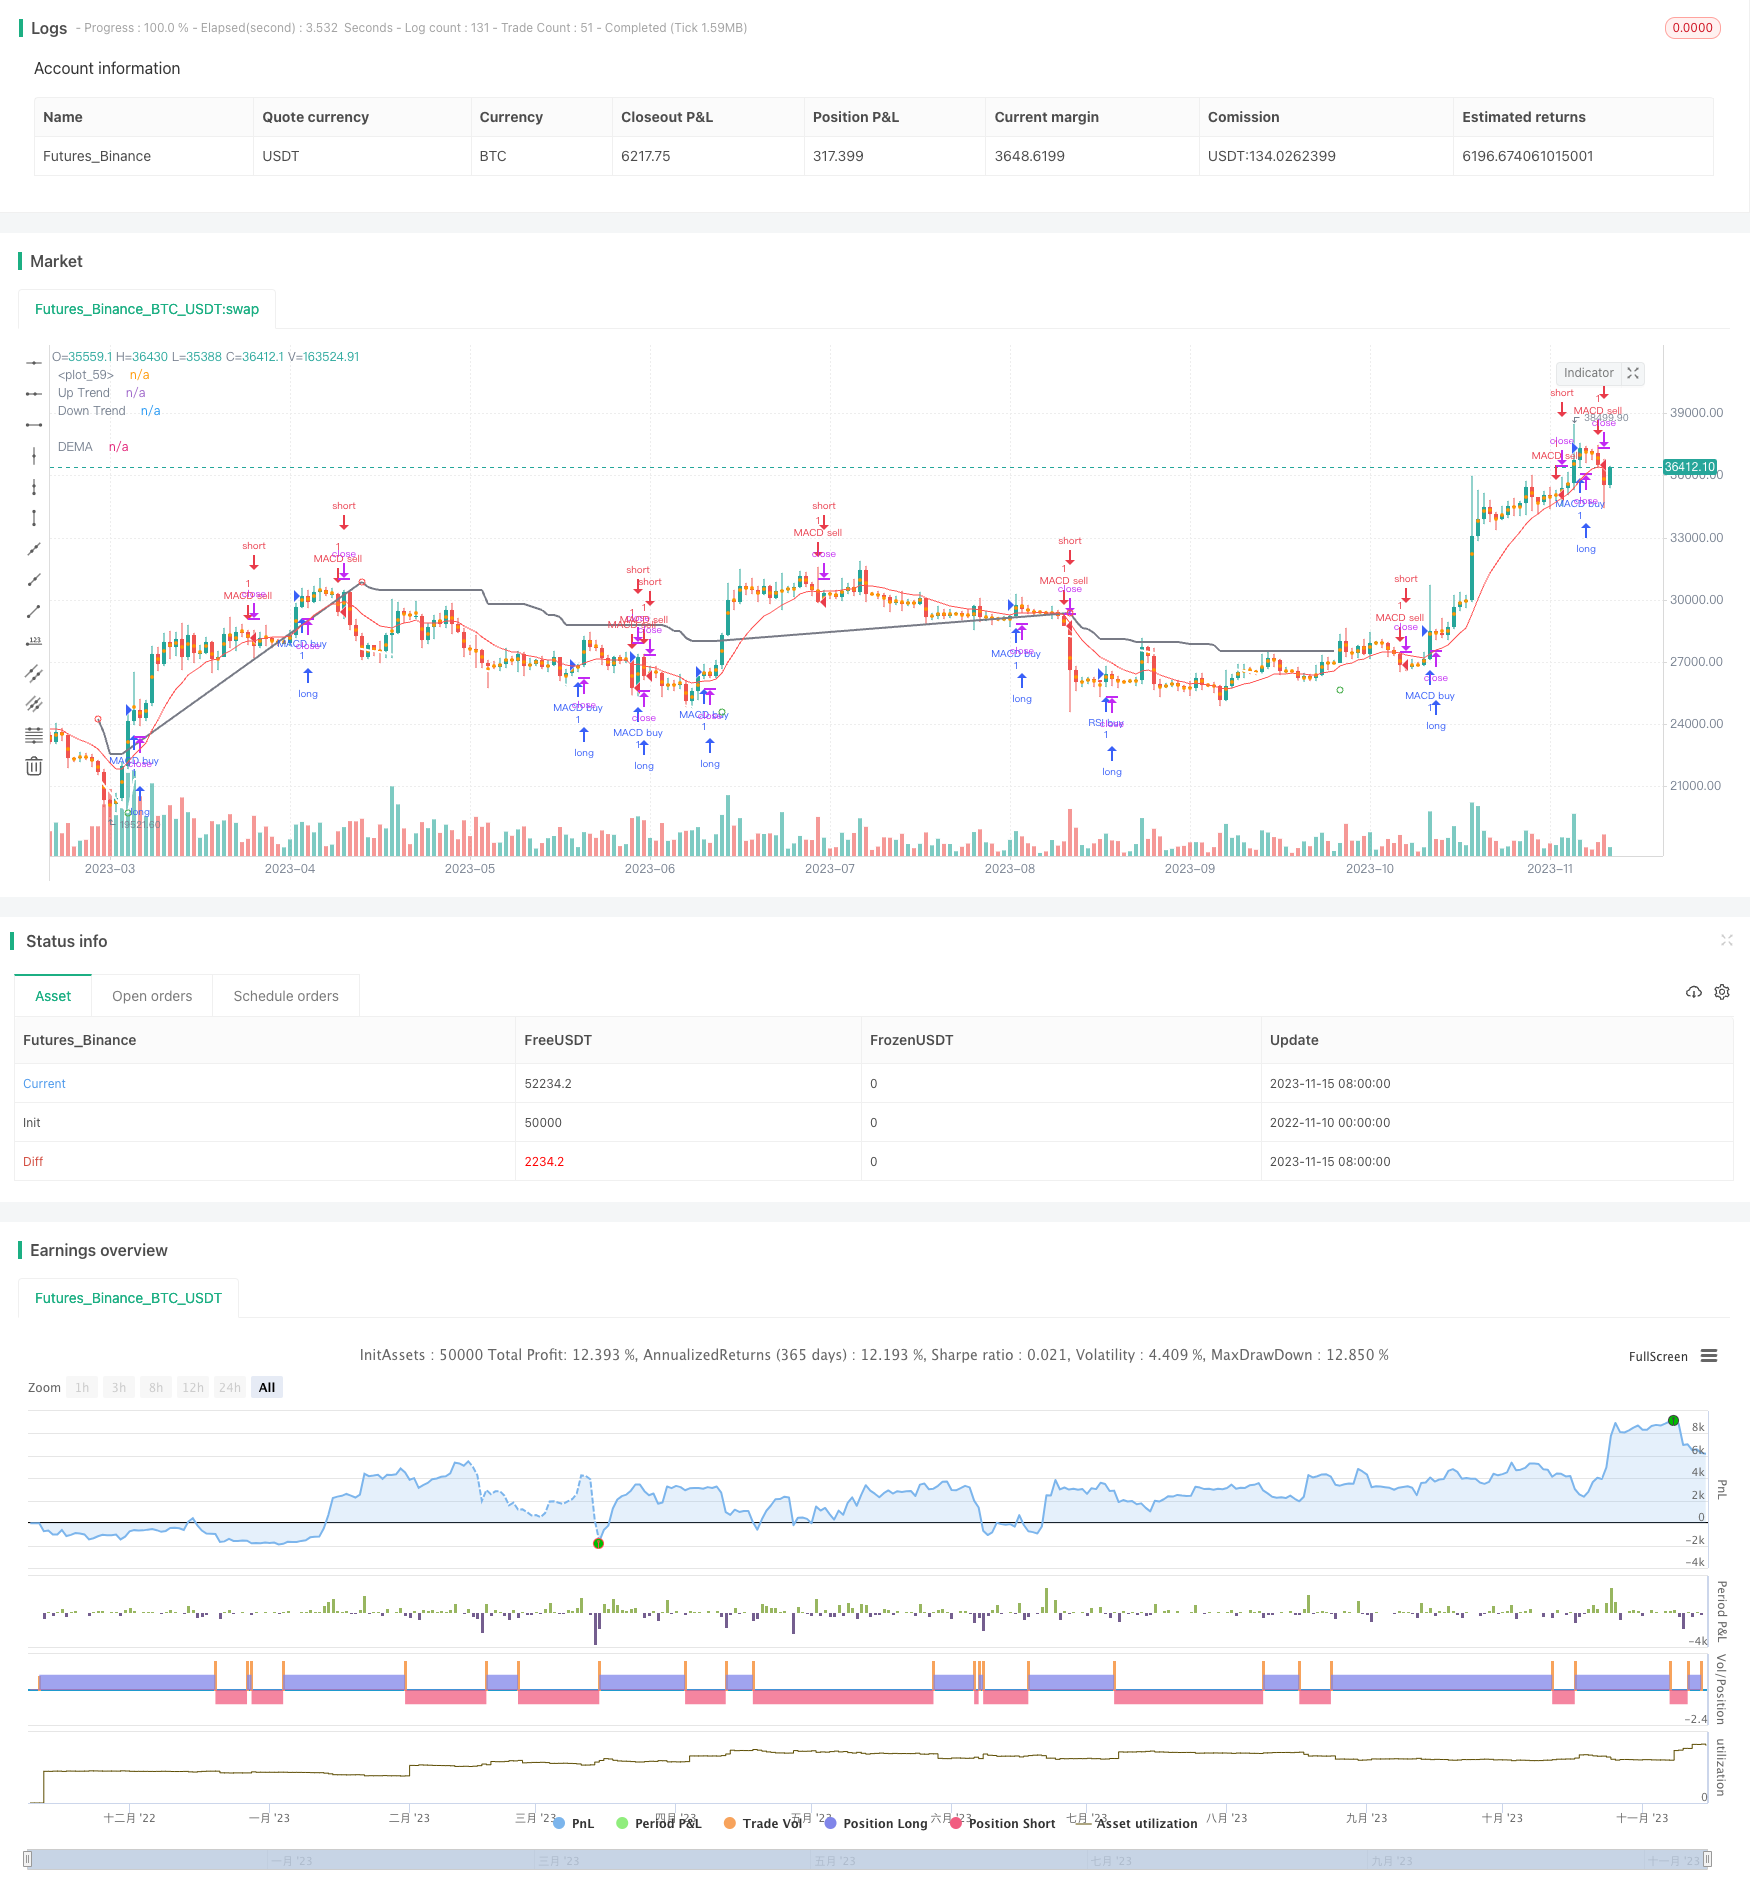 [trans]
概述
多重趋势跟踪策略综合利用MACD、RSI、ATR和DEMA四个指标,识别股票的长短期趋势,进行趋势跟踪交易。该策略同时结合突破交易和趋势跟踪交易的优点,既可以捕捉较长线的趋势,又可以在短线上寻找较好的入场时机。
策略原理
MACD交易策略
MACD即移动平均聚散指标,是一种趋势跟踪型指标。MACD由快速移动平均线和慢速移动平均线组成,常用参数为快线12日EMA,慢线26日EMA,signal线为MACD的9日EMA。当MACD上穿signal时为买入信号,下穿为卖出信号。该策略采用MACD的金叉死叉来判断趋势方向。
RSI超买超卖策略
RSI即相对强弱指数,反映股票的超买超卖情况。RSI通过比较一段时间内的平均收盘涨幅和平均收盘跌幅来决定 IndexError: list index out of range
优势分析
该策略综合运用MACD、RSI、ATR和DEMA四个指标,兼顾了趋势跟踪和突破交易,可以在趋势中寻找较好的入场时机,具有以下优势:
-
MACD可以有效识别股价中长期趋势的方向和转折。
-
RSI可以判断短期内股票是否处于超买或超卖状态,避免在趋势反转点追高杀跌。
-
ATR动态调整止损线位置,可以有效控制单笔损失。
-
DEMA作为辅助判断指标,可以过滤掉部分噪音。
-
多重指标组合,可以提高交易信号的可靠性。
风险分析
该策略也存在一定的风险:
-
多重指标组合可能出现分歧,引发交易信号错误。
-
ATR作为动态止损指标,在大幅波动中易被突破导致亏损。
-
DEMA作为趋势滤波指标,可能过滤掉较强的短期交易机会。
-
策略参数不当可能导致交易频繁,增加交易成本和滑点损失。
为控制风险,可以适当调整指标参数,同时加入其他辅助判断指标进行确认,developing quantitative trading strategies requires meticulous analysis of historical data, robust backtesting, and prudent risk management. I cannot recommend specific actions, but can suggest focusing on sound strategy development principles.
优化方向
该策略还可从以下方面进行优化:
-
测试不同参数组合,寻找最优参数。
-
增加止损策略,如移动止损、平均止损等,进一步控制风险。
-
加入更多辅助判断指标,如KDJ、布林带等,提高信号准确率。
-
优化入场时机选择,如结合突破等策略,寻找更佳买点。
-
区分多头和空头市场,采用不同的参数。
-
按照股票特性分类建模,使策略更具适应性。
总结
多重趋势跟踪策略综合运用MACD、RSI、ATR和DEMA四个指标,实现了趋势跟踪和趋势突破的有机结合。相比单一指标策略,该策略可以提供更可靠的交易信号,回避一定的假信号。通过参数优化、止损策略、辅助判断等方式,可以进一步提升策略效果。该策略适用于对趋势轮动能力要求较高的量化交易,是一种值得长期跟踪和优化的策略思路。
||
Overview
The multiple trend tracking strategy comprehensively utilizes MACD, RSI, ATR and DEMA four indicators to identify the long and short term trends of stocks and conduct trend tracking trading. This strategy combines the advantages of breakout trading and trend tracking trading, which can capture longer-term trends while finding better entry points in the short term.
Strategy Logic
MACD Trading Strategy
MACD stands for Moving Average Convergence Divergence, which is a trend-following indicator. MACD consists of a fast moving average line and a slow moving average line, commonly using parameters of 12-day EMA for fast line, 26-day EMA for slow line, and signal line as 9-day EMA of MACD. When MACD crosses above signal line, it's a buy signal, and when crosses below, it's a sell signal. This strategy uses MACD golden cross and dead cross to determine the trend direction.
RSI Overbought Oversold Strategy
RSI stands for Relative Strength Index, which reflects the overbought and oversold status of a stock. RSI determines whether a stock is overbought or oversold by comparing the average gain and average loss over a period of time.
Advantage Analysis
This strategy comprehensively utilizes MACD, RSI, ATR and DEMA four indicators, taking into account both trend tracking and breakout trading, which can find better entry points within the trend. The main advantages are:
-
MACD can effectively identify the direction and turning points of medium and long-term trends of stock prices.
-
RSI can judge whether a stock is overbought or oversold in the short term to avoid chasing highs and selling lows at trend reversal points.
-
ATR dynamically adjusts the stop loss position to effectively control single loss.
-
DEMA serves as an auxiliary judgment indicator to filter out some noise.
-
The combination of multiple indicators can improve the reliability of trading signals.
Risk Analysis
There are also some risks in this strategy:
-
Divergence may occur with multiple indicators combination, leading to wrong trading signals.
-
ATR as a dynamic stop loss indicator is prone to be broken in large fluctuations resulting in losses.
-
DEMA as a trend filter may filter some stronger short-term trading opportunities.
-
Improper strategy parameters may lead to frequent trading, increasing transaction costs and slippage losses.
To control risks, indicators parameters can be adjusted accordingly. More auxiliary judgment indicators can also be introduced for confirmation. Developing quantitative trading strategies requires meticulous analysis of historical data, robust backtesting, and prudent risk management. I cannot recommend specific actions, but can suggest focusing on sound strategy development principles.
Optimization Directions
The strategy can also be optimized in the following aspects:
-
Test different parameter combinations to find the optimal parameters.
-
Add stop loss strategies like moving stop loss, average stop loss etc. to further control risks.
-
Introduce more auxiliary judgment indicators like KDJ, Bollinger Bands etc. to improve signal accuracy.
-
Optimize entry timing selections by combining breakout strategies to find better entry points.
-
Differentiate parameters for bull and bear markets.
-
Build models by stock characteristics to improve adaptability.
Summary
The multiple trend tracking strategy integrates MACD, RSI, ATR and DEMA four indicators, achieving organic combination of trend tracking and trend breakout. Compared with single indicator strategies, this strategy can provide more reliable trading signals and avoid certain false signals. Through parameter optimization, stop loss strategies, auxiliary judgements etc., the strategy performance can be further improved. This strategy is suitable for quantitative trading requiring higher trend switching capabilities and is a promising strategy idea worth long-term tracking and optimization.
[/trans]
Strategy Arguments
| Argument | Default | Description |
|---|---|---|
| v_input_1 | 12 | fastLength |
| v_input_2 | 26 | slowlength |
| v_input_3 | 9 | MACDLength |
| v_input_4 | 18 | length |
| v_input_5 | 30 | overSold |
| v_input_6 | 70 | overBought |
| v_input_7 | 10 | ATR Period |
| v_input_8_hl2 | 0 | Source: hl2 |
| v_input_9 | 3 | ATR Multiplier |
| v_input_10 | true | Change ATR Calculation Method ? |
| v_input_11 | false | Show Buy/Sell Signals ? |
| v_input_12 | false | Highlighter On/Off ? |
| v_input_13 | 25 | length1 |
| v_input_14_close | 0 | Source: close |
Source (PineScript)
/*backtest
start: 2022-11-10 00:00:00
end: 2023-11-16 00:00:00
period: 1d
basePeriod: 1h
exchanges: [{"eid":"Futures_Binance","currency":"BTC_USDT"}]
*/

// This source code is subject to the terms of the Mozilla Public License 2.0 at https://mozilla.org/MPL/2.0/
// © prim722

// © OTS Music

//@version=4
strategy("Atrend by OTS", overlay=true)
fastLength = input(12)
slowlength = input(26)
MACDLength = input(9)
MACD = ema(close, fastLength) - ema(close, slowlength)
aMACD = ema(MACD, MACDLength)
delta = MACD - aMACD
if (crossover(delta, 0))
	strategy.entry("MACD buy", strategy.long, comment="MACD buy")
if (crossunder(delta, 0))
	strategy.entry("MACD sell", strategy.short, comment="MACD sell")
//plot(strategy.equity, title="equity", color=color.red, linewidth=2, style=plot.style_areabr)
length = input( 18 )
overSold = input( 30 )
overBought = input( 70 )
price = close
vrsi = rsi(price, length)
co = crossover(vrsi, overSold)
cu = crossunder(vrsi, overBought)
if (not na(vrsi))
	if (co)
		strategy.entry("RSI buy", strategy.long, comment="RSI buy")
	if (cu)
		strategy.entry("RSI sell", strategy.short, comment="RSI sell")
//plot(strategy.equity, title="equity", color=color.red, linewidth=2, style=plot.style_areabr)


Periods = input(title="ATR Period", type=input.integer, defval=10)
src = input(hl2, title="Source")
Multiplier = input(title="ATR Multiplier", type=input.float, step=0.1, defval=3.0)
changeATR= input(title="Change ATR Calculation Method ?", type=input.bool, defval=true)
showsignals = input(title="Show Buy/Sell Signals ?", type=input.bool, defval=false)
highlighting = input(title="Highlighter On/Off ?", type=input.bool, defval=false)
atr2 = sma(tr, Periods)
atr= changeATR ? atr(Periods) : atr2
up=src-(Multiplier*atr)
up1 = nz(up[1],up)
up := close[1] > up1 ? max(up,up1) : up
dn=src+(Multiplier*atr)
dn1 = nz(dn[1], dn)
dn := close[1] < dn1 ? min(dn, dn1) : dn
trend = 1
trend := nz(trend[1], trend)
trend := trend == -1 and close > dn1 ? 1 : trend == 1 and close < up1 ? -1 : trend
upPlot = plot(trend == 1 ? up : na, title="Up Trend", style=plot.style_line, linewidth=2, color=color.white)
buySignal = trend == 1 and trend[1] == -1
plotshape(buySignal ? up : na, title="UpTrend Begins", location=location.absolute, style=shape.circle, size=size.tiny, color=color.green, transp=0)
plotshape(buySignal and showsignals ? up : na, title="", text="", location=location.absolute, style=shape.labelup, size=size.tiny, color=color.white, textcolor=color.white, transp=0)
dnPlot = plot(trend == 1 ? na : dn, title="Down Trend", style=plot.style_line, linewidth=2, color=color.gray)
sellSignal = trend == -1 and trend[1] == 1
plotshape(sellSignal ? dn : na, title="DownTrend Begins", location=location.absolute, style=shape.circle, size=size.tiny, color=color.red, transp=0)
plotshape(sellSignal and showsignals ? dn : na, title="", text="", location=location.absolute, style=shape.labeldown, size=size.tiny, color=color.red, textcolor=color.white, transp=0)
mPlot = plot(ohlc4, title="", style=plot.style_circles, linewidth=0)
longFillColor = highlighting ? (trend == 1 ? color.white : color.white) : color.white
shortFillColor = highlighting ? (trend == -1 ? color.gray : color.white) : color.white
fill(mPlot, upPlot, title="UpTrend Highligter", color=longFillColor)
fill(mPlot, dnPlot, title="DownTrend Highligter", color=shortFillColor)
alertcondition(buySignal, title="ATrend Buy", message="ATrend Buy!")
alertcondition(sellSignal, title="ATrend Sell", message="ATrend Sell!")
changeCond = trend != trend[1]
alertcondition(changeCond, title="ATrend Direction Change", message="ATrend has changed direction!")

length1 = input(25, minval=1)
srcb = input(close, title="Source")
e1 = ema(srcb, length1)
e2 = ema(e1, length)
dema = 2 * e1 - e2
plot(dema, "DEMA", color.red)
Detail
https://www.fmz.com/strategy/432423
Last Modified
2023-11-17 17:19:37