
6.9 KiB
Name
多空力量策略回测Bull-and-Bear-Power-Backtest-Strategy
Author
ChaoZhang
Strategy Description
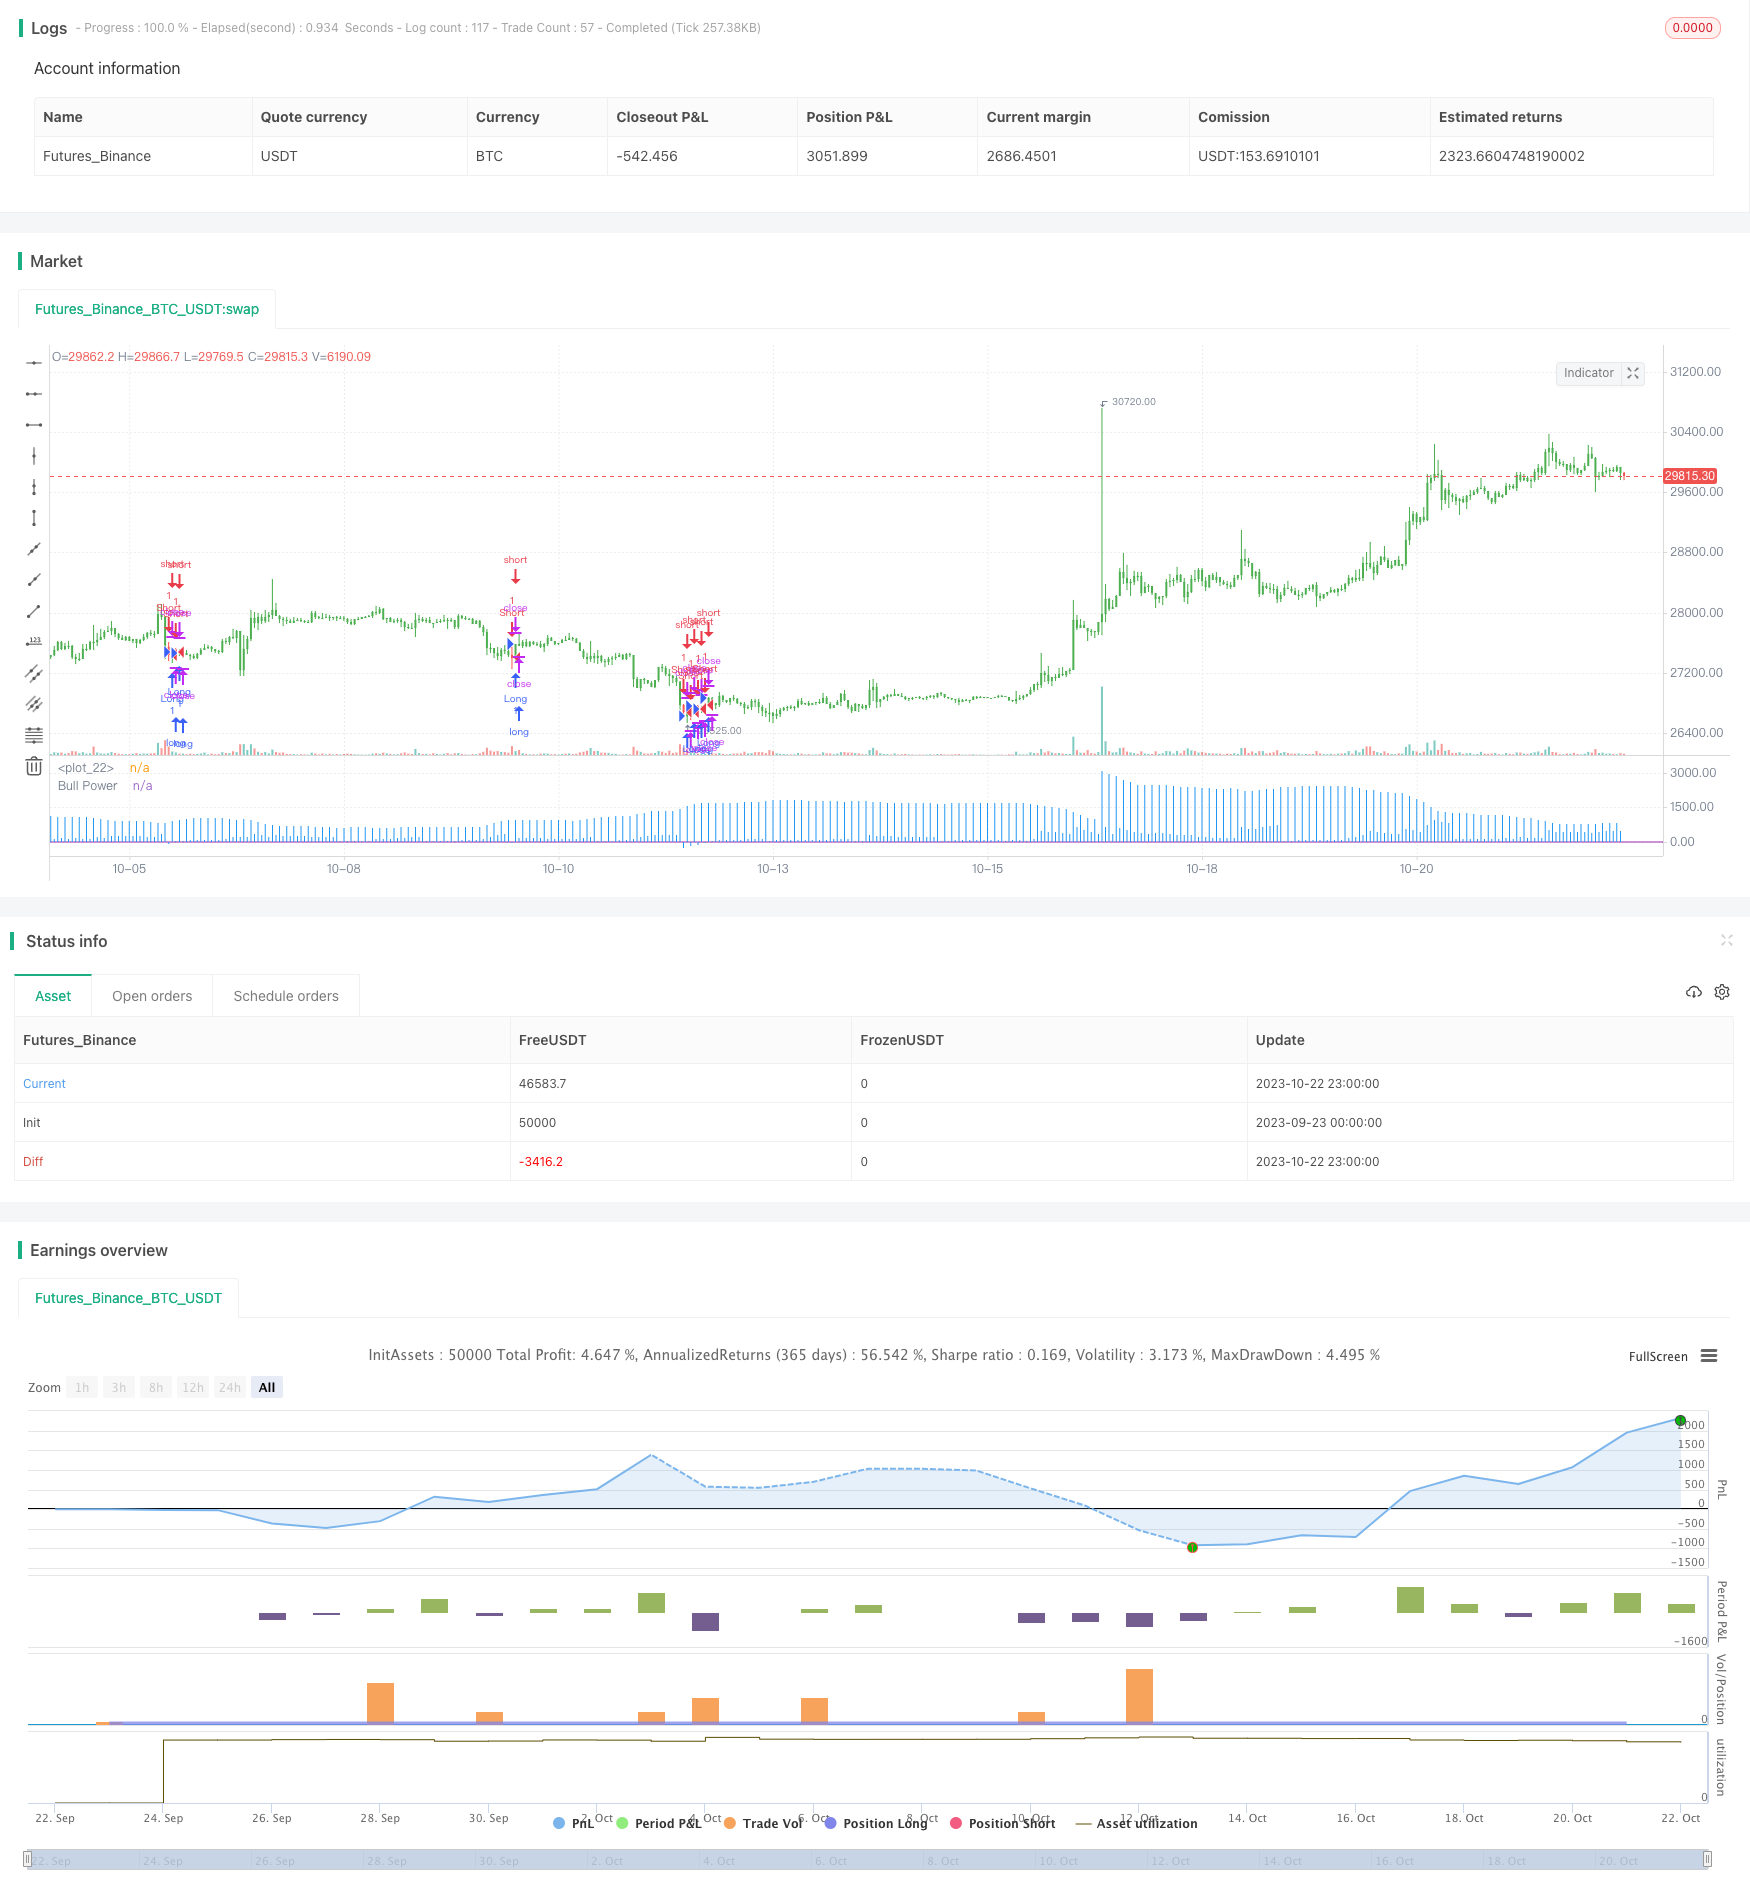
[trans]
概述
多空力量策略是由Alexander Elder博士开发的,它通过Elder-ray指标来衡量市场的买入和卖出压力。Elder-ray指标通常与三屏交易系统一起使用,但也可以单独使用。
Alexander Elder博士使用13日指数移动平均线(EMA)来表示市场价值的共识。多头力量反映买方将价格推高于价值共识的能力。空头力量反映卖方将价格压低于平均价值共识的能力。
多头力量通过高点减去13日EMA计算。空头力量通过低点减去13日EMA计算。
策略原理
该策略通过计算多空力量指标来判断市场的多空态势。
- 计算13日EMA作为市场价值共识
- 计算多头力量:当日最高价减去13日EMA
- 计算空头力量:当日最低价减去13日EMA
- 比较多头力量和空头力量与阈值的关系,判断做多做空信号
- 可以选择反向交易
当多头力量大于阈值时为做多信号,当空头力量大于阈值时为做空信号。且可以选择反向交易。
优势分析
- 使用多空力量指标判断市场多空态势,简单易懂
- 可配置参数灵活,阈值和周期可调
- 可选择反向交易,适应不同市场环境
- 采用指数移动平均线,对突发事件敏感度较低
风险分析
- 多空力量指标容易产生错误信号,需结合趋势和其他指标过滤
- 固定周期无法适应市场变化,可采用自适应周期优化
- 不存在止损,容易追随市场产生过大亏损
- 仅判断多空,缺乏入市时机选择
可设置止损,优化移动平均线周期,结合趋势指标等进行优化。
优化方向
- 优化移动平均线周期参数,使用自适应周期EMA
- 加入趋势指标过滤,避免逆势交易
- 增加止损策略,控制单笔亏损
- 结合其他指标选择更佳入市时机
- 运用机器学习技术优化参数设置
总结
多空力量策略通过Elder-ray指标判断市场多空态势,简单直观,参数可配置。但容易产生错误信号,需进一步优化加入趋势判断和止损。该策略思路值得学习借鉴,但直接应用需谨慎。
||
Overview
The Bull and Bear Power strategy was developed by Dr. Alexander Elder using the Elder-ray indicator to measure buying and selling pressure in the market. The Elder-ray is often used with the Triple Screen system but can also be used on its own.
Dr. Elder uses a 13-period exponential moving average (EMA) to indicate the market consensus of value. Bull power measures the ability of buyers to drive prices above the consensus of value. Bear power reflects the ability of sellers to drive prices below the average consensus of value.
Bull power is calculated by subtracting the 13-period EMA from the high. Bear power subtracts the 13-period EMA from the low.
Strategy Logic
The strategy judges market sentiment through calculating bull and bear power indicators.
- Calculate 13-period EMA as market value consensus
- Calculate bull power: High minus 13-period EMA
- Calculate bear power: Low minus 13-period EMA
- Compare bull power and bear power with threshold to determine long and short signals
- Option to trade reverse signals
When bull power is greater than threshold, it's long signal. When bear power is greater than threshold, it's short signal. Reverse trading can be selected.
Advantage Analysis
- Simple and intuitive using bull and bear power indicators to judge market sentiment
- Flexible configuration of parameters, adjustable threshold and period
- Option for reverse trading adapts to different market environments
- Uses exponential moving average, less sensitive to outliers
Risk Analysis
- Prone to false signals, needs combining with trend and other filters
- Fixed period cannot adapt to market changes, adaptive period can optimize
- No stop loss, easily chasing market with huge losses
- Only judges long or short, lacks timing selection
Can add stop loss, optimize moving average period, combine with trend filter etc.
Optimization Directions
- Optimize moving average period, use adaptive period EMA
- Add trend filter to avoid counter trend trading
- Add stop loss to control single trade loss
- Combine other indicators to select better entry timing
- Utilize machine learning to optimize parameters
Conclusion
The Bull and Bear Power strategy judges market sentiment simply and intuitively with configurable parameters. But it's prone to false signals and needs further optimization with trend and stop loss. The logic is worth learning but direct application needs caution.
[/trans]
Strategy Arguments
| Argument | Default | Description |
|---|---|---|
| v_input_1 | 13 | Length |
| v_input_2 | false | Trigger |
| v_input_3 | false | Trade reverse |
Source (PineScript)
/*backtest
start: 2023-09-23 00:00:00
end: 2023-10-23 00:00:00
period: 1h
basePeriod: 15m
exchanges: [{"eid":"Futures_Binance","currency":"BTC_USDT"}]
*/

//@version = 2
////////////////////////////////////////////////////////////
//  Copyright by HPotter v1.0 08/12/2016
// Developed by Dr Alexander Elder, the Elder-ray indicator measures buying
// and selling pressure in the market. The Elder-ray is often used as part
// of the Triple Screen trading system but may also be used on its own.
// Dr Elder uses a 13-day exponential moving average (EMA) to indicate the
// market consensus of value. Bull Power measures the ability of buyers to
// drive prices above the consensus of value. Bear Power reflects the ability
// of sellers to drive prices below the average consensus of value.
// Bull Power is calculated by subtracting the 13-day EMA from the day's High.
// Bear power subtracts the 13-day EMA from the day's Low.
//
// You can use in the xPrice any series: Open, High, Low, Close, HL2, HLC3, OHLC4 and ect...
// You can change long to short in the Input Settings
// Please, use it only for learning or paper trading. Do not for real trading.
////////////////////////////////////////////////////////////
strategy(title="Elder Ray (Bull Power) Strategy Backtest")
Length = input(13, minval=1)
Trigger = input(0)
reverse = input(false, title="Trade reverse")
hline(0, color=purple, linestyle=line)
xPrice = close
xMA = ema(xPrice,Length)
DayHigh = iff(dayofmonth != dayofmonth[1], high, max(high, nz(DayHigh[1])))
nRes = DayHigh - xMA
pos = iff(nRes > Trigger, 1,
	   iff(nRes < Trigger, -1, nz(pos[1], 0)))
possig = iff(reverse and pos == 1, -1,
         iff(reverse and pos == -1, 1, pos))
if (possig == 1)
    strategy.entry("Long", strategy.long)
if (possig == -1)
    strategy.entry("Short", strategy.short)
barcolor(possig == -1 ? red: possig == 1 ? green : blue )
plot(nRes, color=blue, title="Bull Power", style = histogram)
Detail
https://www.fmz.com/strategy/430065
Last Modified
2023-10-24 16:43:52