
7.0 KiB
Name
多时间轴均线策略Multi-Timeframe-Moving-Average-Strategy
Author
ChaoZhang
Strategy Description
 [trans]
概述
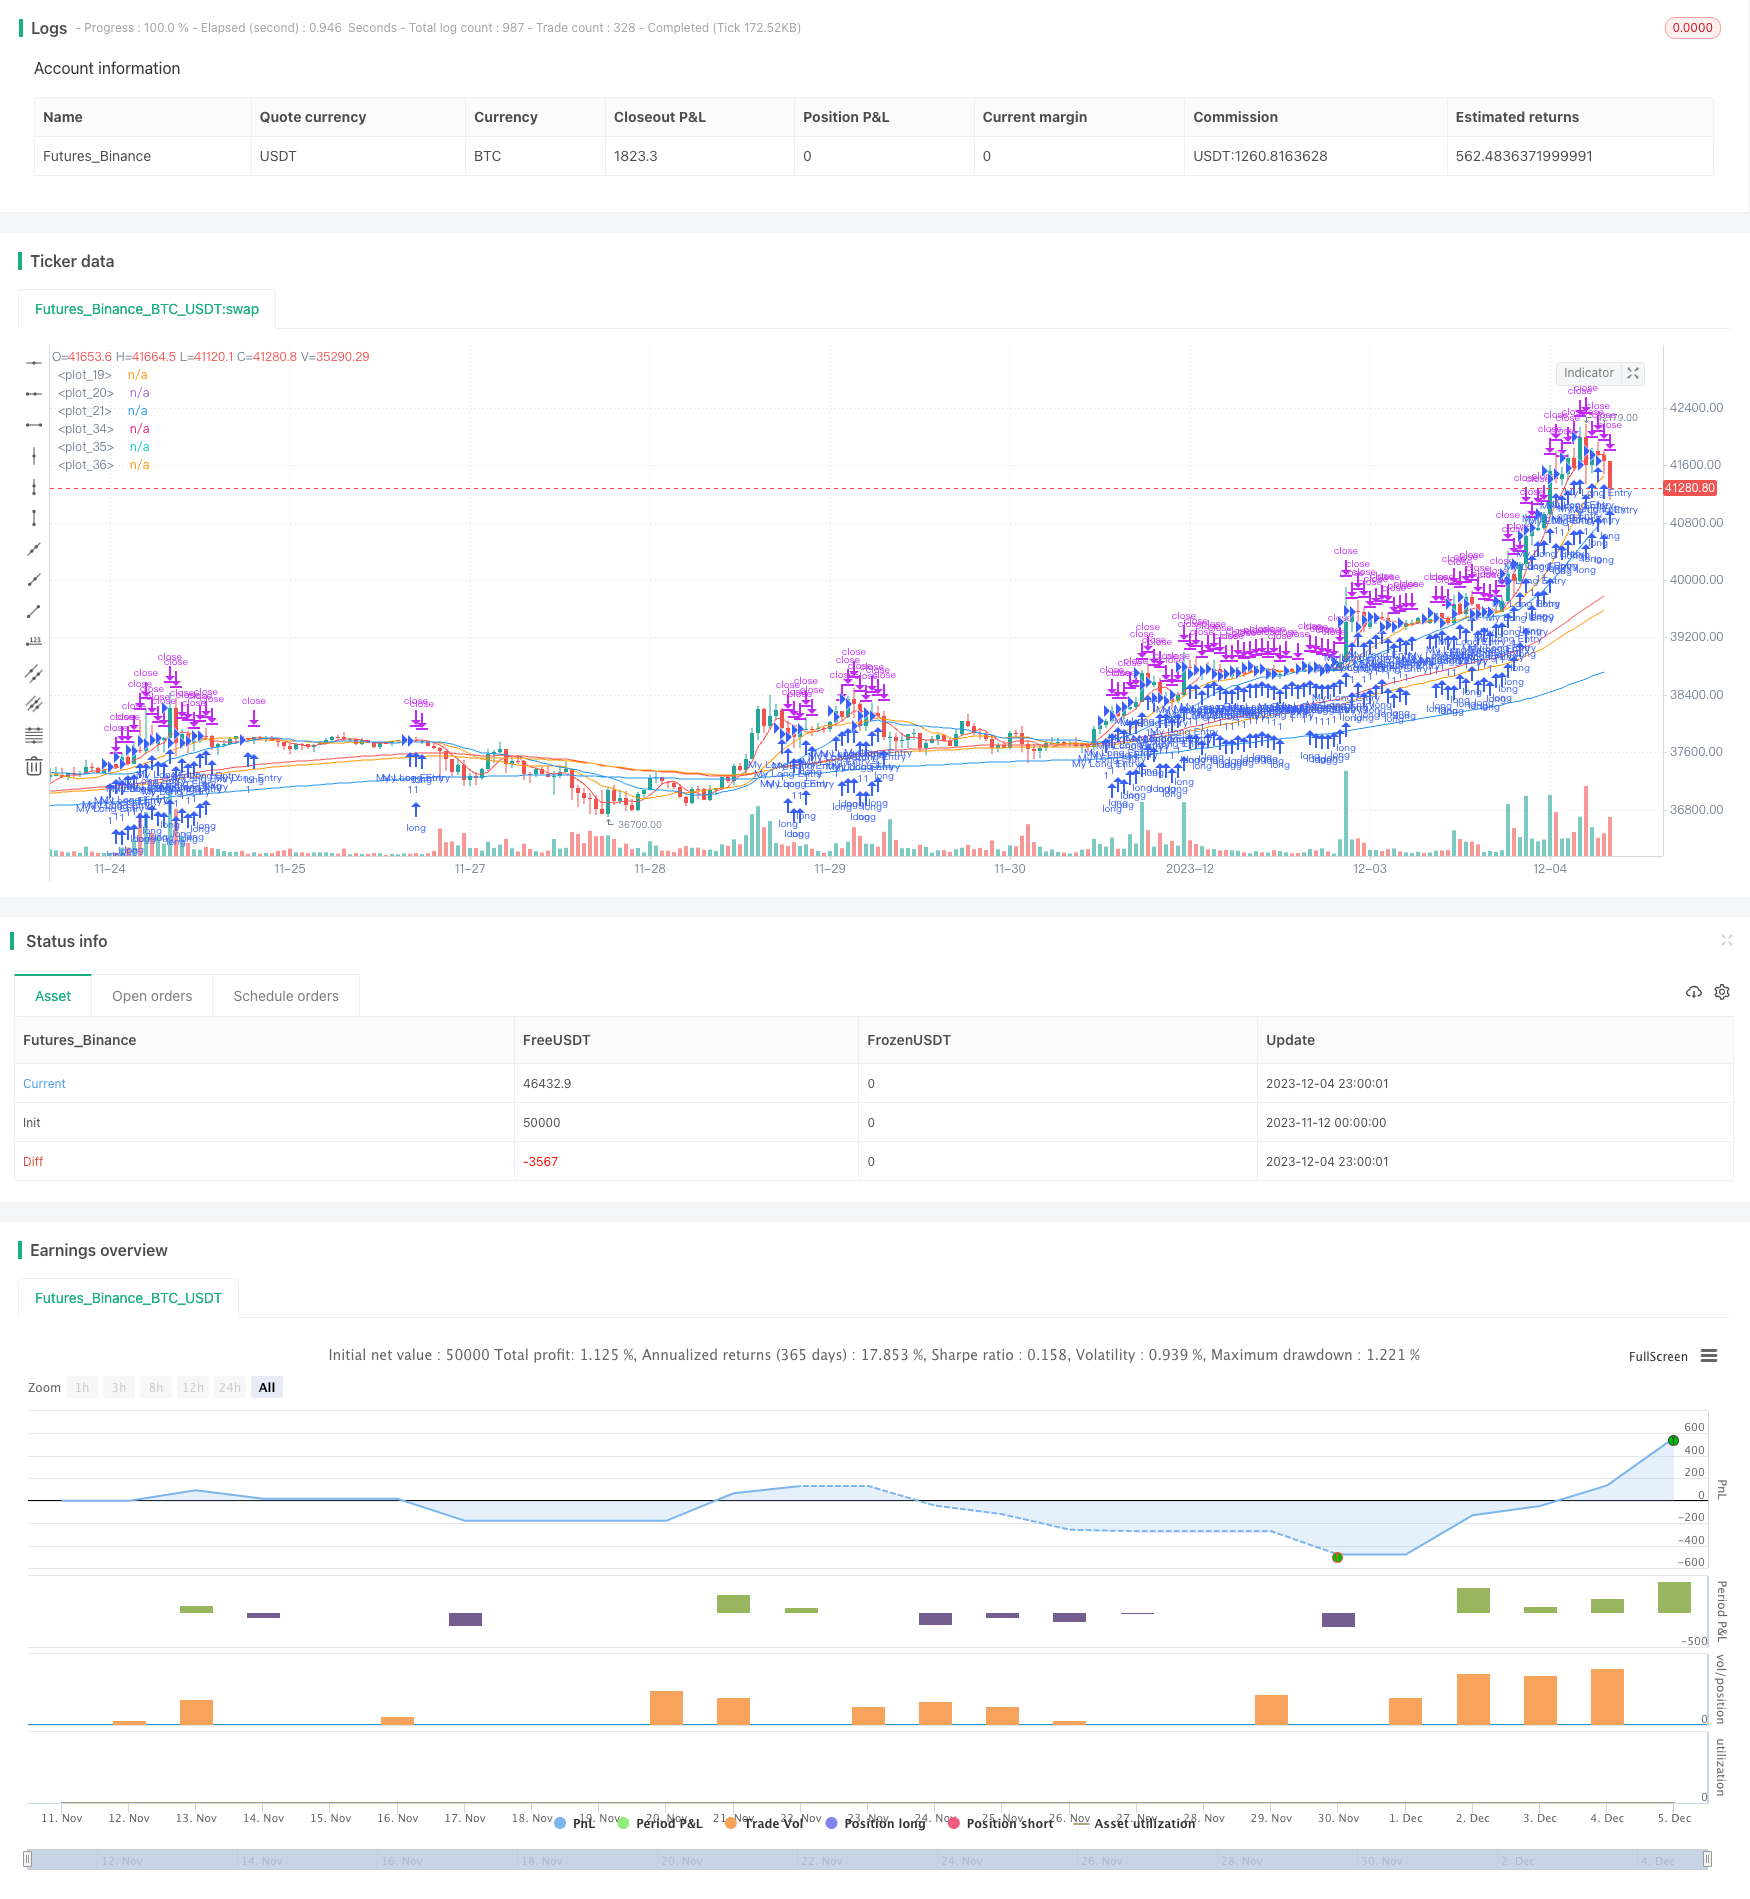
本策略运用不同时间轴的移动平均线和指数移动平均线作为买卖信号,实现追涨杀跌的目的。根据短期均线的位置和走势判断市场趋势和转折点,根据长期均线判断大趋势。该策略同时使用简单移动平均线(SMA)和指数移动平均线(EMA)作为技术指标,能够有效过滤市场噪音,判断价格走势。
策略原理
本策略使用5日、13日、21日的SMA,以及75日、90日、200日的EMA作为买卖信号。具体逻辑是:
当短期SMA(5日线、13日线、21日线)顺序排列(5日线在上、13日线其次、21日线最下),并且所有短期SMA高于长期EMA(75日线、90日线、200日线)时,做多;
当短期SMA(5日线、13日线、21日线)顺序排列(5日线在下、13日线其次、21日线最上),并且所有短期SMA低于长期EMA(75日线、90日线、200日线)时,做空。
这样通过组合使用不同周期的SMA和EMA,可以有效判断价格短期和长期趋势,实现以短带长的趋势策略。
优势分析
该策略具有以下优势:
-
使用双重均线指标,能有效过滤市场噪音,准确判断价格趋势。
-
多时间轴设置,短周期判定短期趋势,长周期确定大趋势,实现以快带慢。
-
SMA对价格变化敏感,EMA对价格变化平滑,两者结合使用效果更好。
-
追涨杀跌的逻辑简单直接,容易操作。
风险分析
该策略也存在一定的风险:
-
多时间轴设置较复杂,参数调整和优化难度大。
-
短期和长期指标可能会出现背离,发出错误信号。
-
仅基于均线指标,在剧烈行情时效果可能不佳。
-
存在一定的滞后,无法及时捕捉转折点。
优化方向
本策略可以从以下几个方面进行优化:
-
增加其他技术指标过滤信号,如KDJ、MACD等,提高策略准确性。
-
对短期和长期均线的周期和数量进行测试和优化,找到最佳参数组合。
-
增加止损机制,以控制风险和 DD。
-
结合量能指标,避免价格剧烈拉升下的假突破。
总结
本策略通过运用双重均线和多时间轴分析,实现简单有效的趋势追踪。策略思路清晰易于理解,有一定的实用价值。但也存在一些问题有待改进,如参数优化、风险控制等。总体来说,本策略为量化交易提供了valuable的思路,值得深入研究和探讨。
||
Overview
This strategy uses moving averages and exponential moving averages of different timeframes as trading signals to chase rises and kill drops. It judges the market trend and inflection points according to the location and trend of short-term moving averages and determines the major trend according to long-term moving averages. The strategy combines Simple Moving Average (SMA) and Exponential Moving Average (EMA) as technical indicators to effectively filter market noise and determine price trends.
Strategy Logic
The strategy uses 5-day, 13-day, 21-day SMA and 75-day, 90-day, 200-day EMA as trading signals. The specific logic is:
When the short-term SMAs (5-day, 13-day, 21-day) are arranged in order (5-day on the top, 13-day next, 21-day at the bottom) and all short-term SMAs are above the long-term EMAs (75-day, 90-day, 200-day), go long;
When the short-term SMAs (5-day, 13-day, 21-day) are arranged in order (5-day at the bottom, 13-day next, 21-day at the top) and all short-term SMAs are below the long-term EMAs (75-day, 90-day, 200-day), go short.
By combining SMAs and EMAs of different cycles, it can effectively judge short-term and long-term price trends to implement a trend-following strategy.
Advantage Analysis
The strategy has the following advantages:
-
Using dual moving average indicators can effectively filter market noise and accurately determine price trends.
-
Multi timeframe settings, with short cycles to determine short-term trends and long cycles to determine major trends, achieving fast with slow.
-
SMA is sensitive to price changes while EMA smoothes price changes, combining the two works better.
-
The logic of chasing rises and killing drops is simple and direct, easy to operate.
Risk Analysis
The strategy also has some risks:
-
Multi timeframe settings are quite complex with difficulties in parameter tuning and optimization.
-
Divergence may occur between short-term and long-term indicators, giving wrong signals.
-
Based solely on moving average indicators, may underperform in extreme market conditions.
-
There is a certain lag, unable to timely capture inflection points.
Optimization
The strategy can be optimized in the following aspects:
-
Add other technical indicators for signal filtering such as KDJ, MACD etc. to improve strategy accuracy.
-
Test and optimize periods and numbers of short-term and long-term moving averages to find optimal parameter combinations.
-
Add stop loss mechanisms to control risk and DD.
-
Combine volume indicators to avoid false breakouts under sharp price surges.
Conclusion
The strategy realizes simple and effective trend tracking by using dual moving averages and multi timeframe analysis. The strategy idea is clear and easy to understand with certain practical value. But there is still room for improvement such as parameter optimization, risk control etc. Overall, the strategy provides valuable ideas for quantitative trading, which is worth in-depth research and discussion.
[/trans]
Source (PineScript)
/*backtest
start: 2023-11-12 00:00:00
end: 2023-12-05 00:00:00
period: 1h
basePeriod: 15m
exchanges: [{"eid":"Futures_Binance","currency":"BTC_USDT"}]
*/

//@version=4
strategy(title="my_strategy_name", shorttitle="MS1", overlay=true )


source = close


// MAの長さ
len1 = 5
len2 = 13
len3 = 21

// MAの計算
ma1 = sma(source, len1)
ma2 = sma(source, len2)
ma3 = sma(source, len3)

// 計算したMAをプロットする
plot(ma1,color=color.red)
plot(ma2,color=color.orange)
plot(ma3,color=color.blue)

// EMAの長さ
len4 = 75
len5 = 90
len6 = 200

// MAの計算
ema1 = ema(source, len4)
ema2 = ema(source, len5)
ema3 = ema(source, len6)

// 計算したMAをプロットする
plot(ema1,color=color.red)
plot(ema2,color=color.orange)
plot(ema3,color=color.blue)

longCondition = (ma1>ma2 and ma2>ma3 and ma3>ema1 and ema1>ema2 and ema2>ema3)//ロングにエントリーする条件
if (longCondition)
    strategy.entry("My Long Entry", strategy.long, comment="Long")

shortCondition = (ma1<ma2 and ma2<ma3 and ma3<ema1 and ema1<ema2 and ema2<ema3)//ショートにエントリーする条件
if (shortCondition)
    strategy.entry("My Short Entry", strategy.short, comment="Short")

    //エグジット条件
strategy.exit("My Long Exit", "My Long Entry", profit=200, loss=100)
strategy.exit("My Short Exit", "My Short Entry", profit=200, loss=100)
Detail
https://www.fmz.com/strategy/435249
Last Modified
2023-12-13 15:34:09