
9.1 KiB
Name
多时间框架趋势追踪策略Multi-Timeframe-Trend-Tracking-Strategy
Author
ChaoZhang
Strategy Description
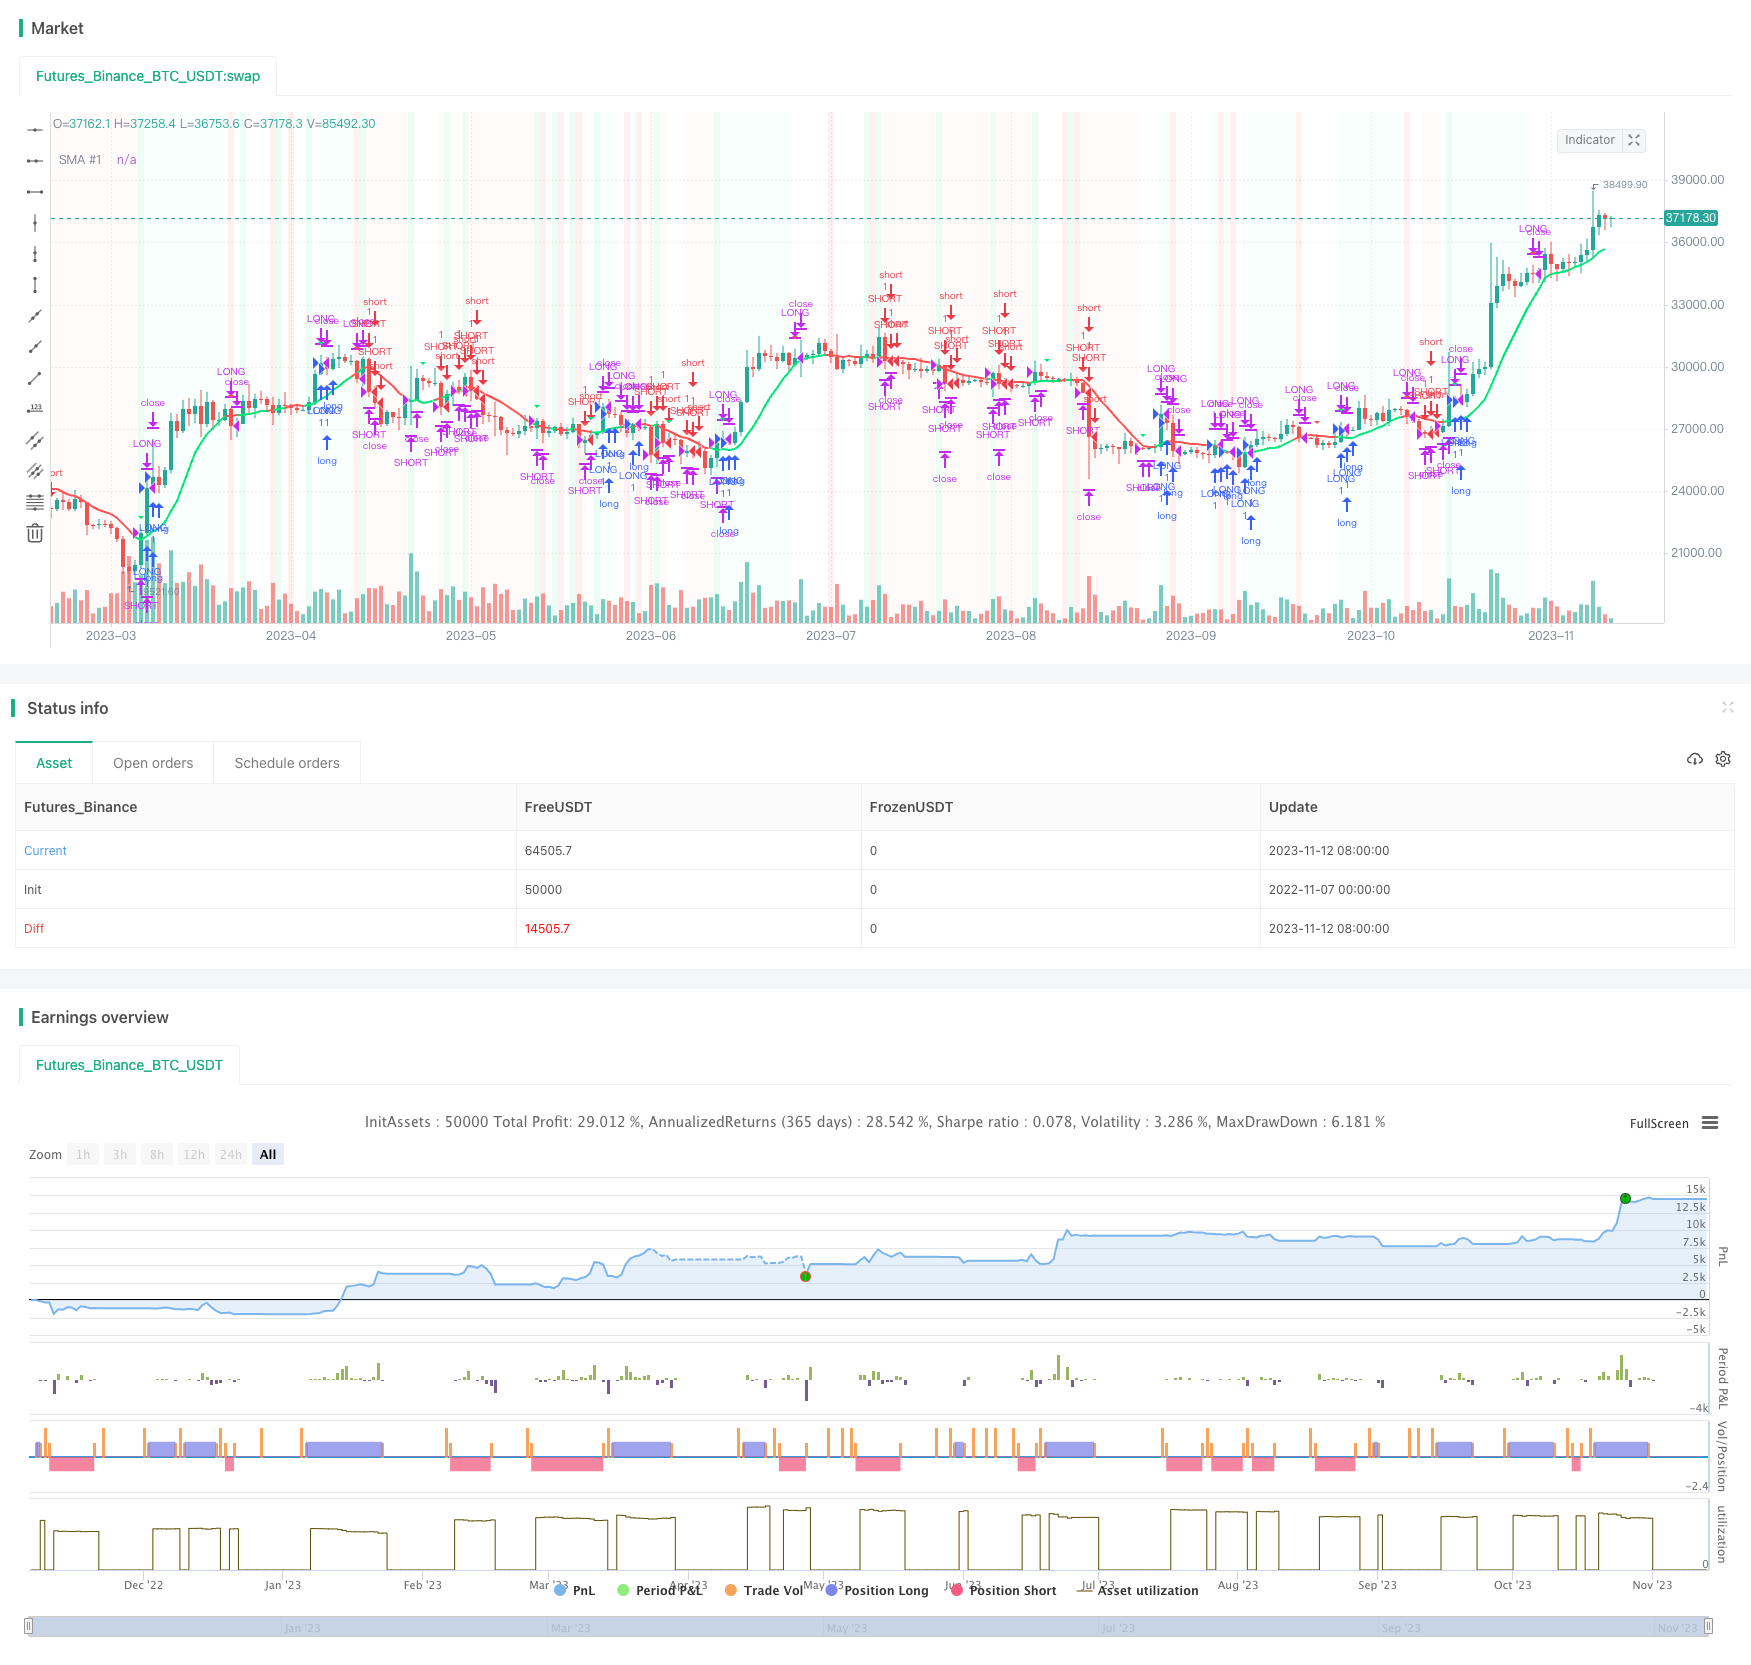 [trans]
概述
本策略通过组合使用均线、MACD和RSI等多个指标在多时间框架内识别趋势方向,实现对SPX500指数的趋势追踪交易。
策略原理
-
使用10日简单移动平均线判断价格趋势方向。当价格上穿10日线时看涨,下穿看跌。
-
应用正负双向MACD判断动量。计算12和21日指数移动平均线的差值,再通过均线差值的快慢线交叉识别买卖信号。快线上穿慢线看涨,下穿看跌。
-
计算14日RSI和其50日均线,RSI上穿均线为看涨信号,下穿为看跌信号。
-
通过1分钟、3分钟和5分钟 timeframe 确认趋势一致性。
-
当价格上穿10日线、RSI上穿均线、MACD快线上穿慢线时产生买入信号;当价格下穿10日线、RSI下穿均线、MACD快线下穿慢线时产生卖出信号。
策略优势
-
多指标组合识别趋势,提高信号准确性。10日均线判断主趋势方向,MACD判定动量强弱,RSI确认超买超卖。指标组合可互相验证,减少错误交易。
-
多时间框架确认,避免被市场噪音误导。1分钟、3分钟、5分钟时间框架双重验证,确保信号同步出现,过滤假信号。
-
结合图形判断形态,直观可靠。图形辅助判断价格形态特征,避免买卖点极端区域,降低损失风险。
-
交易频率适中,符合指数交易特点。使用10日均线作为主要判断指标,交易频率不会过高,避免反复交易而付出过多交易成本。
策略风险
-
无法识别突发事件造成的断裂行情。非理性事件会打乱模型判断,此时应降低仓位规避风险。
-
参数设置固定,未考虑市场环境变化。实战中应根据大市环境动态调整参数,使策略适应多种行情。
-
买卖点过于理想化,实际执行难度大。应结合滑点成本等因素微调买卖点,使信号更具可执行性。
-
多时间框架增加决策延迟。应针对突发事件做好风控,降低延迟带来的亏损。
策略优化方向
-
增加止损机制,如移动止损、百分比止损等,控制单笔损失。
-
优化参数设置,使参数动态适应市场环境,提高策略稳健性。
-
结合市场热点事件风控,避免重大事件对策略造成冲击。
-
考虑实际交易成本如滑点,调整买卖点位使信号可执行。
-
测试不同取值方法,如K线等,作为信号确认来源,丰富多时间框架验证手段。
-
增加机器学习算法,利用大数据训练模型,自动优化策略参数。
总结
本策略通过多指标识别趋势、多时间框架确认信号的方式实现了对SPX500指数的趋势追踪交易。策略优势在于信号准确性高、抗噪音干扰能力强,但需要注意风险控制,保持策略参数动态优化。作为一种优化简单移动平均线策略的有效尝试,本策略为量化交易策略优化提供了有益的启发和借鉴。
||
Overview
This strategy combines moving averages, MACD and RSI across multiple timeframes to identify trend directions and trade S&P500 index trends.
Strategy Logic
-
10-day simple moving average judges price trend. Price crossing above 10-day MA indicates upside, and crossing below indicates downside.
-
MACD judges momentum strength. It calculates difference between 12 and 21-day exponential moving averages, and crossover between the MACD line and signal line generates trading signals. MACD line crossing above signal line indicates upside, and crossing below indicates downside.
-
14-day RSI and its 50-day MA are calculated. RSI crossing above its MA is bullish signal, and crossing below is bearish signal.
-
1-min, 3-min and 5-min timeframes confirm trend consistency.
-
When price crosses above 10-day MA, RSI crosses above its MA, and MACD line crosses above signal line, buy signal is generated. When price crosses below 10-day MA, RSI crosses below its MA, and MACD line crosses below signal line, sell signal is generated.
Advantages
-
Combining indicators improves signal accuracy. 10-day MA judges main trend, MACD determines momentum strength, and RSI confirms overbought/oversold levels. Indicator combo verifies each other and reduces incorrect trades.
-
Multiple timeframe confirmation avoids market noise. Dual confirmation across 1-min, 3-min and 5-min timeframes ensures concurrent signal appearance and filters out false signals.
-
Chart pattern assist visual judgment for reliability. Graphical pattern analysis avoids extreme overbought/oversold levels and reduces loss risks.
-
Medium trading frequency suits index trading. 10-day MA as primary indicator prevents excessive trading, avoiding extra transaction costs from overtrading.
Risks
-
Failure to detect abrupt reversal in irrational events. Such market turmoil disrupts model and should reduce position sizing for risk control.
-
Fixed parameter settings without accounting for changing market conditions. Parameters should be dynamically adjusted for different market regimes in live trading.
-
Overly idealized entry points with execution difficulty in practice. Entry signals should be fine-tuned with slippage to improve executable liquidity.
-
Multiple timeframes increase signal delay. Proper risk control is required to minimize losses from delay during sudden events.
Enhancement
-
Incorporate stop loss mechanisms like trailing stop loss and percentage stop loss to control single trade loss.
-
Optimize dynamic parameter settings to adapt to evolving markets and improve strategy robustness.
-
Consider market regime changes from significant events to avoid model shocks.
-
Account for trading costs like slippage and adjust entry/exit points for better execution.
-
Test different price inputs like candlestick as signal confirmation to diversify multi timeframe validation.
-
Utilize machine learning algorithms on big data to automate strategy optimization.
Conclusion
This strategy trades S&P500 trends effectively through trend identification with multiple indicators and signal confirmation across timeframes. Its strengths lie in high signal accuracy and noise resilience, but risk control and dynamic parameter tuning are required. As an optimization over simple moving average strategies, it provides valuable inspirations and references for quantitative trading strategy enhancement.
[/trans]
Strategy Arguments
| Argument | Default | Description |
|---|---|---|
| v_input_1_close | 0 | SMA Source #1: close |
| v_input_2 | true | RSI |
Source (PineScript)
/*backtest
start: 2022-11-07 00:00:00
end: 2023-11-13 00:00:00
period: 1d
basePeriod: 1h
exchanges: [{"eid":"Futures_Binance","currency":"BTC_USDT"}]
*/

// This source code is subject to the terms of the Mozilla Public License 2.0 at https://mozilla.org/MPL/2.0/
// USE HEIEN ASHI, 1 min, SPX 500 USD OANDA
// © connor2279
//@version=5
strategy(title="SPX Strategy", shorttitle="SPXS", overlay=true)

//SMA
len1 = 10
src1 = input(close, title="SMA Source #1")
out1 = ta.sma(src1, len1)
plot(out1, title="SMA #1", color=close >= out1 ? color.lime : color.red, linewidth=2)

data_over = ta.crossover(close, out1)
dataO = close >= out1
data_under = ta.crossunder(close, out1)
dataU = close < out1

bgcolor(color=ta.crossover(close, out1) ? color.new(color.lime, 90) : na)
bgcolor(color=ta.crossunder(close, out1) ? color.new(color.red, 90) : na)

//Norm MacD
sma = 12
lma = 21
tsp = 10
np = 50

sh = ta.ema(close,sma)

lon= ta.ema(close,lma)

ratio = math.min(sh,lon)/math.max(sh,lon)

Mac = ratio - 1
if(sh>lon)
    Mac := 2-ratio - 1
else
    Mac := ratio - 1

MacNorm = ((Mac-ta.lowest(Mac, np)) /(ta.highest(Mac, np)-ta.lowest(Mac, np)+.000001)*2)- 1

MacNorm2 = MacNorm

if(np<2)
    MacNorm2 := Mac
else
    MacNorm2 := MacNorm

Trigger = ta.wma(MacNorm2, tsp)

trigger_above = Trigger >= MacNorm
trigger_under = Trigger < MacNorm
plotshape(ta.crossover(Trigger, MacNorm2), style=shape.triangledown, color=color.red)
plotshape(ta.crossunder(Trigger, MacNorm2), style=shape.triangledown, color=color.lime)

//RSI / SMA RSI
swr=input(true,title="RSI")
src = close
len = 14
srs = 50
up = ta.rma(math.max(ta.change(src), 0), len)
down = ta.rma(-math.min(ta.change(src), 0), len)
rsi = down == 0 ? 100 : up == 0 ? 0 : 100 - (100 / (1 + up / down))
mr = ta.sma(rsi,srs)
rsi_above = rsi >= mr
rsi_under = rsi < mr

//All
buySignal = rsi_above and trigger_under and dataO
shortSignal = rsi_under and trigger_above and dataU
bgcolor(color=buySignal ? color.new(color.lime,97) : na)
bgcolor(color=shortSignal ? color.new(color.red, 97) : na)

sellSignal = ta.cross(close, out1) or ta.cross(Trigger, MacNorm2) or ta.cross(rsi, mr)
if (buySignal)
    strategy.entry("LONG", strategy.long, 1)

if (shortSignal)
    strategy.entry("SHORT", strategy.short, 1)

// Submit exit orders
strategy.close("LONG", when=sellSignal)
strategy.close("SHORT", when=sellSignal)
Detail
https://www.fmz.com/strategy/432099
Last Modified
2023-11-14 14:29:39