
19 KiB
Name
多指标识别交易反转点的量化交易策略Multi-indicator-Strategy-to-Identify-Trading-Inflection-Points-in-Quant-Trading
Author
ChaoZhang
Strategy Description
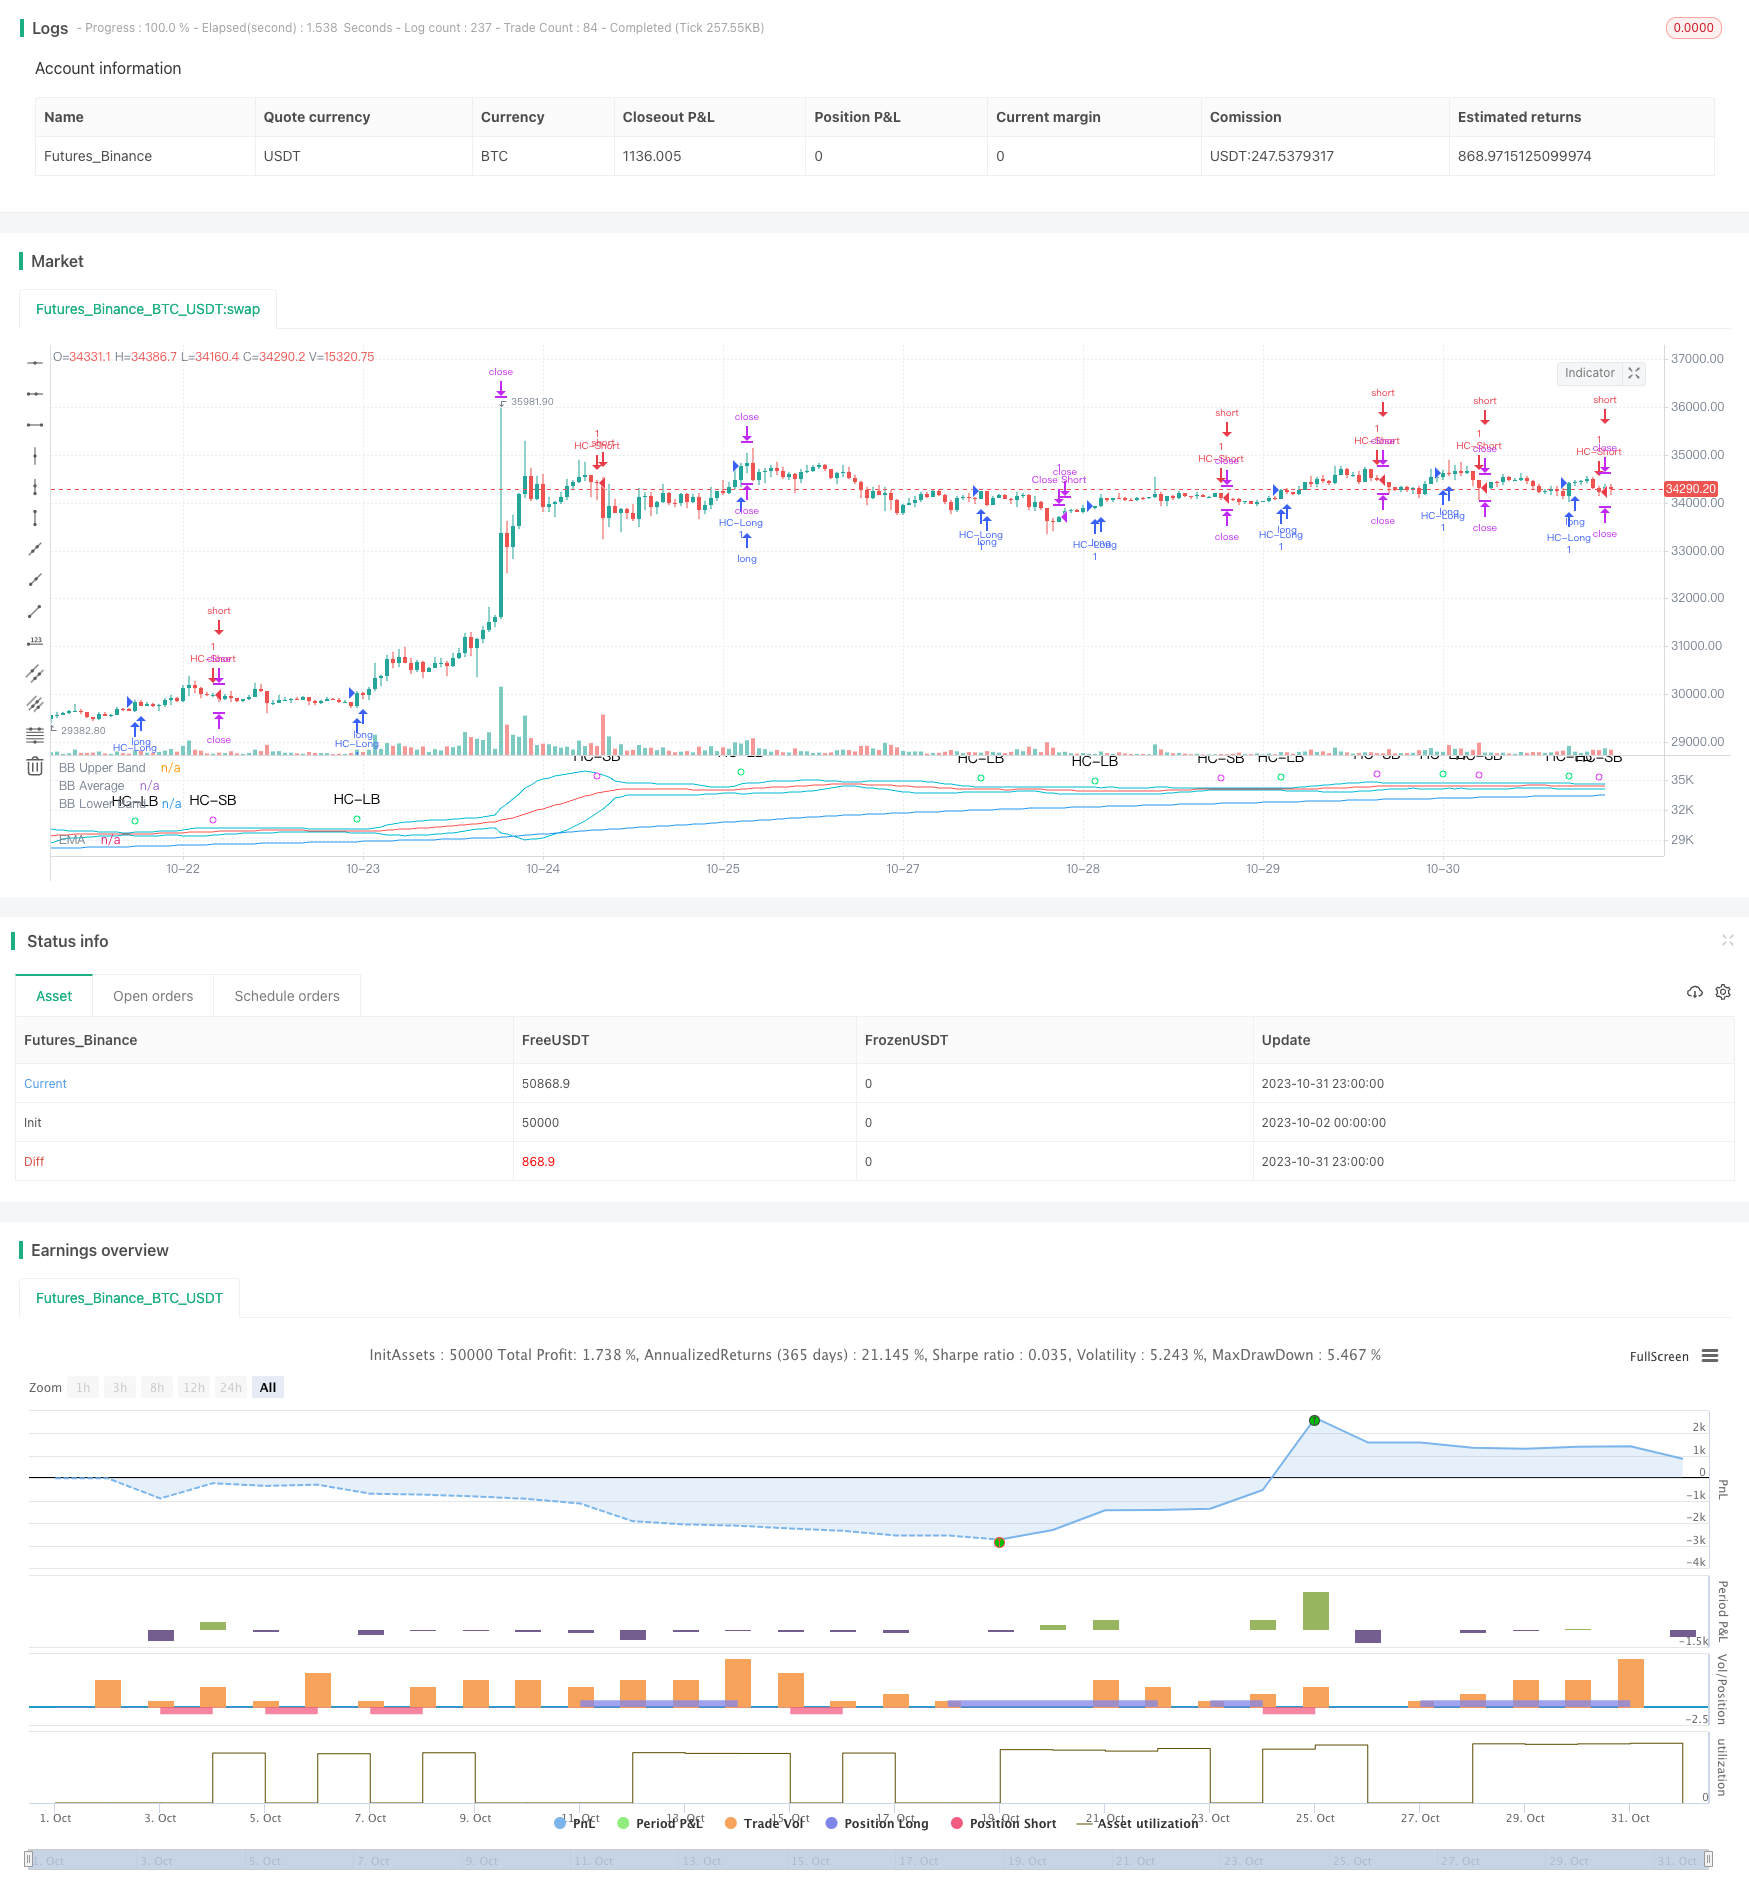 [trans]
概述
本策略综合运用了EMA均线、VWAP、MACD、Bollinger Bands和Schaff Trend Cycle五大指标,识别价格在某一范围内的反转点,发出买入和卖出信号。策略优点是可根据不同市场调整指标使用组合,降低假信号概率,提高获利概率。但也存在指标滞后识别变化以及参数设置不当的风险。总体来说,策略思路清晰,有较强的实用价值。
策略原理
-
EMA均线判断大趋势方向,只在趋势方向买入
-
VWAP判断机构资金流向,只在机构买入方向买入
-
MACD判断短线趋势和动量变化,MACD线突破信号线视为买入/卖出信号
-
Bollinger Bands判断是否过量或过卖,价格穿越上下轨视为买入/卖出信号
-
Schaff Trend Cycle判断短期缠绕盘整结构,超过高低阈值视为买入/卖出信号
-
五大指标发出一致信号时,发出买入/卖出指令
-
设置止损点和止盈点,优化资金管理
策略优势
- 多指标组合降低假信号概率
使用EMA、VWAP、MACD、BB和STC等多种指标的组合,可以相互验证,减少某一单一指标产生的假信号,从而提高信号的可靠性。
- 指标可定制
允许选择是否使用某一指标,可根据不同品种和市场环境进行指标的组合,使策略更具针对性和适应性。
- 资金管理优化
设置止损点和止盈点,可以限制单笔损失,并锁定部分利润,对资金进行更好的管理。
- 策略思路清晰
使用简单直观的指标,并配有详细的代码注释,整个策略思路一目了然,易于理解和修改。
- 实用性强
多种指标广泛使用,参数设置合理,可直接用于实盘交易,无需大量优化即可达到不错的效果。
策略风险
- 指标滞后识别变化的风险
EMA、MACD等指标对价格变化的识别存在一定滞后,可能错过最佳买入时点。
- 参数设置不当的风险
如果指标参数设置不当,将产生大量假信号,无法正常运行策略。
- 胜率无法保证的风险
多指标组合可以提高胜率,但无法确保每笔交易都获利。市场环境变化可能导致胜率下降。
- 止损点设定过小的风险
如果止损点设置过小,在价格正常波动时就可能被止损出场,增加不必要损失。
策略优化方向
- 增加机器学习模型判断信号可靠性
可以训练模型判断多指标信号的可靠程度,对信号进行评分,减少假信号。
- 增加量化指标进行蓄势识别
增加一些量化指标比如OBV等,识别价格的蓄势迹象,提高买点的确定性。
- 优化止损止盈策略
可以研究更适合本策略的移动止损或锁利策略,优化资金管理。
- 参数优化
通过更系统的回测来优化每个指标的参数,提高策略整体稳健性。
- 增加机器人交易
连接交易API,实现自动下单,使策略可以真正无人值守运行。
总结
本策略整合多种技术指标优势,思路清晰,实用性强,可作为 discretionary trading 的决策参考,也可直接用于 algorithmic trading。但仍需针对具体品种和市场环境进行优化调整,降低风险提高稳定性,最后才能在实盘中持续稳定盈利。
||
Overview
This strategy integrates 5 major indicators including EMA, VWAP, MACD, Bollinger Bands and Schaff Trend Cycle to identify inflection points where price reverses within a certain range, and generates buy and sell signals. The advantage of this strategy is the flexibility to combine different indicators based on varying market conditions to reduce false signals and improve profitability. However, there are also risks of lagging signal identification and improper parameter tuning. Overall, the strategy has a clear logic flow and strong practical value.
Strategy Logic
-
EMA judges overall trend direction, only buy with trend
-
VWAP judges institutional money flow, only buy when institutions are buying
-
MACD judges short-term trend and momentum change, MACD line crossover signal line is buy/sell signal
-
Bollinger Bands judge overbought and oversold conditions, price breaking out of bands suggests buy/sell signals
-
Schaff Trend Cycle judges short-term range-bound structure, exceeding high/low thresholds suggests buy/sell signals
-
Send buy/sell orders when all 5 indicators agree on the signal
-
Set stop loss and take profit to optimize capital management
Advantages
- Lower false signals with multi-indicator combo
Using a combination of indicators like EMA, VWAP, MACD, BB and STC allows cross-validation to weed out false signals from any individual indicators, improving reliability.
- Customizable indicators
Ability to turn on/off indicators allows combining ideal indicators for different products and market environments, improving adaptability.
- Optimized capital management
Stop loss and take profit allows limiting single trade loss and locking in profits, enabling better capital management.
- Clear strategy logic
Simple intuitive indicators used with detailed code comments make the overall strategy logic easy to understand and modify.
- Strong practicality
Widely used indicators with reasonable tuning allows live trading with decent results right away without extensive optimizations.
Risks
- Lagging signal identification risk
EMA, MACD etc have lag in identifying price changes, which may cause missing best entry timing.
- Improper parameter tuning risk
Bad indicator parameters will generate excessive false signals and break strategy.
- No guarantee of win rate
Multi-indicator combo improves but does not guarantee win rate. Market regime change can cause win rate decline.
- Stop loss set too tight
If stop loss is too tight, normal price fluctuations may get stopped out causing unnecessary losses.
Enhancement Opportunities
- Add ML model for signal reliability scoring
Train model to score multi-indicator signals on reliability, filter out false signals.
- Add momentum indicators for accumulation identification
Add quant indicators like OBV to identify price accumulation, improving buy point certainty.
- Optimize stop loss and take profit logic
Research more suitable trailing stop or profit taking logic for this strategy to better optimize capital management.
- Parameter optimization
Conduct more systematic backtests to find optimal parameters for each indicator, improving robustness.
- Add auto trading
Connect to trading API to allow auto order execution, enabling fully automated hands-off strategy execution.
Conclusion
This strategy combines strengths of multiple technical indicators with a clear logic flow and strong practical value. It can serve as discretionary trading decision support or direct algorithmic trading. But optimization and tuning based on specific product and market environment is needed to reduce risk and improve stability before consistent profitable live trading.
[/trans]
Strategy Arguments
| Argument | Default | Description |
|---|---|---|
| v_input_1_close | 0 | Price Source: close |
| v_input_2 | 200 | EMA_Length |
| v_input_3 | 0 | Show BB: Y |
| v_input_4 | 10 | Cycle Length |
| v_input_5 | 90 | Upper STC limit |
| v_input_6 | 10 | Lower STC limit |
| v_input_7 | false | Price CountBack |
| v_input_8 | 0 | Run EMA: N |
| v_input_9 | 0 | Run VWAP: N |
| v_input_10 | 0 | Run MACD: N |
| v_input_11 | 0 | Run BB: N |
| v_input_12 | 0 | Run STC: Y |
| v_input_13 | 5 | Stop Loss % |
| v_input_14 | 10 | Take Profit % |
Source (PineScript)
/*backtest
start: 2023-10-02 00:00:00
end: 2023-11-01 00:00:00
period: 1h
basePeriod: 15m
exchanges: [{"eid":"Futures_Binance","currency":"BTC_USDT"}]
*/

//@version=4

// This source code is subject to the terms of the Mozilla Public License 2.0 at https://mozilla.org/MPL/2.0/
// © MakeMoneyCoESTB2020

//*********************Notes for continued work***************
//3) add a Table of contents to each section of code
//4) add candle stick pattern considerations to chart
//5) add an input value for DTE range to backtest
//7) add abilit to turn on/off MACD plot
//9)
//************************************************************


//Hello my fellow investors
//After hours of reading, backtesting, and YouTube video watching
//I discovered that 200EMA, VWAP, BB, MACD, and STC
//produce the most consistent results for investment planning.
//This strategy allows you to pick between the aforementioned indicators or layer them together.
//It works on the pricipal of:
//1) Always follow the market trend - buy/sell above/below 200EMA
//2) Follow corporate investing trends - buy/sell above/below VWAP
//3) Apply MACD check - buy--> MACD line above signal line
// and corssover below histogram \\ sell --> MACD line below signal line
// and crossover above histogram.
//4) Check volitility with price against BB limits upper/Sell or lower/buy
//5) When STC crosses about 10 buy and when it drops below 90 sell
//6) Exit position when stop loss is triggered or profit target is hit.  BB also provides a parameter to exit positions.

//This code is the product of many hours of hard work on the part of the greater tradingview community.  The credit goes to everyone in the community who has put code out there for the greater good.

//Happy Hunting!


//Title
// strategy("WOMBO COMBO: 100/200EMA & VWAP & MACD", shorttitle="WOMBO COMBO", default_qty_type=strategy.percent_of_equity, default_qty_value=1.5, initial_capital=10000,slippage=2, currency=currency.USD, overlay=true)

//define calculations price source
price = input(title="Price Source", defval=close)


//***************************
//Calculate 20/50/100/200EMA
EMAlength = input(title="EMA_Length", defval=200)
EMA=ema(price, EMAlength)
//plot EMA
ColorEMA=EMAlength==200?color.blue:EMAlength==100?color.aqua:EMAlength==50?color.orange:color.red
plot(EMA, title = "EMA", color = ColorEMA)


//*****************************
//calculate VWAP
ColorVWAP = (price > vwap) ? color.lime : color.maroon
plot(vwap, title = "VWAP", color=ColorVWAP, linewidth=2)


//*****************************
//calculate MACD
//define variables for speed
fast = 12, slow = 26
//define parameters to calculate MACD
fastMA = ema(price, fast)
slowMA = ema(price, slow)
//define MACD line
macd = fastMA - slowMA
//define SIGNAL line
signal = sma(macd, 9)
//plot MACD line
//plot(macd, title = "MACD",  color=color.orange)
//plot signal line
//plot(signal, title = "Signal", color=color.purple)
//plot histogram
//define histogram colors
//col_grow_above = color.green
//col_grow_below = color.red
//col_fall_above = color.lime
//col_fall_below = color.maroon
//define histogram value
//hist = macd - signal
//plot histogram
//plot(hist, title="Histogram", style=plot.style_columns, color=(hist>=0 ? (hist[1] < hist ? col_grow_above : col_fall_above) : (hist[1] < hist ? col_grow_below : col_fall_below) ), transp=0 )


//***************************************
//Calculate Bollinger Bands
//Define BB input variables
//lengthBB = input(20, minval=1)
//multBB = input(2.0, minval=0.001, maxval=50)
lengthBB = 20
multBB = 2
//define BB average
basisBB = sma(price, lengthBB)
//define BB standar deviation
devBB = multBB * stdev(price, lengthBB)
//define BB upper and lower limits
upperBB = basisBB + devBB
lowerBB = basisBB - devBB
//Plot BB graph
ShowBB = input(title="Show BB", defval="Y", type=input.string, options=["Y", "N"])
transP = (ShowBB=="Y") ? 0 : 100
plot (upperBB, title = "BB Upper Band", color = color.aqua, transp=transP)
plot (basisBB, title = "BB Average", color = color.red, transp=transP)
plot (lowerBB, title = "BB Lower Band", color = color.aqua, transp=transP)


//*************************************************
//Calculate STC
//fastLength = input(title="MACD Fast Length", type=input.integer, defval=12)
//slowLength = input(title="MACD Slow Length", type=input.integer, defval=26)
fastLength = 23
slowLength = 50
cycleLength = input(title="Cycle Length", type=input.integer, defval=10)
//d1Length = input(title="1st %D Length", type=input.integer, defval=3)
//d2Length = input(title="2nd %D Length", type=input.integer, defval=3)
d1Length = 3
d2Length = 3
srcSTC = close

macdSTC = ema(srcSTC, fastLength) - ema(srcSTC, slowLength)
k = nz(fixnan(stoch(macdSTC, macdSTC, macdSTC, cycleLength)))
d = ema(k, d1Length)
kd = nz(fixnan(stoch(d, d, d, cycleLength)))
stc = ema(kd, d2Length)
stc := 	stc > 100 ? 100 : stc < 0 ? 0 : stc
upperSTC = input(title="Upper STC limit", defval=90)
lowerSTC = input( title="Lower STC limit", defval=10)

ma1length=35
ma1 = ema(close,ma1length)
ma2 = ema(close,EMAlength)

//STCbuy = crossover(stc, lowerSTC) and ma1>ma2 and close>ma1
//STCsell = crossunder(stc, upperSTC) and ma1<ma2 and close<ma1
STCbuy = crossover(stc, lowerSTC)
STCsell = crossunder(stc, upperSTC)


//*************************************************
//Candle stick patterns
//DojiSize = input(0.05, minval=0.01, title="Doji size")
//data=(abs(open - close) <= (high - low) * DojiSize)
//plotchar(data, title="Doji", text='Doji', color=color.white)

data2=(close[2] > open[2] and min(open[1], close[1]) > close[2] and open < min(open[1], close[1]) and close < open )
//plotshape(data2, title= "Evening Star", color=color.red, style=shape.arrowdown, text="Evening\nStar")

data3=(close[2] < open[2] and max(open[1], close[1]) < close[2] and open > max(open[1], close[1]) and close > open )
//plotshape(data3,  title= "Morning Star", location=location.belowbar, color=color.lime, style=shape.arrowup, text="Morning\nStar")

data4=(open[1] < close[1] and open > close[1] and high - max(open, close) >= abs(open - close) * 3 and min(close, open) - low <= abs(open - close))
//plotshape(data4, title= "Shooting Star", color=color.red, style=shape.arrowdown, text="Shooting\nStar")

data5=(((high - low)>3*(open -close)) and  ((close - low)/(.001 + high - low) > 0.6) and ((open - low)/(.001 + high - low) > 0.6))
//plotshape(data5, title= "Hammer", location=location.belowbar, color=color.white, style=shape.diamond, text="H")

data5b=(((high - low)>3*(open -close)) and  ((high - close)/(.001 + high - low) > 0.6) and ((high - open)/(.001 + high - low) > 0.6))
//plotshape(data5b, title= "Inverted Hammer", location=location.belowbar, color=color.white, style=shape.diamond, text="IH")

data6=(close[1] > open[1] and open > close and open <= close[1] and open[1] <= close and open - close < close[1] - open[1] )
//plotshape(data6, title= "Bearish Harami",  color=color.red, style=shape.arrowdown, text="Bearish\nHarami")

data7=(open[1] > close[1] and close > open and close <= open[1] and close[1] <= open and close - open < open[1] - close[1] )
//plotshape(data7,  title= "Bullish Harami", location=location.belowbar, color=color.lime, style=shape.arrowup, text="Bullish\nHarami")

data8=(close[1] > open[1] and open > close and open >= close[1] and open[1] >= close and open - close > close[1] - open[1] )
//plotshape(data8,  title= "Bearish Engulfing", color=color.red, style=shape.arrowdown, text="Bearish\nEngulfing")

data9=(open[1] > close[1] and close > open and close >= open[1] and close[1] >= open and close - open > open[1] - close[1] )
//plotshape(data9, title= "Bullish Engulfing", location=location.belowbar, color=color.lime, style=shape.arrowup, text="Bullish\nEngulfling")

upper = highest(10)[1]
data10=(close[1] < open[1] and  open < low[1] and close > close[1] + ((open[1] - close[1])/2) and close < open[1])
//plotshape(data10, title= "Piercing Line", location=location.belowbar, color=color.lime, style=shape.arrowup, text="Piercing\nLine")

lower = lowest(10)[1]
data11=(low == open and  open < lower and open < close and close > ((high[1] - low[1]) / 2) + low[1])
//plotshape(data11, title= "Bullish Belt", location=location.belowbar, color=color.lime, style=shape.arrowup, text="Bullish\nBelt")

data12=(open[1]>close[1] and open>=open[1] and close>open)
//plotshape(data12, title= "Bullish Kicker", location=location.belowbar, color=color.lime, style=shape.arrowup, text="Bullish\nKicker")

data13=(open[1]<close[1] and open<=open[1] and close<=open)
//plotshape(data13, title= "Bearish Kicker", color=color.red, style=shape.arrowdown, text="Bearish\nKicker")

data14=(((high-low>4*(open-close))and((close-low)/(.001+high-low)>=0.75)and((open-low)/(.001+high-low)>=0.75)) and high[1] < open and high[2] < open)
//plotshape(data14,  title= "Hanging Man", color=color.red, style=shape.arrowdown, text="Hanging\nMan")

data15=((close[1]>open[1])and(((close[1]+open[1])/2)>close)and(open>close)and(open>close[1])and(close>open[1])and((open-close)/(.001+(high-low))>0.6))
//plotshape(data15, title= "Dark Cloud Cover", color=color.red, style=shape.arrowdown, text="Dark\nCloudCover")


//**********Long & Short Entry Calculations***********************************
//Define countback variable
countback=input(minval=0, maxval=5, title="Price CountBack", defval=0)
//User input for what evaluations to run: EMA, VWAP, MACD, BB
EMA_Y_N=input(defval = "N", title="Run EMA", type=input.string, options=["Y", "N"])
VWAP_Y_N=input(defval = "N", title="Run VWAP", type=input.string, options=["Y", "N"])
MACD_Y_N=input(defval = "N", title="Run MACD", type=input.string, options=["Y", "N"])
BB_Y_N=input(defval = "N", title="Run BB", type=input.string, options=["Y", "N"])
STC_Y_N=input(defval = "Y", title="Run STC", type=input.string, options=["Y", "N"])
//long entry condition
dataHCLB=(iff(STC_Y_N=="Y", STCbuy, true) and iff(EMA_Y_N=="Y", price[countback]>EMA, true) and iff(VWAP_Y_N=="Y", price[countback]>vwap, true) and iff(MACD_Y_N=="Y", crossunder(signal[countback], macd[countback]), true) and iff(MACD_Y_N=="Y", macd[countback]<0, true) and iff(BB_Y_N=="Y", crossunder(price[countback], lowerBB), true))
plotshape(dataHCLB, title= "HC-LB", color=color.lime, style=shape.circle, text="HC-LB")
strategy.entry("HC-Long", strategy.long, comment="HC-Long", when = dataHCLB)
//short entry condition
dataHCSB=(iff(STC_Y_N=="Y", STCsell, true) and iff(EMA_Y_N=="Y", price[countback]<EMA, true) and iff(VWAP_Y_N=="Y", price[countback]<vwap, true) and iff(MACD_Y_N=="Y", crossunder(macd[countback], signal[countback]), true) and iff(MACD_Y_N=="Y", signal[countback]>0, true) and iff(BB_Y_N=="Y", crossover(price[countback], upperBB), true))
plotshape(dataHCSB, title= "HC-SB", color=color.fuchsia, style=shape.circle, text="HC-SB")
strategy.entry("HC-Short", strategy.short, comment="HC-Short", when=dataHCSB)


//******************Exit Conditions******************************
// Profit and Loss Exit Calculations
// User Options to Change Inputs (%)
stopPer = input(5, title='Stop Loss %', type=input.float) / 100
takePer = input(10, title='Take Profit %', type=input.float) / 100

// Determine where you've entered and in what direction
longStop = strategy.position_avg_price * (1 - stopPer)
shortStop = strategy.position_avg_price * (1 + stopPer)
shortTake = strategy.position_avg_price * (1 - takePer)
longTake = strategy.position_avg_price * (1 + takePer)

//exit position conditions and orders
if strategy.position_size > 0 or crossunder(price[countback], upperBB)
    strategy.exit(id="Close Long", stop=longStop, limit=longTake)
if strategy.position_size < 0 or crossover(price[countback], lowerBB)
    strategy.exit(id="Close Short", stop=shortStop, limit=shortTake)
Detail
https://www.fmz.com/strategy/430838
Last Modified
2023-11-02 14:09:34