
28 KiB
Name
多因子自适应动量追踪策略Multi-factor-Adaptive-Momentum-Tracking-Strategy
Author
ChaoZhang
Strategy Description
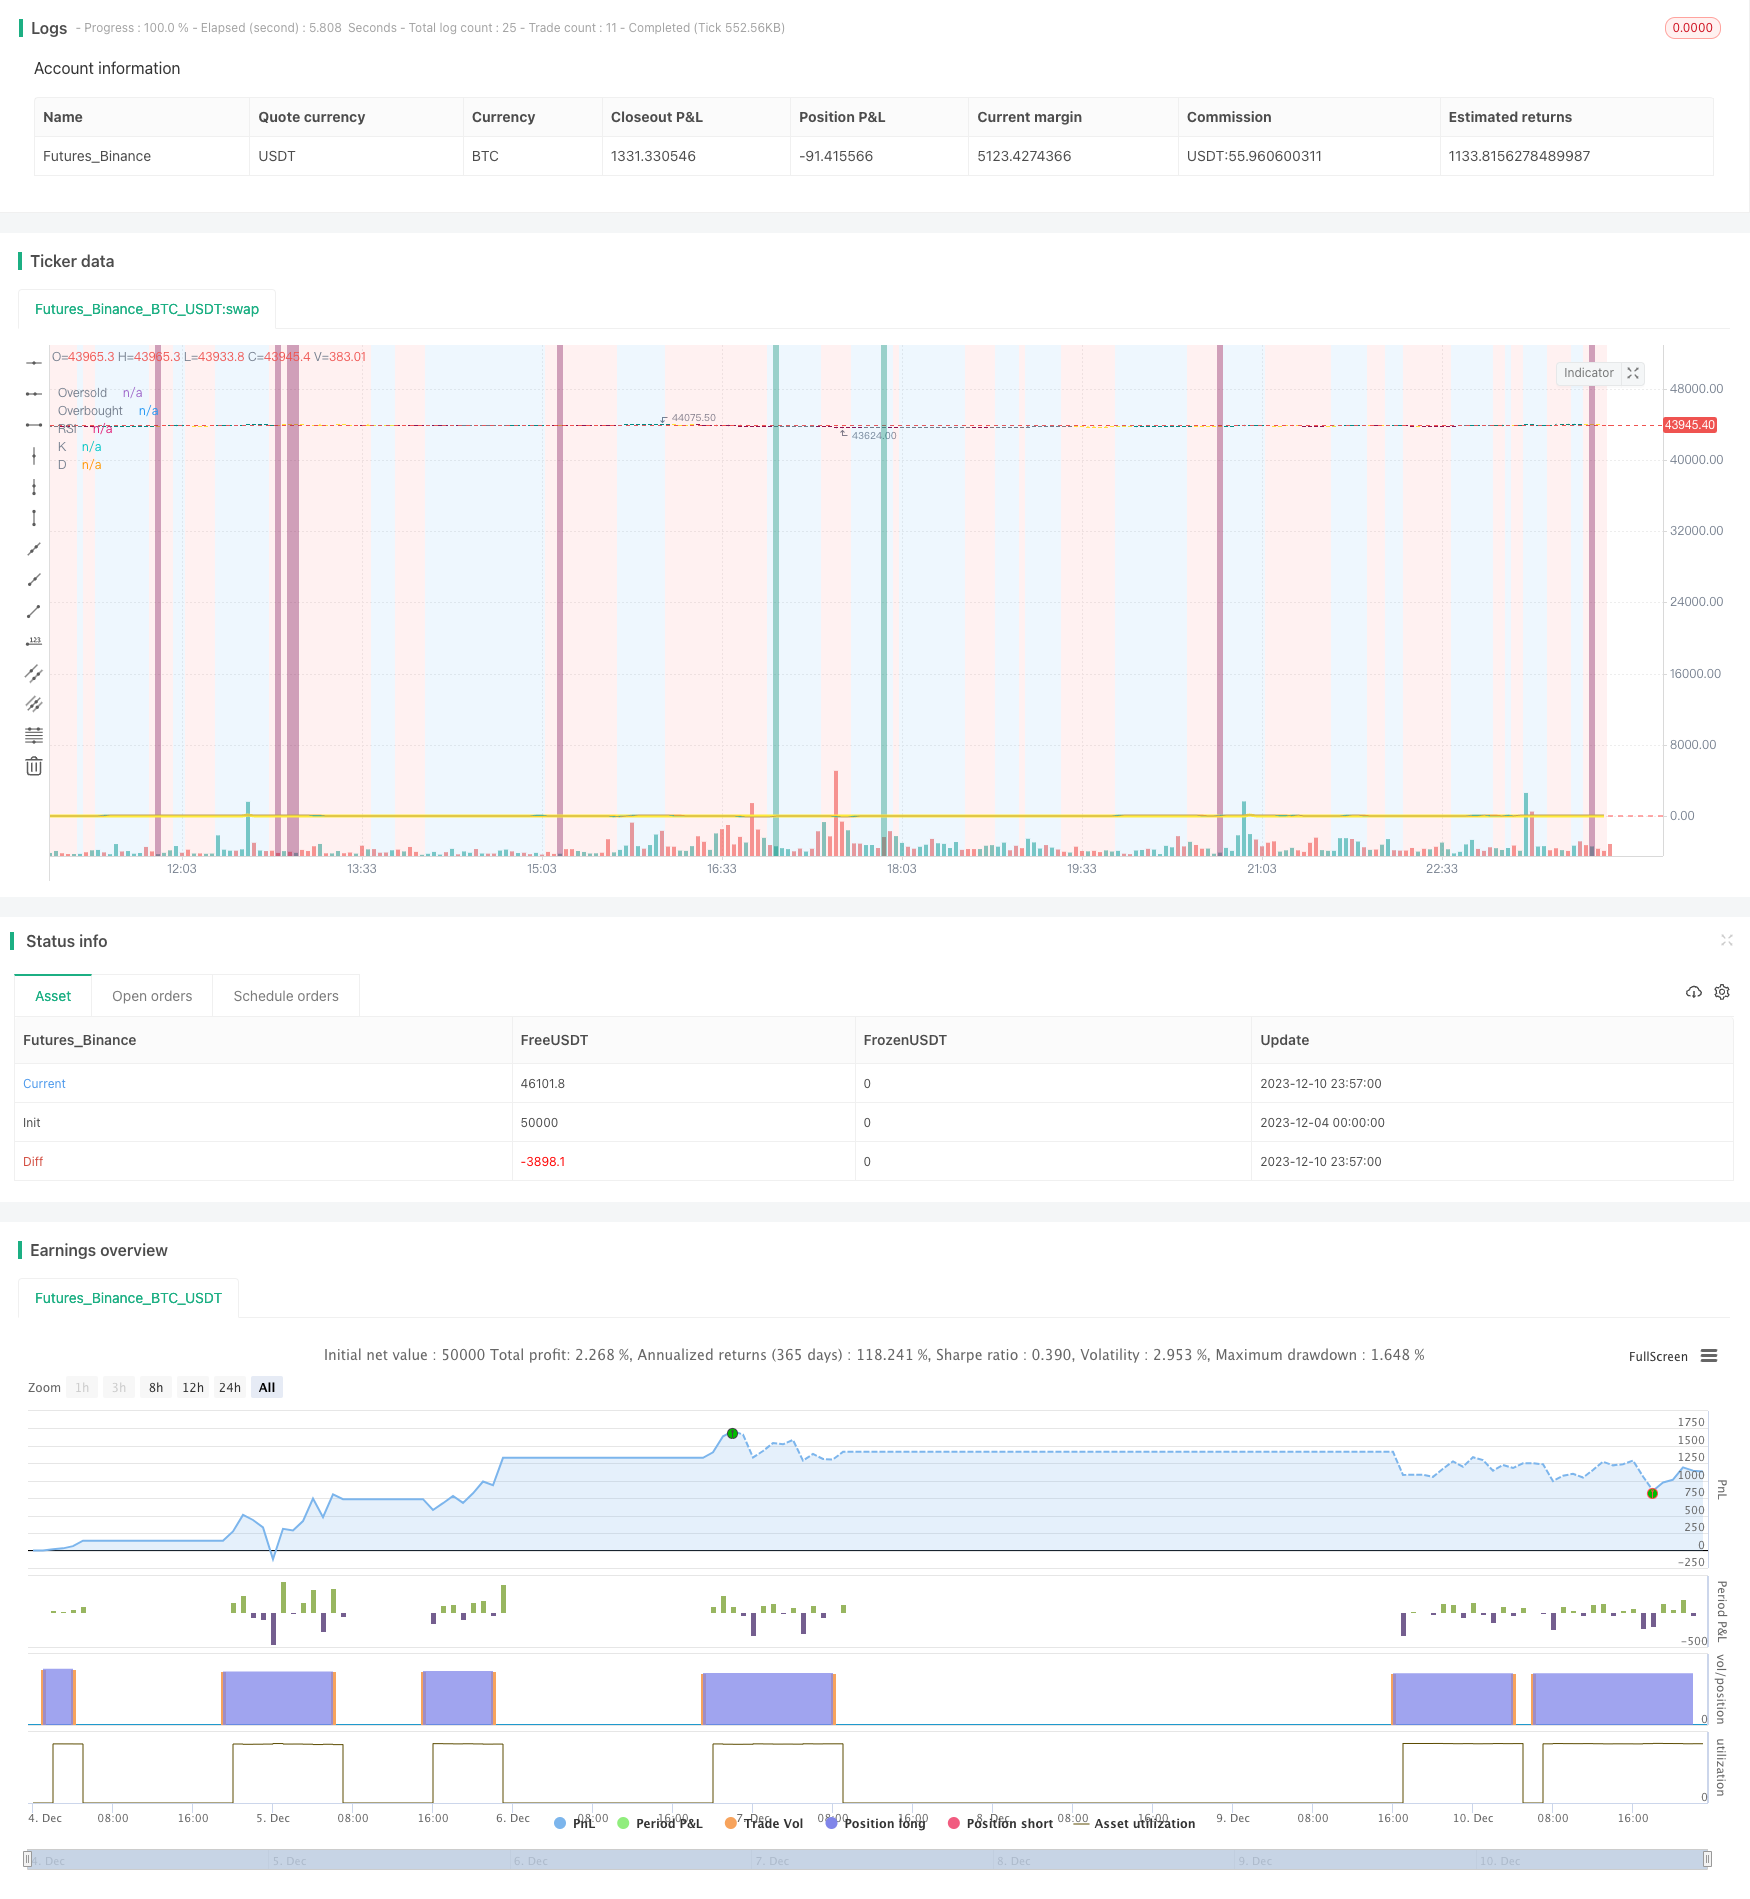
[trans]
概述
多因子自适应动量追踪策略通过整合多种技术指标识别市场趋势和关键支持阻力位,实现对加密货币等高波动资产的自动化交易。该策略综合运用RSI、MACD、Stochastic等指标判断买卖时机,同时结合价格变化百分比实现更准确的形态识别。
策略原理
多因子自适应动量追踪策略核心在于多种技术指标的整合运用。该策略主要用到以下几个组成部分:
-
RSI指标判断超买超卖。结合不同参数可以识别普通RSI信号或改进版康纳RSI信号,从而判断是否存在反转机会。
-
MACD指标帮助判断趋势方向。当MACD线上穿或下穿信号线时产生买入和卖出信号。
-
Stochastic指标识别超买超卖区。K线和D线的金叉死叉组合信号判断是否反转。
-
价格变化百分比检验是否真实突破。计算一定周期内的最高价、最低价、收盘价等的变化百分比,判断是否构成真实的突破。
-
EMA指标判断大级别的多空。快线上穿慢线为看涨信号,下穿为看跌信号。
该策略根据市场多空状态选择做多做空,并在进入仓位后设置止损止盈,有效控制风险。当反转信号出现时选择平仓离场。整个决策过程充分结合多个因子judgment,从而实现更准确判断。
优势分析
该策略具有以下几点优势:
-
多因子驱动具有判断优势。相比单一指标,多指标组合能够互相验证,使结果更加准确可靠,从而节省不必要的交易成本。
-
条件严格避免错误交易。策略对买卖条件设定了严格要求,需要多个指标同时释放信号,从而能够过滤掉大量噪声,避免错误交易的发生。
-
自适应超参数降低人工干预。策略内置动态计算指标参数的能力,避免人工选择超参数的主观性,从而使策略Parameters更科学客观。
-
止损止盈机制控制风险。策略在开仓后会实时计算并绘制止损止盈位置,能够有效控制单笔损失,避免爆仓的发生。
风险分析
该策略也存在一些风险需要防范:
-
指标错误释放信号的概率。尽管多指标验证可以大幅降低错误信号率,但仍有发生的可能性。这可能导致不必要的亏损。
-
止损被突破的风险。极端行情下,价格可能出现断崖式下跌,导致原本的止损被轻易突破,造成较大损失。
-
参数优化带来的过优化。动态参数虽然避免人工选择带来的主观性,但也可能导致参数过度优化而丧失泛化能力。
对应解决方法:
- 加大信号过滤条件严格程度,减少错误信号率。
- 采用分批建仓的方式,避免单次止损过大。
- 增加测试样本量,严格评估参数稳定性。
策略优化方向
多因子自适应动量追踪策略还存在以下几个可优化的维度:
-
增加判断因子的数量。结合更多不同类型指标信号判断,如波动率、交易量等辅助判断。
-
优化止损机制算法。可以引入追踪止损、震荡止损等更先进止损算法,进一步降低止损被突破概率。
-
引入机器学习模型。使用RNN、LSTM等模型对历史数据进行建模,辅助判断买卖决策。
-
策略集成。采用多个子策略,并使用集成学习方法进行整合,可以获得更稳定的综合表现。
总结
多因子自适应动量追踪策略整合运用多种技术指标识别买卖时机。相比单一指标,该策略判断更加准确,同时内置参数自适应和止损机制控制风险。下一步通过引入更多辅助判断因子、先进止损算法以及机器学习等方法,可以进一步增强该策略的效果。
||
Overview
The multi-factor adaptive momentum tracking strategy realizes automated trading of highly volatile assets like cryptocurrencies by identifying market trends and key support/resistance levels through integrating multiple technical indicators. The strategy combines indicators like RSI, MACD, Stochastic to determine entry and exit timing, while also incorporating price percentage change to enable more accurate pattern recognition.
Strategy Principle
The core of the multi-factor adaptive momentum tracking strategy lies in the integration of multiple technical indicators. The main components used in this strategy include:
-
RSI to judge overbought/oversold conditions. Different parameters can be used to identify regular RSI signals or the tweaked Connors RSI signals to determine if reversal opportunities exist.
-
MACD to help determine trend direction. Buy and sell signals are generated when the MACD line crosses above or below the signal line.
-
Stochastic to spot overbought/oversold zones. Golden cross and death cross combinations of the K and D lines indicate whether reversals may occur.
-
Price percentage change to check if breakouts are real. Calculates the percentage change of highest price, lowest price, close price etc over a certain period to determine if a true breakout has occurred.
-
EMAs to judge overall trend. Upcrossing of fast EMA above slow EMA gives bullish signals while downcrossing gives bearish signals.
The strategy chooses to go long or short based on market conditions, and sets stop loss and take profit after entering positions to effectively control risks. Exits when reversal signals occur. The entire decision process integrates judgments from multiple factors to realize more accurate results.
Advantage Analysis
The advantages of this strategy include:
-
Multiple factors drive better judgment. Compared to single indicators, combining multiple indicators enables mutual verification and more reliable results, saving unnecessary trading costs.
-
Strict conditions avoid bad trades. The strategy sets strict requirements for buy/sell signals, requiring multiple simultaneous signals to filter out noise and avoid bad trades.
-
Adaptive parameters reduce manual interference. The built-in ability to dynamically calculate indicator parameters avoids the subjectivity of manual parameter selection, making the parameters more scientific and objective.
-
Stop loss/take profit controls risks. Strategy continuously calculates and plots stop loss/take profit levels after opening positions, effectively capping per trade loss and preventing margin calls.
Risk Analysis
Risks that need to be prevented include:
-
Probability of incorrect signals from indicators. Although the multiple verification process greatly reduces erroneous signals, some probability remains. This may lead to unnecessary losses.
-
Risk of stop loss being penetrated. In extreme market conditions, prices may cliff dive and penetrate originally set stop losses easily, leading to above average losses.
-
Overoptimization from parameter tuning. Although dynamic parameters reduce subjectivity, they may also lead to over-fitting and losing generalizability.
Solutions:
- Raise strictness of signal filtering to reduce erroneous signals.
- Adopt staged entries to avoid oversized single stop loss.
- Enhance sample testing to strictly evaluate parameter stability.
Optimization Directions
This strategy can be further optimized through:
-
Increasing judgment factors. Combine signals from more indicators of different types, e.g. volatility, volume etc to assist judgment.
-
Optimizing stop loss algorithms. Introduce more advanced stop loss algorithms like trailing stop loss, volatility stop loss etc to further reduce the probability of stop loss being hit.
-
Introducing machine learning models. Model historical data using RNN, LSTM etc to aid in buy/sell decisions.
-
Strategy ensembling. Adopt multiple sub-strategies and use ensemble methods to integrate for more robust overall performance.
Conclusion
The multi-factor adaptive momentum tracking strategy integrates multiple technical indicators to identify trading opportunities. Compared to single indicators, this strategy has more accurate judgments, coupled with built-in parameter adaptation and stop loss mechanisms to control risks. Next steps include introducing more auxiliary judgment factors, advanced stop loss algorithms, machine learning etc to further enhance strategy performance.
[/trans]
Strategy Arguments
| Argument | Default | Description |
|---|---|---|
| v_input_1 | timestamp(01 April 2021 00:00 -0500) | Start Time |
| v_input_2 | timestamp(31 December 2021 00:00 -0600) | End Time |
| v_input_3 | true | Long/Short for Mixed Market, Long for Bull, Short for Bear |
| v_input_4 | 0 | Trade Types: Long/Short |
| v_input_5 | 10 | Stop Loss % |
| v_input_6 | 20 | Target Profit % |
| v_input_7 | false | Use RSI crossing back, select only one strategy |
| v_input_8 | false | Use Tweaked Connors RSI, select only one |
| v_input_9 | true | These are the RSI Strategy Inputs, RSI Length applies to MACD, set OB and OS to 45 for using Stoch and EMA strategies. |
| v_input_10 | 14 | RSI Length |
| v_input_11 | 62 | Overbought |
| v_input_12 | 35 | Oversold |
| v_input_13 | 3 | Connor's MA Length 1 |
| v_input_14 | 20 | Connor's MA Lenght 2 |
| v_input_15 | 50 | Connor's MA Lenght 3 |
| v_input_16 | false | Use MACD Only, select only one strategy |
| v_input_17 | false | Use EMA Only, select only one strategy (EMA uses Stochastic inputs too) |
| v_input_18 | true | These are the MACD strategy variables |
| v_input_19 | 5 | EMA Fast Length |
| v_input_20 | 10 | EMA Slow Length |
| v_input_21 | 52 | Overbought Lookback Minimum Value |
| v_input_22 | 25 | Overbought Lookback Bars |
| v_input_23 | 50 | Oversold Lookback Minimum Value |
| v_input_24 | 35 | Oversold Lookback Bars |
| v_input_25_close | 0 | Source: close |
| v_input_26 | true | Price Change Percentage Cross Check Inputs for all Strategies, added logic to avoid early sell |
| v_input_27 | 5 | Max Lookback Period |
| v_input_28 | false | Use Stochastic Strategy, choose only one |
| v_input_29 | true | Stochastic Strategy Inputs |
| v_input_30 | 3 | K |
| v_input_31 | 3 | D |
| v_input_32 | 0 | K Mode: SMA |
| v_input_33_high | 0 | High Source: high |
| v_input_34_low | 0 | Low Source: low |
| v_input_35 | Curernt or Higher time frame only | |
| v_input_36 | true | Show Bullish/Bearish Zones |
| v_input_37 | true | Show Stochastic Overlays |
| v_input_38 | true | Show RSI Buy Sell Zones |
| v_input_39 | true | Show MACD |
| v_input_40 | true | Color Bars |
Source (PineScript)
/*backtest
start: 2023-12-04 00:00:00
end: 2023-12-11 00:00:00
period: 3m
basePeriod: 1m
exchanges: [{"eid":"Futures_Binance","currency":"BTC_USDT"}]
*/

// This source code is subject to the terms of the Mozilla Public License 2.0 at https://mozilla.org/MPL/2.0/
//@version=4

// ██████╗██████╗ ███████╗ █████╗ ████████╗███████╗██████╗     ██████╗ ██╗   ██╗
//██╔════╝██╔══██╗██╔════╝██╔══██╗╚══██╔══╝██╔════╝██╔══██╗    ██╔══██╗╚██╗ ██╔╝
//██║     ██████╔╝█████╗  ███████║   ██║   █████╗  ██║  ██║    ██████╔╝ ╚████╔╝
//██║     ██╔══██╗██╔══╝  ██╔══██║   ██║   ██╔══╝  ██║  ██║    ██╔══██╗  ╚██╔╝
//╚██████╗██║  ██║███████╗██║  ██║   ██║   ███████╗██████╔╝    ██████╔╝   ██║
// ╚═════╝╚═╝  ╚═╝╚══════╝╚═╝  ╚═╝   ╚═╝   ╚══════╝╚═════╝     ╚═════╝    ╚═╝

//███████╗ ██████╗ ██╗     ██╗   ██╗████████╗██╗ ██████╗ ███╗   ██╗███████╗ ██╗ █████╗ ███████╗ █████╗
//██╔════╝██╔═══██╗██║     ██║   ██║╚══██╔══╝██║██╔═══██╗████╗  ██║██╔════╝███║██╔══██╗╚════██║██╔══██╗
//███████╗██║   ██║██║     ██║   ██║   ██║   ██║██║   ██║██╔██╗ ██║███████╗╚██║╚██████║    ██╔╝╚█████╔╝
//╚════██║██║   ██║██║     ██║   ██║   ██║   ██║██║   ██║██║╚██╗██║╚════██║ ██║ ╚═══██║   ██╔╝ ██╔══██╗
//███████║╚██████╔╝███████╗╚██████╔╝   ██║   ██║╚██████╔╝██║ ╚████║███████║ ██║ █████╔╝   ██║  ╚█████╔╝
//╚══════╝ ╚═════╝ ╚══════╝ ╚═════╝    ╚═╝   ╚═╝ ╚═════╝ ╚═╝  ╚═══╝╚══════╝ ╚═╝ ╚════╝    ╚═╝   ╚════╝

strategy(shorttitle='Ain1 No Label',title='All in One Strategy no RSI Label', overlay=true, scale=scale.left, initial_capital = 1000, process_orders_on_close=true, default_qty_type = strategy.percent_of_equity, default_qty_value = 100, commission_type=strategy.commission.percent, commission_value=0.18, calc_on_every_tick=true)

kcolor = color.new(#0094FF, 60)
dcolor = color.new(#FF6A00, 60)


// -----------------  Strategy Inputs -------------------------------------------------------------
//Backtest dates with auto finish date of today
start = input(defval = timestamp("01 April 2021 00:00 -0500"), title = "Start Time", type = input.time)
finish = input(defval = timestamp("31 December 2021 00:00 -0600"), title = "End Time", type = input.time)
window()  => true       // create function "within window of time"


// Strategy Selection - Long, Short, or Both
stratinfo = input(true, "Long/Short for Mixed Market, Long for Bull, Short for Bear")
strat = input(title="Trade Types", defval="Long/Short", options=["Long Only", "Long/Short", "Short Only"])
strat_val = strat == "Long Only" ? 1 : strat == "Long/Short" ? 0 : -1

// Risk Management Inputs
sl= input(10.0, "Stop Loss %", minval = 0, maxval = 100, step = 0.01)
stoploss = sl/100
tp = input(20.0, "Target Profit %", minval = 0, maxval = 100, step = 0.01)
TargetProfit = tp/100


useXRSI = input(false, "Use RSI crossing back, select only one strategy")
useCRSI = input(false, "Use Tweaked Connors RSI, select only one")
RSIInfo = input(true, "These are the RSI Strategy Inputs, RSI Length applies to MACD, set OB and OS to 45 for using Stoch and EMA strategies.")
length = input(14, "RSI Length", minval=1)
overbought= input(62, "Overbought")
oversold= input(35, "Oversold")
cl1 = input(3, "Connor's MA Length 1", minval=1, step=1)
cl2 = input(20, "Connor's MA Lenght 2", minval=1, step=1)
cl3 = input(50, "Connor's MA Lenght 3", minval=1, step=1)

// MACD and EMA Inputs
useMACD = input(false, "Use MACD Only, select only one strategy")
useEMA  = input(false, "Use EMA Only, select only one strategy (EMA uses Stochastic inputs too)")
MACDInfo=input(true, "These are the MACD strategy variables")
fastLength = input(5, minval=1, title="EMA Fast Length")
slowLength = input(10, minval=1, title="EMA Slow Length")
ob_min = input(52, "Overbought Lookback Minimum Value", minval=0, maxval=200)
ob_lb = input(25, "Overbought Lookback Bars", minval=0, maxval=100)
os_min = input(50, "Oversold Lookback Minimum Value", minval=0, maxval=200)
os_lb = input(35, "Oversold Lookback Bars", minval=0, maxval=100)
source = input(title="Source", type=input.source, defval=close)
RSI = rsi(source, length)


// Price Movement Inputs
PriceInfo = input(true, "Price Change Percentage Cross Check Inputs for all Strategies, added logic to avoid early sell")
lkbk = input(5,"Max Lookback Period")

// EMA and SMA Background Inputs
useStoch    = input(false, "Use Stochastic Strategy, choose only one")
StochInfo   = input(true, "Stochastic Strategy Inputs")
smoothK     = input(3, "K", minval=1)
smoothD     = input(3, "D", minval=1)
k_mode      = input("SMA", "K Mode", options=["SMA", "EMA", "WMA"])
high_source = input(high,"High Source")
low_source= input(low,"Low Source")
HTF = input("","Curernt or Higher time frame only", type=input.resolution)

// Selections to show or hide the overlays
showZones = input(true, title="Show Bullish/Bearish Zones")
showStoch = input(true, title="Show Stochastic Overlays")
showRSIBS = input(true, title="Show RSI Buy Sell Zones")
showMACD = input(true, title="Show MACD")
color_bars=input(true, "Color Bars")


// ------------------ Dynamic RSI Calculation ----------------------------------------

AvgHigh(src,cnt,val) =>
    total = 0.0
    count = 0
    for i = 0 to cnt
        if src[i] > val
            count := count + 1
            total := total + src[i]
    round(total / count)

RSI_high = AvgHigh(RSI, ob_lb, ob_min)

AvgLow(src,cnt,val) =>
    total = 0.0
    count = 0
    for i = 0 to cnt
        if src[i] < val
            count := count + 1
            total := total + src[i]
    round(total / count)

RSI_low = AvgLow(RSI, os_lb, os_min)


// ------------------ Price Percentage Change Calculation -----------------------------------------
perc_change(lkbk) =>
    overall_change = ((close[0] - open[lkbk]) / open[lkbk]) * 100
    highest_high = 0.0
    lowest_low = 0.0
    for i = lkbk to 0
        highest_high := i == lkbk ? high : high[i] > high[(i + 1)] ? high[i] : highest_high[1]
        lowest_low := i == lkbk ? low : low[i] < low[(i + 1)] ? low[i] : lowest_low[1]

    start_to_high = ((highest_high - open[lkbk]) / open[lkbk]) * 100
    start_to_low = ((lowest_low - open[lkbk]) / open[lkbk]) * 100
    previous_to_high = ((highest_high - open[1])/open[1])*100
    previous_to_low = ((lowest_low-open[1])/open[1])*100
    previous_bar = ((close[1]-open[1])/open[1])*100

    [overall_change, start_to_high, start_to_low, previous_to_high, previous_to_low, previous_bar]

// Call the function
[overall, to_high, to_low, last_high, last_low, last_bar] = perc_change(lkbk)

// Plot the function
//plot(overall*50, color=color.white, title='Overall Percentage Change', linewidth=3)
//plot(to_high*50, color=color.green,title='Percentage Change from Start to High', linewidth=2)
//plot(to_low*50, color=color.red, title='Percentage Change from Start to Low', linewidth=2)
//plot(last_high*100, color=color.teal, title="Previous to High", linewidth=2)
//plot(last_low*100, color=color.maroon, title="Previous to Close", linewidth=2)
//plot(last_bar*100, color=color.orange, title="Previous Bar", linewidth=2)
//hline(0, title='Center Line', color=color.orange, linewidth=2)

true_dip = overall < 0 and to_high > 0 and to_low < 0 and last_high > 0 and last_low < 0 and last_bar < 0
true_peak = overall > 0 and to_high > 0 and to_low > 0 and last_high > 0 and last_low < 0 and last_bar > 0

alertcondition(true_dip, title='True Dip', message='Dip')
alertcondition(true_peak, title='True Peak', message='Peak')

// ------------------ Background Colors based on EMA Indicators -----------------------------------
// Uses standard lengths of 9 and 21, if you want control delete the constant definition and uncomment the inputs
haClose(gap) => (open[gap] + high[gap] + low[gap] + close[gap]) / 4
rsi_ema = rsi(haClose(0), length)
v2 = ema(rsi_ema, length)
v3 = 2 * v2 - ema(v2, length)
emaA = ema(rsi_ema, fastLength)
emaFast = 2 * emaA - ema(emaA, fastLength)
emaB = ema(rsi_ema, slowLength)
emaSlow = 2 * emaB - ema(emaB, slowLength)

//plot(rsi_ema, color=color.white, title='RSI EMA', linewidth=3)
//plot(v2, color=color.green,title='v2', linewidth=2)
//plot(v3, color=color.red, title='v3', linewidth=2)
//plot(emaFast, color=color.teal, title="EMA Fast", linewidth=2)
//plot(emaSlow, color=color.maroon, title="EMA Slow", linewidth=2)

EMABuy = crossunder(emaFast, v2) and window()
EMASell = crossover(emaFast, emaSlow) and window()


alertcondition(EMABuy, title='EMA Buy', message='EMA Buy Condition')
alertcondition(EMASell, title='EMA Sell', message='EMA Sell Condition')


// bullish signal rule:
bullishRule =emaFast > emaSlow
// bearish signal rule:
bearishRule =emaFast < emaSlow

// current trading State
ruleState = 0
ruleState := bullishRule ? 1 : bearishRule ? -1 : nz(ruleState[1])
ruleColor = ruleState==1 ? color.new(color.blue, 90) : ruleState == -1 ? color.new(color.red, 90) : ruleState == 0 ? color.new(color.gray, 90) : na
bgcolor(showZones ? ruleColor : na, title="Bullish/Bearish Zones")


// ------------------  Stochastic Indicator Overlay -----------------------------------------------

// Calculation
// Use highest highs and lowest lows
h_high = highest(high_source ,lkbk)
l_low = lowest(low_source ,lkbk)

stoch = stoch(RSI, RSI_high, RSI_low, length)
k =
 k_mode=="EMA" ? ema(stoch, smoothK) :
 k_mode=="WMA" ? wma(stoch, smoothK) :
 sma(stoch, smoothK)
d = sma(k, smoothD)
k_c = change(k)
d_c = change(d)
kd = k - d

// Plot
signalColor = k>oversold and d<overbought and k>d and k_c>0 and d_c>0 ? kcolor :
 k<overbought and d>oversold and k<d and k_c<0 and d_c<0 ? dcolor : na
kp = plot(showStoch ? k : na, "K", color=kcolor)
dp = plot(showStoch ? d : na, "D", color=dcolor)
fill(kp, dp, color = signalColor, title="K-D")
signalUp = showStoch ? not na(signalColor) and kd>0 : na
signalDown = showStoch ? not na(signalColor) and kd<0 : na
//plot(signalUp ? kd : na, "Signal Up", color=kcolor, transp=90, style=plot.style_columns)
//plot(signalDown ? (kd+100) : na , "Signal Down", color=dcolor, transp=90, style=plot.style_columns, histbase=100)

//StochBuy = crossover(k, d) and kd>0 and to_low<0 and window()
//StochSell = crossunder(k,d) and kd<0 and to_high>0 and window()

StochBuy = crossover(k, d) and window()
StochSell = crossunder(k, d) and window()

alertcondition(StochBuy, title='Stoch Buy', message='K Crossing D')
alertcondition(StochSell, title='Stoch Sell', message='D Crossing K')


// -------------- Add Price Movement -------------------------
// Calculations
h1 = vwma(high, length)
l1 = vwma(low, length)
hp = h_high[1]
lp = l_low[1]

// Plot
var plot_color=#353535
var sig = 0
if (h1 >hp)
    sig:=1
    plot_color:=color.lime
else if (l1 <lp)
    sig:=-1
    plot_color:=color.maroon
//plot(1,title = "Price Movement Bars", style=plot.style_columns,color=plot_color)
//plot(sig,title="Signal 1 or -1",display=display.none)


// --------------------------------------- RSI Plot ----------------------------------------------
// Plot Oversold and Overbought Lines
over = hline(oversold, title="Oversold", color=color.green)
under = hline(overbought, title="Overbought", color=color.red)
fillcolor = color.new(#9915FF, 90)
fill(over, under, fillcolor, title="Band Background")


// Show RSI and EMA crosses with arrows and RSI Color (tweaked Connors RSI)
// Improves strategy setting ease by showing where EMA 5 crosses EMA 10 from above to confirm overbought conditions or trend reversals
// This shows where you should enter shorts or exit longs

// Tweaked Connors RSI Calculation
connor_ob = overbought
connor_os = oversold
ma1 = sma(close,cl1)
ma2 = sma(close, cl2)
ma3 = sma(close, cl3)

// Buy Sell Zones using tweaked Connors RSI (RSI values of 80 and 20 for Crypto as well as ma3, ma20, and ma50 are the tweaks)
RSI_SELL = ma1 > ma2 and open > ma3 and RSI >= connor_ob and true_peak and window()
RSI_BUY = ma2 < ma3 and ma3 > close and RSI <= connor_os and true_dip and window()

alertcondition(RSI_BUY, title='Connors Buy', message='Connors RSI Buy')
alertcondition(RSI_SELL, title='Connors Sell', message='Connors RSI Sell')

// Color Definition
col = useCRSI ? (close > ma2 and close < ma3 and RSI <= connor_os ? color.lime : close < ma2 and close > ma3 and RSI <= connor_ob ? color.red : color.yellow ) : color.yellow

// Plot colored RSI Line
plot(RSI, title="RSI", linewidth=3, color=col)


//------------------- MACD Strategy -------------------------------------------------
[macdLine, signalLine, _] = macd(close, fastLength, slowLength, length)

bartrendcolor = macdLine > signalLine and k > 50 and RSI > 50 ? color.teal : macdLine < signalLine and k < 50 and RSI < 50 ? color.maroon : macdLine < signalLine ? color.yellow : color.gray
barcolor(color = color_bars ? bartrendcolor : na)


MACDBuy = macdLine>signalLine and RSI<RSI_low and overall<0 and window()
MACDSell = macdLine<signalLine and RSI>RSI_high and overall>0 and window()

//plotshape(showMACD ? MACDBuy: na, title = "MACD Buy", style = shape.arrowup, text = "MACD Buy", color=color.green, textcolor=color.green, size=size.small)
//plotshape(showMACD ? MACDSell: na, title = "MACD Sell", style = shape.arrowdown, text = "MACD Sell", color=color.red, textcolor=color.red, size=size.small)
MACColor = MACDBuy ? color.new(color.teal, 50) : MACDSell ? color.new(color.maroon, 50) : na
bgcolor(showMACD ? MACColor : na, title ="MACD Signals")


// -------------------------------- Entry and Exit Logic ------------------------------------


// Entry Logic
XRSI_OB = crossunder(RSI, overbought) and overall<0 and window()
RSI_OB = RSI>overbought and true_peak and window()
XRSI_OS = crossover(RSI, oversold) and overall>0 and window()
RSI_OS = RSI<oversold and true_dip and window()

alertcondition(XRSI_OB, title='Reverse RSI Sell', message='RSI Crossing back under OB')
alertcondition(XRSI_OS, title='Reverse RSI Buy', message='RSI Crossing back over OS')

alertcondition(RSI_OS, title='RSI Buy', message='RSI Crossover OS')
alertcondition(RSI_SELL, title='RSI Sell', message='RSI Crossunder OB')


// Strategy Entry and Exit with built in Risk Management
GoLong = strategy.position_size==0 and strat_val > -1 and rsi_ema > RSI and k < d ? (useXRSI ? XRSI_OS : useMACD ? MACDBuy : useCRSI ? RSI_BUY : useStoch ? StochBuy : RSI_OS) : false

GoShort = strategy.position_size==0 and strat_val < 1 and rsi_ema < RSI and d < k ? (useXRSI ? XRSI_OB : useMACD ? MACDSell : useCRSI ? RSI_SELL : useStoch ? StochSell : RSI_OB) : false

if (GoLong)
    strategy.entry("LONG", strategy.long)

if (GoShort)
    strategy.entry("SHORT", strategy.short)


longStopPrice  = strategy.position_avg_price * (1 - stoploss)
longTakePrice  = strategy.position_avg_price * (1 + TargetProfit)
shortStopPrice = strategy.position_avg_price * (1 + stoploss)
shortTakePrice = strategy.position_avg_price * (1 - TargetProfit)

//plot(series=(strategy.position_size > 0) ? longTakePrice : na, color=color.green, style=plot.style_circles, linewidth=3, title="Long Take Profit")
//plot(series=(strategy.position_size < 0) ? shortTakePrice : na, color=color.green, style=plot.style_circles, linewidth=3, title="Short Take Profit")
//plot(series=(strategy.position_size > 0) ? longStopPrice : na, color=color.red, style=plot.style_cross, linewidth=2, title="Long Stop Loss")
//plot(series=(strategy.position_size < 0) ? shortStopPrice : na, color=color.red, style=plot.style_cross, linewidth=2, title="Short Stop Loss")

if (strategy.position_size > 0)
    strategy.exit(id="Exit Long", from_entry = "LONG", stop = longStopPrice, limit = longTakePrice)

if (strategy.position_size < 0)
    strategy.exit(id="Exit Short", from_entry = "SHORT", stop = shortStopPrice, limit = shortTakePrice)


CloseLong = strat_val > -1 and strategy.position_size > 0 and rsi_ema > RSI and d > k ? (useXRSI ? XRSI_OB : useMACD ? MACDSell : useCRSI ? RSI_SELL : RSI_OB) : false

if(CloseLong)
    strategy.close("LONG")

CloseShort = strat_val < 1 and strategy.position_size < 0 and rsi_ema < RSI and k > d ? (useXRSI ? XRSI_OS : useMACD ? MACDBuy : useCRSI ? RSI_BUY : RSI_OS) : false

if(CloseShort)
    strategy.close("SHORT")
Detail
https://www.fmz.com/strategy/435098
Last Modified
2023-12-12 12:02:13