
11 KiB
Name
多因子动量轮动策略Multi-factor-Momentum-Rotation-Strategy
Author
ChaoZhang
Strategy Description
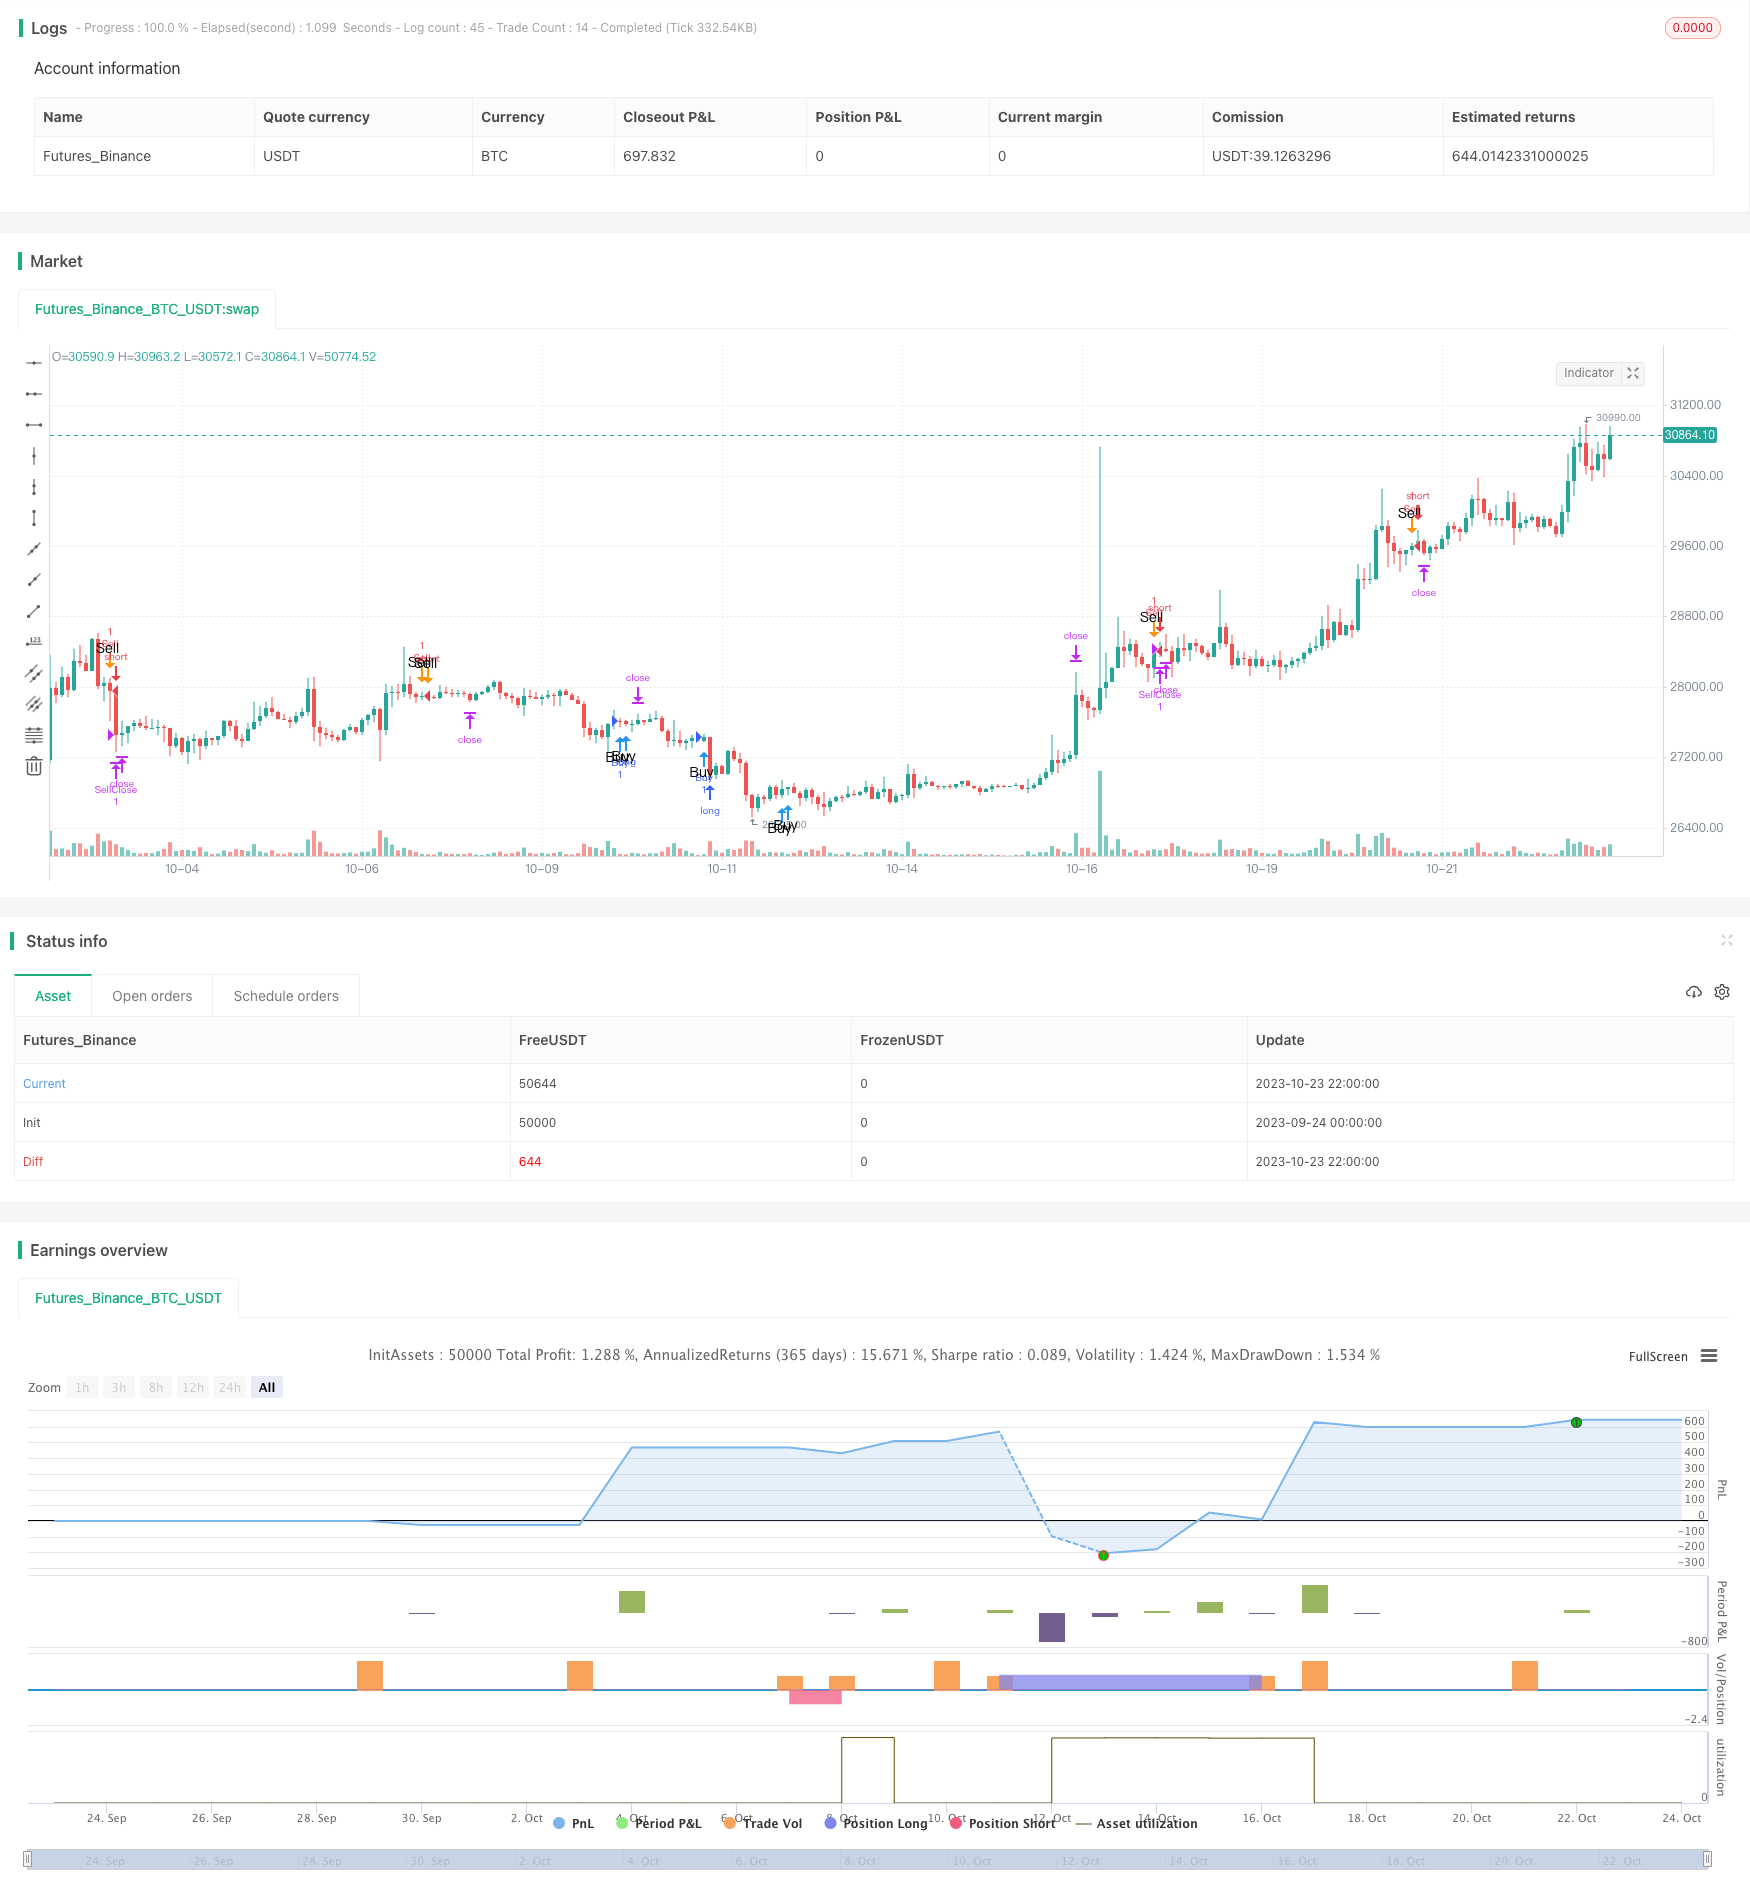
[trans]
概述
本策略综合利用RSI、均线MACD、布林带和涨跌停因子,实现多因子动量轮动交易。策略首先判断多个技术指标是否同时发出买入或卖出信号,如果是,则进行相应的买入或卖出操作。同时,策略采用移动止盈和止损来锁定利润和控制风险。
策略原理
本策略主要包含以下几个部分:
-
判断因子
- RSI:计算14周期RSI,判断是否低于设置的买入线或高于设置的卖出线
- TD序列:计算涨跌停天数,判断是否达到买入卖出条件
- MACD:计算MACD和MACD历史值,判断是否达到买入卖出条件
- 布林带:计算20日布林带,判断价格是否触及布林带上下轨
-
入场与出场
- 买入条件:RSI、MACD、TD序列同时发出买入信号时,进行买入
- 卖出条件:RSI、MACD、TD序列同时发出卖出信号时,进行卖出
- 止盈:以固定点数或百分比进行移动止盈
- 止损:设定最大容忍损失点数,做止损
-
策略优化
- 调整RSI参数:优化RSI的周期参数
- 调整MA周期:优化均线的周期参数
- 调整入场条件:增加或减少入场信号
- 增加其他因子:结合更多技术指标和统计因子
策略优势分析
-
多因子组合,确保入场的准确性
本策略不仅考虑单一技术指标,而是结合RSI、MACD、TD序列等多个因子,这样可以减少因单一指标造成的假信号,提高入场的准确性。
-
动量特征,捕捉趋势
RSI、MACD等指标具有较明显的动量特征,能捕捉到股价的趋势变化。与均线等趋势跟踪指标相比,这些指标转折更为灵敏。
-
止盈止损机制,控制风险
移动止盈可以随着行情运行动态止盈,较好地锁定利润。止损设置则可以控制单笔损失。
-
策略思路清晰简单
本策略结合常用技术指标,具有一定的通用性。规则相对简单清晰,容易理解和操作。
策略风险分析
-
多头行情下效果较差
本策略以逆市操作为主,属于反转策略。在牛市中,采用本策略可能会频繁停损,效果不佳。
-
交易频率可能过高
若参数设置得太敏感,则交易频率可能会过高,增加交易成本和滑点损失。
-
指标发散风险
本策略依赖多种指标同方向信号,但有时各指标也可能出现分歧,从而发出错误信号。
-
止损被追穿风险
设置固定止损点数可能会被突破,可以设置动态止损或考虑换股来规避该风险。
策略优化方向
-
优化参数,减少交易频率
可以测试RSI的参数以及均线的周期参数,找到交易频率较低的组合。
-
增加统计因子,提高效率
可以结合股票自己的统计特性,如波动率、流动性等来设定参数,提高策略效率。
-
结合VIX等全市场指标
可以根据VIX等全市场恐慌指数来调整策略的参数,在市场 panic 时降低交易频率。
-
测试不同持仓时间
可以测试不同的持仓周期,判断长期持有或短期轮动对策略效果的影响。
-
优化和测试止盈止损策略
可以研究更先进的动态止盈止损方式,回测效果。
总结
本策略综合考虑多种技术指标,在确保较高入场准确率的基础上,采用移动止盈止损来锁定利润和控制风险。策略思路简单清晰,容易理解操作,可通过参数优化和指标优选进一步提升效果。但该策略更适合逆市和震荡行情,在持续上涨行情中效果可能较差。本策略为典型的多因子动量反转策略,可为股票轮动交易提供思路和参考。
||
Overview
This strategy combines RSI, MACD, Bollinger Bands and limit up/down factors to implement multi-factor momentum rotation trading. The strategy first judges if multiple technical indicators give buy or sell signals simultaneously. If so, corresponding buy or sell operations will be executed. Meanwhile, the strategy adopts moving stop profit and stop loss to lock in profits and control risks.
Strategy Logic
The main components of this strategy are:
-
Factor judgement
- RSI: Calculate 14-period RSI and judge if it is lower than the buy line or higher than the sell line
- TD Sequence: Calculate number of limit up/down days and judge if it meets buy/sell conditions
- MACD: Calculate MACD and MACD Histogram to judge buy/sell conditions
- Bollinger Bands: Calculate 20-period BBs and judge if price touches BBs' upper or lower band
-
Entry and exit
- Buy condition: RSI, MACD, TD Sequence give buy signals together
- Sell condition: RSI, MACD, TD Sequence give sell signals together
- Stop profit: Use fixed points or percentage as trailing stop profit
- Stop loss: Set maximum tolerated loss points for stop loss
-
Strategy optimization
- Adjust RSI parameters: Optimize RSI period parameter
- Adjust MA period: Optimize period parameter of Moving Averages
- Adjust entry conditions: Add or reduce entry signals
- Add other factors: Incorporate more technical indicators and statistical factors
Advantage Analysis
-
Multiple factors improve entry accuracy
The strategy considers multiple factors like RSI and MACD rather than just single indicator. This reduces false signals and improves entry accuracy.
-
Momentum characteristic captures trends
Indicators like RSI and MACD have obvious momentum characteristic, which capture price trend changes. They are more sensitive than trend following indicators like MAs.
-
Stop profit/loss mechanism controls risks
Moving stop profit can lock in profits dynamically following the market. Stop loss setting controls single trade loss.
-
Simple and clear logic
The strategy combines common technical indicators and has certain universality. Its rules are relatively simple and clear.
Risk Analysis
-
Poor performance in bull market
The strategy focuses on mean-reversion trading. It may trigger frequent stop loss in a bull market.
-
Potentially too high trading frequency
If parameters are set too sensitively, trading frequency may be too high, increasing costs and slippage.
-
Divergence risk across indicators
The strategy relies on consistent signals across indicators, but sometimes divergences may happen, resulting in wrong signals.
-
Stop loss being penetrated
Fixed stop loss points may be penetrated. Dynamic stop loss or stock change may help avoid this risk.
Optimization Directions
-
Optimize parameters to reduce trading frequency
Test RSI parameters and MA periods to find combinations with lower trading frequency.
-
Add statistical factors to improve efficiency
Incorporate stock-specific stats like volatility and liquidity to set parameters and improve efficiency.
-
Combine market-level indicators like VIX
Adjust strategy parameters based on market panic indicators like VIX to reduce trading frequency during market-wide crashes.
-
Test different holding periods
Test long-term holding versus short-term rotation to see their impact on strategy performance.
-
Optimize and test stop profit/loss
Research more advanced dynamic stop profit/loss techniques and backtest them.
Summary
This strategy combines multiple technical indicators and adopts moving stop profit/loss to lock in profits and control risks while ensuring high entry accuracy. The logic is simple and clear. Performance can be further improved through parameter optimization and indicator selection. But the strategy is more suitable for mean-reversion and range-bound markets. It may underperform in persistent uptrends. In summary, this is a typical multi-factor mean-reversion momentum strategy that provides ideas and reference for stock rotation trading.
[/trans]
Strategy Arguments
| Argument | Default | Description |
|---|---|---|
| v_input_1 | -7 | RSI Difference |
| v_input_2 | 50 | Profit |
| v_input_3 | 10 | Profit |
| v_input_4 | false | Use Stop Loss? |
| v_input_5 | 145 | Stop Loss |
| v_input_6 | 100 | 0-show / 100-hide Strategy |
Source (PineScript)
/*backtest
start: 2023-09-24 00:00:00
end: 2023-10-24 00:00:00
period: 2h
basePeriod: 15m
exchanges: [{"eid":"Futures_Binance","currency":"BTC_USDT"}]
*/

//@version=2
strategy("RSI, TD Seq, MACD, BB Strategy - Calculation Trailing Profit",overlay=true)


RSIDifference = input(-7, minval=-50, maxval=50, title="RSI Difference")


TD = close > close[4] ?nz(TD[1])+1:0
TS = close < close[4] ?nz(TS[1])+1:0
TDUp = TD - valuewhen(TD < TD[1], TD , 1 )
TDDn = TS - valuewhen(TS < TS[1], TS , 1 )
TDcheckUP = iff(TD == 2, true, false)
TDCheckDOWN = iff(TS == 2, true, false)

[_, _, histLine] = macd(close, 12, 26, 9)
MACDCheckDown = iff(histLine > 0 and histLine[1] > 0 and histLine[2] > 0 and histLine[3] > 0  and histLine[4] > 0, true, false)
MACDCheckUp = iff(histLine < 0 and histLine[1] < 0 and histLine[2] < 0 and histLine[3] < 0 and histLine[4] < 0, true, false)

RSICal = rsi(close, 14)
RSICalNewUp = 50 + RSIDifference
RSICalNewDown = 50 - RSIDifference
RSICheckUp = iff(RSICal <= RSICalNewUp, true, false)
RSICheckDown = iff(RSICal >= RSICalNewDown, true, false)

basis = sma(close, 20)
dev = 2 * stdev(close, 20)
upperBB = basis + dev
lowerBB = basis - dev
BBCheckUp = iff(close > upperBB, true, false)
BBCheckDown = iff(close < lowerBB, true, false)
//BBCheckUp = false
//BBCheckDown = false


BuyCheck = iff(TDcheckUP == true and MACDCheckUp == true and RSICheckUp == true and BBCheckUp == false, true, false)
SellCheck = iff(TDCheckDOWN == true and MACDCheckDown == true and RSICheckDown == true and BBCheckDown == false, true, false)


ProfitStratA = input(50, minval=0, maxval=10000, title="Profit", step=0.5)
ProfitTrailingA = input(10, minval=0, maxval=10000, title="Profit", step=0.5)
useStopLoss = input(false, title="Use Stop Loss?")
LossstratA = input(145, minval=0, maxval=10000, title="Stop Loss", step=0.5)
colB = input(100, minval=0, maxval=100, title="0-show / 100-hide Strategy", step=100)

ProfitStrat = ProfitStratA * 10
ProfitTrailing = ProfitTrailingA * 10
Lossstrat = useStopLoss ? LossstratA * 10 : 1000000

if (strategy.position_size > 0)
    strategy.exit("BuyClose", "Buy", trail_points=ProfitStrat, trail_offset=ProfitTrailing, loss=Lossstrat)


if (strategy.position_size < 0)
    strategy.exit("SellClose", "Sell", trail_points=ProfitStrat, trail_offset=ProfitTrailing, loss=Lossstrat)


if (BuyCheck == true and strategy.position_size == 0)
    strategy.entry("Buy", strategy.long, comment="Long Entry")


if (SellCheck == true and strategy.position_size == 0)
    strategy.entry("Sell", strategy.short, comment="Short Entry")


plotshape(BuyCheck, color=blue, transp=colB, style=shape.arrowup, text="Buy\n", location=location.belowbar)
plotshape(SellCheck, color=orange, transp=colB, style=shape.arrowdown, text="Sell\n", location=location.abovebar)
Detail
https://www.fmz.com/strategy/430127
Last Modified
2023-10-25 11:52:19